Hybrid and Multicloud Monitoring
Overview
Monitoring workloads that span AWS and on-premises (or other cloud) environments requires a unified collection and visualization strategy. The CloudWatch agent runs on non-AWS hosts, forwarding metrics and logs to CloudWatch. For environments already using Prometheus, Amazon Managed Service for Prometheus (AMP) accepts remote-write from any network-reachable exporter. Amazon Managed Grafana (AMG) ties both backends together in a single dashboard, regardless of where the workload runs.
This entry covers the pattern of installing the CloudWatch agent on non-AWS hosts, configuring AMP remote write for Prometheus-scraped metrics, and using AMG as the unifying visualization layer. For the full installation reference, see Installing the CloudWatch agent on on-premises servers.
Prerequisites
- An AWS account with IAM permissions for CloudWatch, AMP, and AMG
- On-premises or non-AWS hosts with network connectivity to AWS endpoints (HTTPS 443)
- IAM user with programmatic access (access key) for on-premises agent authentication
- CloudWatch agent downloaded for the target OS
- (Optional) An existing Prometheus server for AMP remote-write
- (Optional) Amazon Managed Grafana workspace with SSO configured
Architecture
The signal flow for hybrid monitoring uses CloudWatch agent on each host, sending metrics and logs to CloudWatch. Prometheus exporters remote-write to AMP. AMG queries both backends.
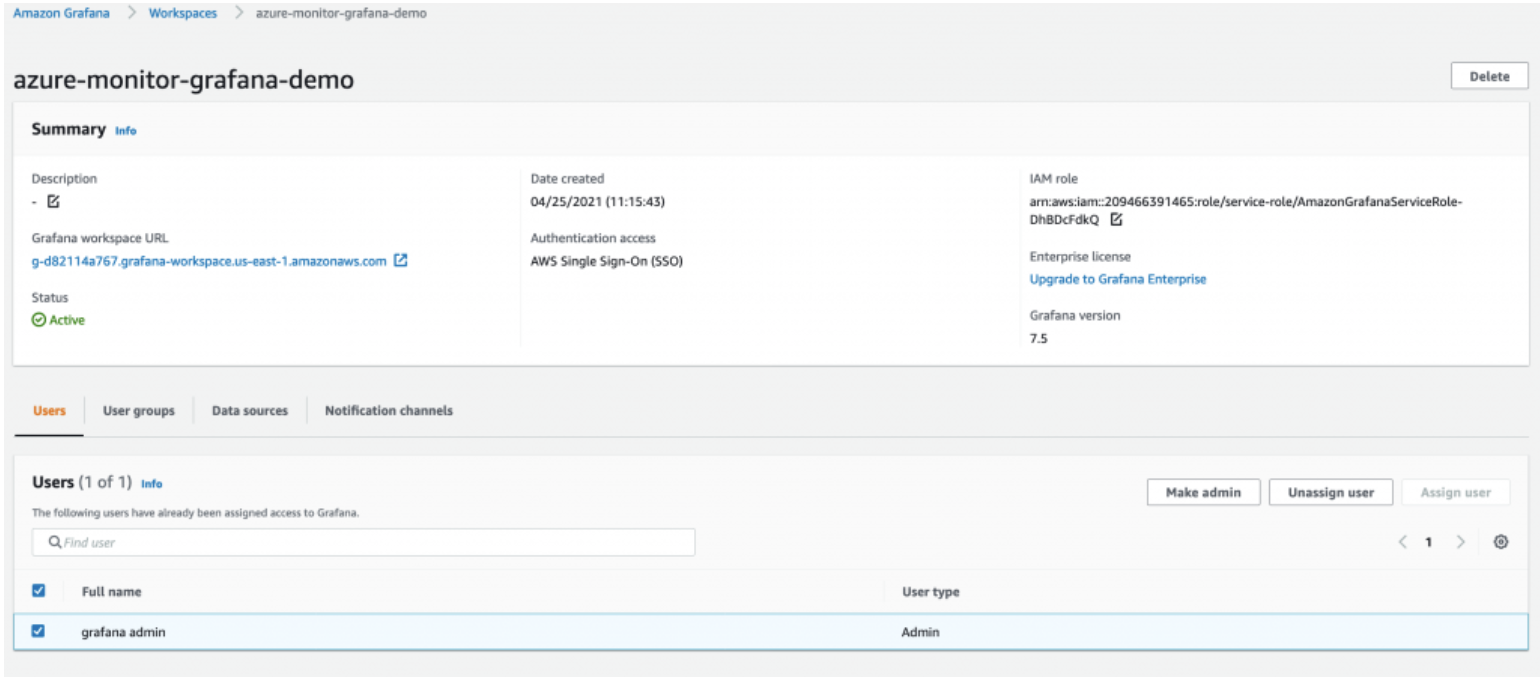 AMG workspace connecting to multiple data sources across environments
┌─────────────────────┐       ┌──────────────────────┐
│  On-premises hosts  │       │   AWS workloads      │
│  (CW Agent)         │       │   (CW Agent / ADOT)  │
└────────┬────────────┘       └──────────┬───────────┘
         │ HTTPS                          │
         ▼                                ▼
┌─────────────────────────────────────────────────────┐
│              Amazon CloudWatch                       │
│         (Metrics + Logs)                            │
└────────────────────────┬────────────────────────────┘
                         │
         ┌───────────────┼───────────────┐
         ▼                               ▼
┌─────────────────┐             ┌─────────────────┐
│  Prometheus     │ remote-write│  Amazon Managed │
│  (on-prem)      │────────────▶│  Prometheus     │
└─────────────────┘             └────────┬────────┘
                                         │
                                         ▼
                              ┌─────────────────────┐
                              │  Amazon Managed     │
                              │  Grafana (AMG)      │
                              └─────────────────────┘
Deploy
Install CloudWatch agent on non-AWS hosts
- Download the CloudWatch agent package for your OS:
# Amazon Linux / RHEL
sudo yum install amazon-cloudwatch-agent

# Debian / Ubuntu
wget https://s3.amazonaws.com/amazoncloudwatch-agent/ubuntu/amd64/latest/amazon-cloudwatch-agent.deb
sudo dpkg -i amazon-cloudwatch-agent.deb
-
Create an IAM user with
CloudWatchAgentServerPolicyand generate access keys. -
Configure AWS credentials on the host:
sudo aws configure --profile AmazonCloudWatchAgent
# Enter the access key, secret key, and region
- Run the agent configuration wizard or supply a config file:
sudo /opt/aws/amazon-cloudwatch-agent/bin/amazon-cloudwatch-agent-config-wizard
- Start the agent:
sudo /opt/aws/amazon-cloudwatch-agent/bin/amazon-cloudwatch-agent-ctl \
  -a fetch-config \
  -m onPremise \
  -s \
  -c file:/opt/aws/amazon-cloudwatch-agent/etc/amazon-cloudwatch-agent.json
Configure AMP remote write (optional)
- In your Prometheus server configuration, add the remote-write endpoint:
remote_write:
  - url: https://aps-workspaces.<region>.amazonaws.com/workspaces/<workspace-id>/api/v1/remote_write
    sigv4:
      region: <region>
    queue_config:
      max_samples_per_send: 1000
      max_shards: 200
      capacity: 2500
- Ensure the host or instance profile has
aps:RemoteWritepermission.
Configure AMG data sources
-
In your AMG workspace, add Amazon CloudWatch and Amazon Managed Service for Prometheus as data sources.
-
Create or import dashboards that query both sources to provide a unified view.
Validate
- On the on-premises host, verify the agent is running:
sudo /opt/aws/amazon-cloudwatch-agent/bin/amazon-cloudwatch-agent-ctl -a status
-
In the CloudWatch console, navigate to Metrics → All metrics and confirm the custom namespace from your on-premises host appears.
-
For AMP, use
awscurlto query the workspace:
awscurl --service aps --region <region> \
  "https://aps-workspaces.<region>.amazonaws.com/workspaces/<workspace-id>/api/v1/query?query=up"
- In AMG, open a dashboard and confirm panels populate with data from both CloudWatch and AMP sources.
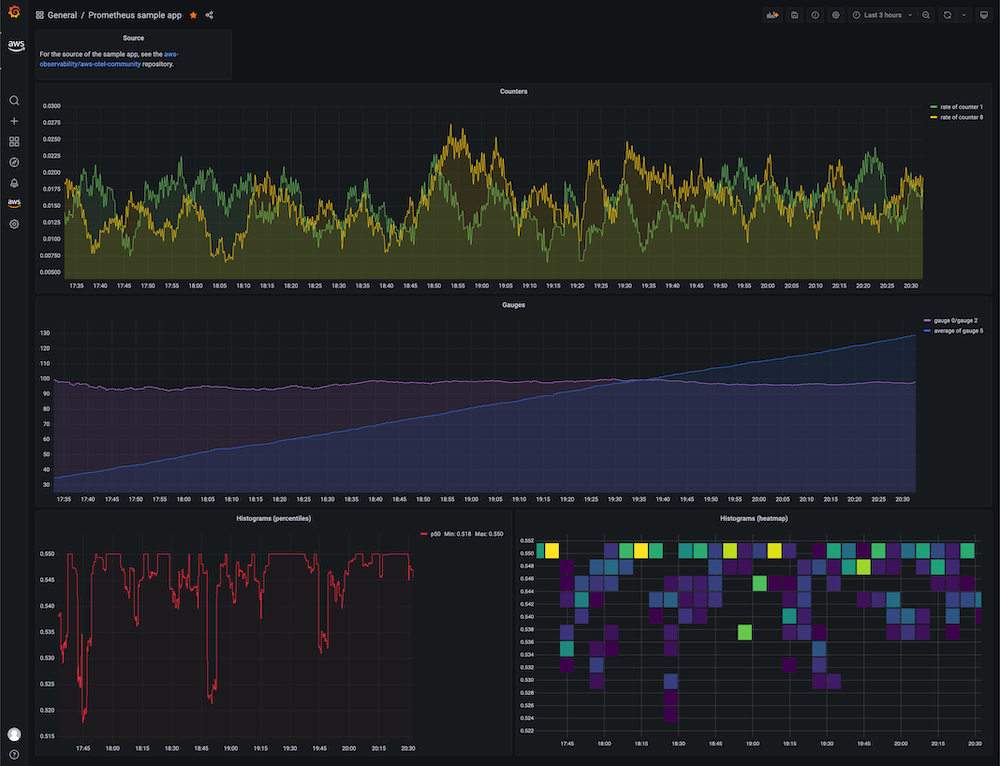 AMG dashboard showing metrics from AMP data source
Troubleshoot
| Symptom | Likely Cause | Fix |
|---|---|---|
Agent status shows stopped on on-premises host | Invalid credentials or expired access keys | Regenerate IAM access keys and reconfigure with aws configure --profile AmazonCloudWatchAgent |
| Metrics namespace not appearing in CloudWatch | Agent config missing metrics_collected section or wrong region | Review /opt/aws/amazon-cloudwatch-agent/etc/amazon-cloudwatch-agent.json and verify the region matches your console view |
| AMP remote write returns 403 | Missing aps:RemoteWrite IAM permission or incorrect SigV4 signing | Attach AmazonPrometheusRemoteWriteAccess policy to the IAM entity used for signing |
| AMG dashboard panels show "No data" | Data source not configured or IAM role missing read permissions | Verify the AMG workspace IAM role has aps:QueryMetrics and cloudwatch:GetMetricData permissions |