RDS & Aurora Monitoring
Related Events
Overview
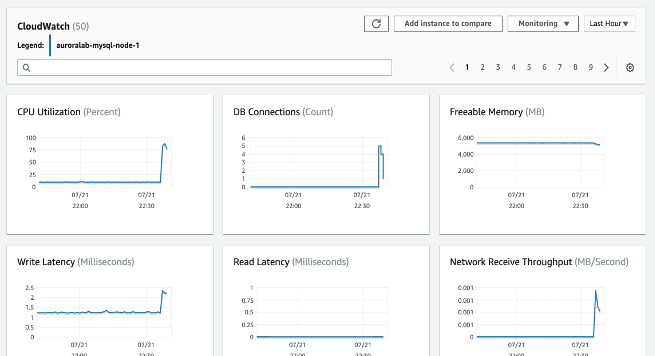
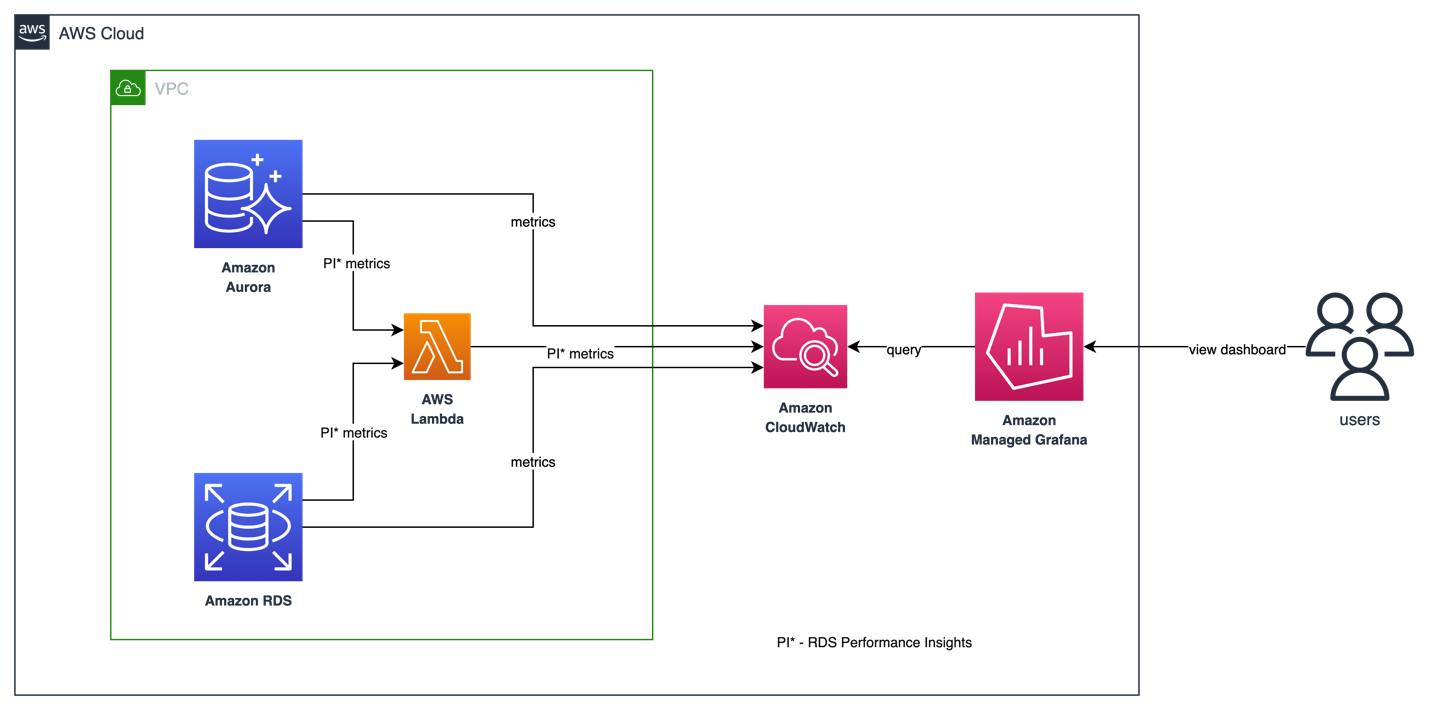
Amazon RDS and Aurora publish instance-level metrics to CloudWatch in the AWS/RDS namespace at 1-minute granularity by default. Combined with Performance Insights, Database Insights, Enhanced Monitoring, and database log export, you get complete visibility into database health without installing any agents.
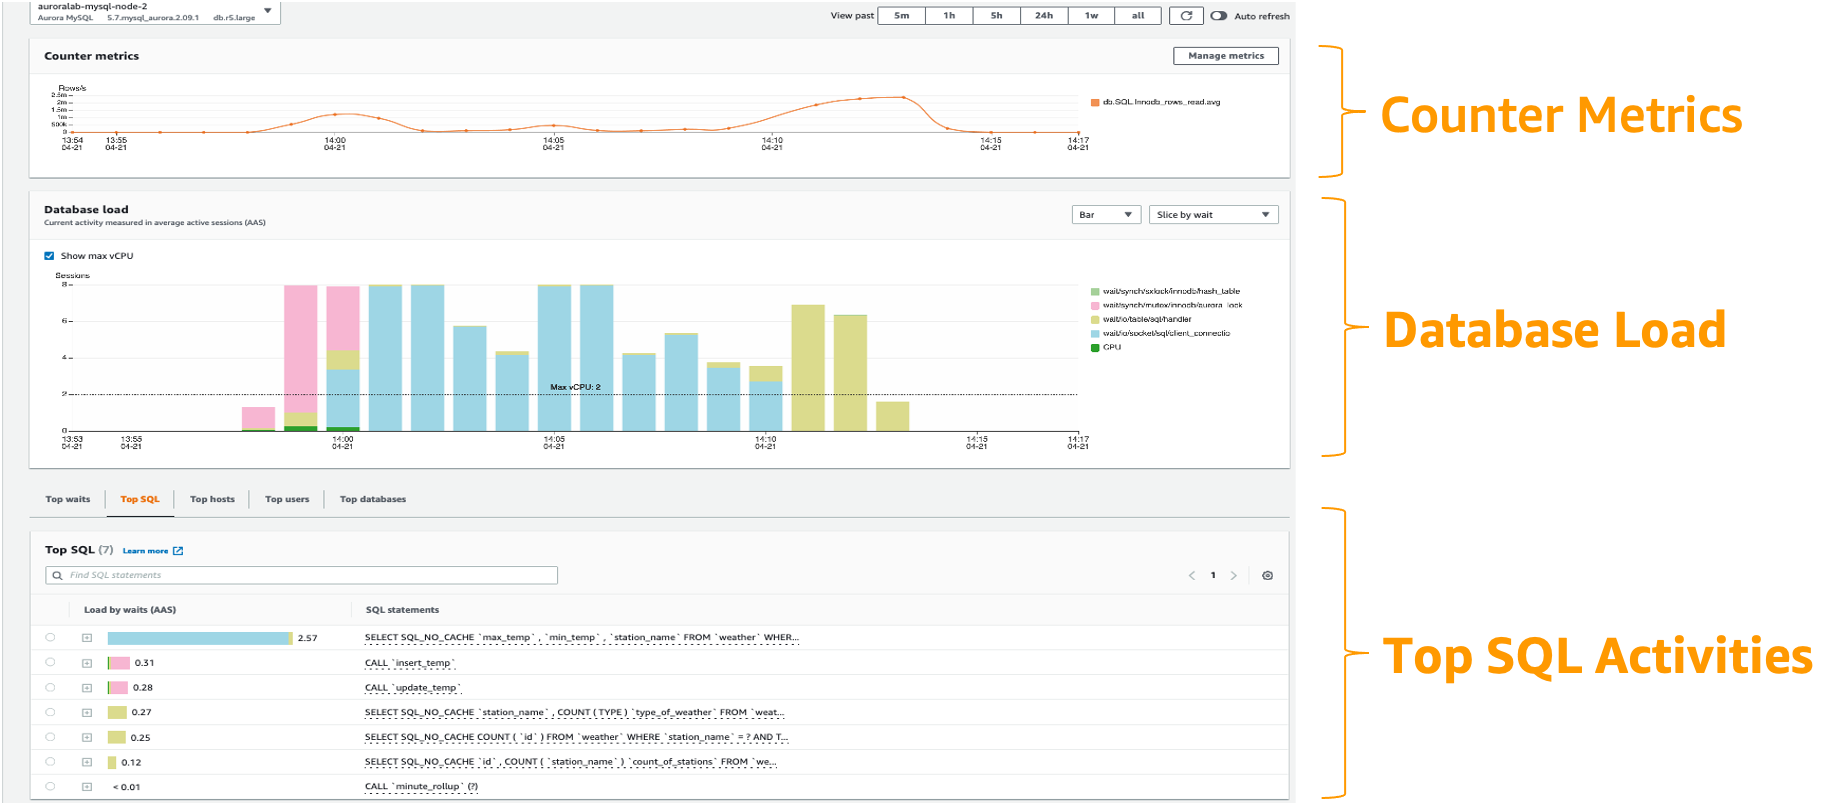
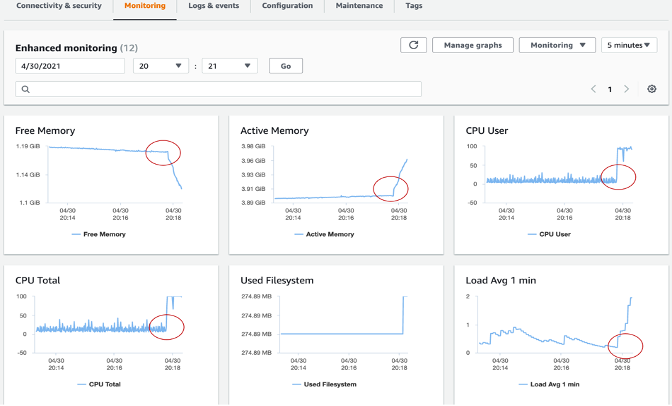
This entry covers four complementary layers: CloudWatch metrics for high-level KPIs and alarms, Performance Insights for DB load analysis and query-level diagnostics, Database Insights for fleet-wide monitoring with lock and execution plan analysis, and Enhanced Monitoring for OS-level process visibility on the database host.
Start by establishing baseline performance during both peak and off-peak hours. Capture average, maximum, and minimum values across a two-week window — this baseline is what you alert against.
For complete reference material, see Monitoring Amazon RDS and CloudWatch Database Insights.
Prerequisites
- Amazon RDS or Aurora DB instance (any supported engine)
- IAM permissions:
rds:Describe*,cloudwatch:GetMetricData,cloudwatch:PutMetricAlarm,pi:GetResourceMetrics,logs:* - For Enhanced Monitoring:
monitoring-rds-enhanced-roleIAM role (orAmazonRDSEnhancedMonitoringRolemanaged policy) - For Database Insights Advanced: Performance Insights enabled with 15-month retention
- For log analysis: Database log export to CloudWatch Logs enabled
Architecture
┌──────────────────────────────────────────────────────────────┐
│                 Amazon RDS / Aurora                           │
│                                                              │
│  ┌──────────────┐  ┌────────────────┐  ┌─────────────────┐  │
│  │ DB Engine    │  │ Enhanced Mon.  │  │ Performance     │  │
│  │ Metrics      │  │ Agent (OS)     │  │ Insights Agent  │  │
│  └──────┬───────┘  └───────┬────────┘  └───────┬─────────┘  │
└─────────┼──────────────────┼────────────────────┼────────────┘
          │                  │                    │
          ▼                  ▼                    ▼
┌──────────────────────────────────────────────────────────────┐
│                    Amazon CloudWatch                          │
│                                                              │
│  ┌──────────────┐  ┌────────────────┐  ┌─────────────────┐  │
│  │ AWS/RDS      │  │ RDSOSMetrics   │  │ Database        │  │
│  │ Namespace    │  │ Log Group      │  │ Insights        │  │
│  └──────────────┘  └────────────────┘  └─────────────────┘  │
│                                                              │
│  ┌──────────────────────────────────────────────────────┐    │
│  │ Alarms → SNS → PagerDuty / Slack / Email            │    │
│  └──────────────────────────────────────────────────────┘    │
└──────────────────────────────────────────────────────────────┘
Deploy
Step 1: Enable Enhanced Monitoring
aws rds modify-db-instance \
  --db-instance-identifier my-database \
  --monitoring-interval 60 \
  --monitoring-role-arn arn:aws:iam::123456789012:role/rds-monitoring-role \
  --apply-immediately
Granularity options: 1, 5, 10, 15, 30, or 60 seconds.
Step 2: Enable Performance Insights
aws rds modify-db-instance \
  --db-instance-identifier my-database \
  --enable-performance-insights \
  --performance-insights-retention-period 731 \
  --apply-immediately
Step 3: Enable log export to CloudWatch Logs
aws rds modify-db-instance \
  --db-instance-identifier my-database \
  --cloudwatch-logs-export-configuration '{
    "EnableLogTypes": ["postgresql", "upgrade"]
  }' \
  --apply-immediately
For MySQL: use ["audit", "error", "general", "slowquery"].
Step 4: Create CloudWatch alarms on key metrics
aws cloudwatch put-metric-alarm \
  --alarm-name "RDS-HighCPU-my-database" \
  --namespace AWS/RDS \
  --metric-name CPUUtilization \
  --dimensions Name=DBInstanceIdentifier,Value=my-database \
  --statistic Average \
  --period 300 \
  --threshold 80 \
  --comparison-operator GreaterThanThreshold \
  --evaluation-periods 3 \
  --alarm-actions arn:aws:sns:us-east-1:123456789012:db-alerts
Key metrics to alarm on:
| Metric | Threshold Guidance |
|---|---|
CPUUtilization | > 80% sustained |
FreeableMemory | < 25% of instance memory |
FreeStorageSpace | < 15% of allocated storage |
DatabaseConnections | > 80% of max_connections |
ReadLatency / WriteLatency | > 20ms sustained |
Step 5: Enable Database Insights Advanced (optional)
Navigate to CloudWatch → Database Insights in the console and select your cluster to enable Advanced mode. This activates fleet health views, lock analysis, and 15-month retention.
Validate
-
CloudWatch metrics: Confirm data in the
AWS/RDSnamespace:aws cloudwatch get-metric-statistics \
--namespace AWS/RDS \
--metric-name CPUUtilization \
--dimensions Name=DBInstanceIdentifier,Value=my-database \
--start-time $(date -u -v-1H +%Y-%m-%dT%H:%M:%S) \
--end-time $(date -u +%Y-%m-%dT%H:%M:%S) \
--period 300 --statistics Average -
Enhanced Monitoring: Check the
RDSOSMetricslog group in CloudWatch Logs. -
Performance Insights: Open the RDS console → select your instance → Performance Insights tab → verify the DB Load chart shows data.
-
Database Insights: Open CloudWatch console → Insights → Database Insights → confirm your instance appears in the fleet view.
Troubleshoot
| Symptom | Likely Cause | Fix |
|---|---|---|
| No Enhanced Monitoring data | IAM role not attached or wrong trust policy | Verify the monitoring role trusts monitoring.rds.amazonaws.com and has AmazonRDSEnhancedMonitoringRole policy |
| Performance Insights shows "Not enabled" | Feature not activated on instance | Run modify-db-instance with --enable-performance-insights |
| Logs not appearing in CloudWatch | Log export not configured or engine logs disabled | Enable log export via --cloudwatch-logs-export-configuration and set engine parameters (e.g., log_min_duration_statement for PostgreSQL) |
| DB Load metric missing | Standard mode only retains 7 days | Enable Advanced mode for 15-month retention; verify instance supports Performance Insights |
| Alarms stuck in INSUFFICIENT_DATA | Metric not yet published or wrong dimension | Verify DBInstanceIdentifier dimension matches exactly; wait 5 minutes after instance creation |
Related Solutions
- Amazon OpenSearch Service Monitoring — Monitor OpenSearch domains with Prometheus and CloudWatch
- Amazon MSK Monitoring — Monitor Kafka clusters that feed data pipelines connected to your databases