Best practices overview
Observability is a broad topic with a mature landscape of tools. Not every tool is right for every solution though! To help you navigate through your observability requirements, configuration, and final deployment, we have summarized five key best practices that will inform your decision making process on your Observability strategy.
Monitor what matters
The most important consideration with observability is not your servers, network, applications, or customers. It is what matters to you, your business, your project, or your users.
Start first with what your success criteria are. For example, if you run an e-commerce application, your measures of success may be number of purchases made over the past hour. If you run a non-profit, then it may be donations vs. your target for the month. A payment processor may watch for transaction processing time, whereas universities would want to measure student attendance.
Success metrics are different for everyone! We may use an e-commerce application as an example here, but your projects can have a very different measurement. Regardless, the advice remains the same: know what good looks like and measure for it.
Regardless of your application, you must start with identifying your key metrics. Then work backwards1 from that to see what impacts it from an application or infrastructure perspective. For example, if high CPU on your web servers endangers customer satisfaction, and in-turn your sales, then monitoring CPU utilization is important!
Know your objectives, and measure them!
Having identified your important top-level KPIs, your next job is to have an automated way to track and measure them. A critical success factor is doing so in the same system that watches your workload's operations. For our e-commerce workload example this may mean:
- Publishing sales data into a time series
- Tracking user registrations in this same system
- Measure how long customers stay on web pages, and (again) push this data to a time series
Most customers have this data already, though not necessarily in the right places from an observability perspective. Sales data can typically be found in relational databases or business intelligence reporting systems, along with user registrations. And data from visit duration can be extracted from logs or from Real User Monitoring.
Regardless of your metric data's original location or format, it must be maintained as a time series. Every key metric that matters most to you, whether it is business, personal, academic, or for any other purpose, must be in a time series format for you to correlate it with other observability data (sometimes known as signals or telemetry).
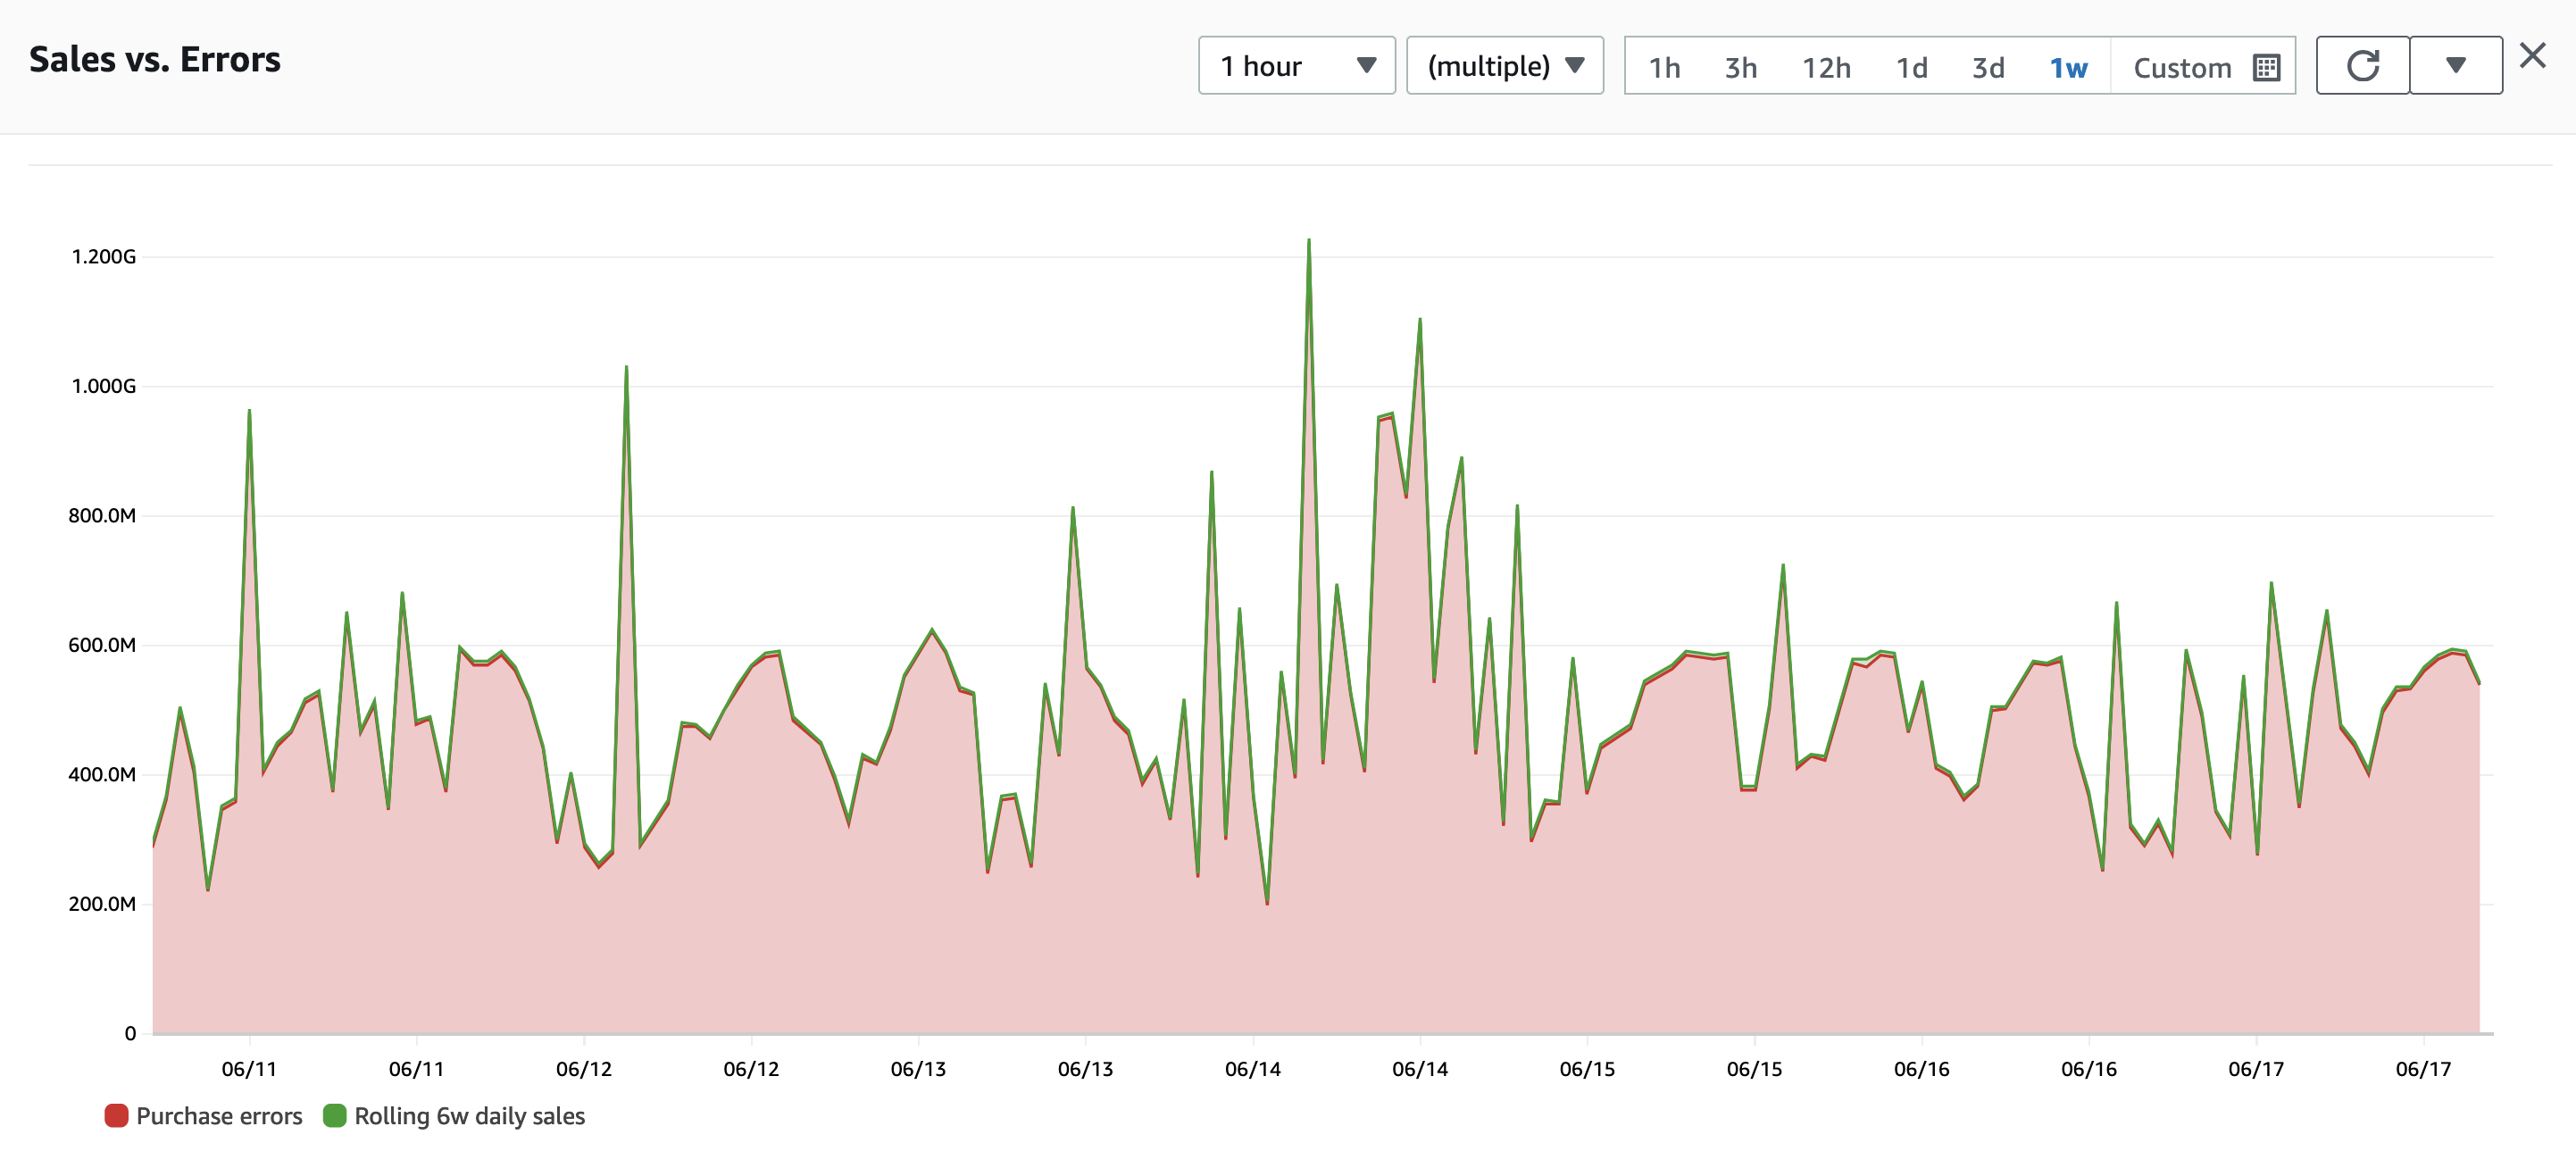 Figure 1: example of a time series
Context propagation and tool selection
Tool selection is important and has a profound difference in how you operate and remediate problems. But worse than choosing a sub-optimal tool is tooling for all basic signal types. For example, collecting basic logs from a workload, but missing transaction traces, leaves you with a gap. The result is an incohesive view of your entire application experiece. All modern approaches to observability depend on "connecting the dots" with application traces.
A complete picture of your health and operations requires tools that collect logs, metrics, and traces, and then performs correlation, analysis, anomaly detection, dashboarding, alarms and more.
Some observability solutions may not contain all of the above but are intended to augment, extend, or give added value to existing systems. In all cases, tool interoperability and extensibility is an important consideration when beginning an observability project.
Every workload is different, but common tools make for a faster results
Using a common set of tools across every workload has add benefits such as reducing operational friction and training, and generally you should strive for a reduced number of tools or vendors. Doing so lets you rapidly deploy existing observability solutions to new environments or workloads, and with faster time-to-resolution when things go wrong.
Your tools should be broad enough to observe every tier of your workload: basic infrastructure, applications, web sites, and everything in between. In places where a single tool is not possible, the best practice is to use those that have an open standard, are open source, and therefore have the broadest cross-platform integration possibilities.
Integrate with existing tools and processes
Don't reinvent the wheel! "Round" is a great shape already, and we should always be building collaborative and open systems, not data silos.
- Integrate with existing identity providers (e.g. Active Directory, SAML based IdPs).
- If you have existing IT trouble tracking system (e.g. JIRA, ServiceNow) then integrate with it to quickly manage problems as they arise.
- Use existing workload management and escalation tools (e.g. PagerDuty, OpsGenie) if you already have them!
- Infrastructure as code tools such as Ansible, SaltStack, CloudFormation, TerraForm, and CDK are all great tools. Use them to manage your observability as well as everything else, and build your observability solution with the same infrastructure as code tools you already use today (see include observability from day one).
Use automation and machine learning
Computers are good at finding patterns, and at finding when data does not follow a pattern! If you have hundreds, thousands, or even millions of datapoints to monitor, then it would impossible to understand healthy thresholds for every single one of them. But many observability solutions have anomaly detection and machine learning capabilities that manage the undifferentiated heavy lifting of baselining your data.
We refer to this as "knowing what good looks like". If you have load-tested your workload thoroughly then you may know these healthy performance metrics already, but for a complex distributed application it can be unwieldy to create baselines for every metric. This is where anomaly detection, automation, and machine learning are invaluable.
Leverage tools that manage the baselining and alerting of applications health on your behalf, thereby letting you focus on your goals, and monitor what matters.
Collect telemetry from all tiers of your workload
Your applications do not exist in isolation, and interactions with your network infrastructure, cloud providers, internet service providers, SasS partners, and other components both within and outside your control can all impact your outcomes. It is important that you have a holistic view of your entire workload.
Focus on integrations
If you have to pick one area to instrument, it will undoubtedly be your integrations between components. This is where the power of observability is most evident. As a rule, every time one component or service calls another, that call must have at least these data points measured:
- The duration of the request and response
- The status of the response
And to create the cohesive, holistic view that observability requires, a single unique identier for the entire request chain must be included in the signals collected.
Don't forget about the end-user experience
Having a complete view of your workload means understanding it at all tiers, including how your end users experience it. Measuring, quantifying, and understanding when your objectives are at risk from a poor user experience is just as important as watching for free disk space or CPU utilization - if not more important!
If your workloads are ones that interact directly with the end user (such as any application served as a web site or mobile app) then Real User Monitoring monitors not just the "last mile" of delivery to the user, but how they actually have experienced your application. Ultimately, none of the observability journey matters if your users are unable to actually use your services.
Data is power, but don't sweat the small stuff
Depending on the size of your application, you may have a very large number of components to collect signals from. While doing so is important and empowering, there can be diminished returns from your efforts. This is why the best practice is to start by monitoring what matters, use this as a way to map your important integrations and critical components, and focus on the right details.
Include observability from day one
Like security, observability should not be an afterthought to your development or operations. The best practice is to put observability early in your planning, just like security, which creates a model for people to work with and reduces opaque corners of your application. Adding transaction tracing after major development work is done takes time, even with auto-instrumentation. The effort returns far greater returns! But doing so late in your development cycle may create some rework.
Rather than bolting observability in your workload later one, use it to help accelerate your work. Proper logging, metric, and trace collection enables faster application development, fosters good practices, and lays the foundation for rapid problem solving going forward.
Footnotes
-
Amazon uses the working backwards process extensively as a way to obsession over our customers and their outcomes, and we highly recommend that anyone working on observability solutions work backwards from their own objectives in the same way. You can read more about working backwards on Werner Vogels's blog. ↩