Amazon CloudWatch Container Insights
In this section of Observability best practices guide, we will deep dive on to following topics related to Amazon CloudWatch Container Insights :
- Introduction to Amazon CloudWatch Container Insights
- Using Amazon CloudWatch Container Insights with AWS Distro for Open Telemetry
- Fluent Bit Integration in CloudWatch Container Insights for Amazon EKS
- Cost savings with Container Insights on Amazon EKS
- Using EKS Blueprints to setup Container Insights
Introduction
Amazon CloudWatch Container Insights helps customers collect, aggregate, and summarize metrics and logs from containerized applications and microservices. Metrics data is collected as performance log events using the embedded metric format. These performance log events use a structured JSON schema that enables high-cardinality data to be ingested and stored at scale. From this data, CloudWatch creates aggregated metrics at the cluster, node, pod, task, and service level as CloudWatch metrics. The metrics that Container Insights collects are available in CloudWatch automatic dashboards. Container Insights are available for Amazon EKS clusters with self managed node groups, managed node groups and AWS Fargate profiles.
From a cost optimization standpoint and to help you manage your Container Insights cost, CloudWatch does not automatically create all possible metrics from the log data. However, you can view additional metrics and additional levels of granularity by using CloudWatch Logs Insights to analyze the raw performance log events. Metrics collected by Container Insights are charged as custom metrics. For more information about CloudWatch pricing, see Amazon CloudWatch Pricing.
In Amazon EKS, Container Insights uses a containerized version of the CloudWatch agent which is provided by Amazon via Amazon Elastic Container Registry to discover all of the running containers in a cluster. It then collects performance data at every tier of the performance stack. Container Insights supports encryption with the AWS KMS key for the logs and metrics that it collects. To enable this encryption, you must manually enable AWS KMS encryption for the log group that receives Container Insights data. This results in CloudWatch Container Insights encrypting this data using the provided AWS KMS key. Only symmetric keys are supported and asymmetric AWS KMS keys are not supported to encrypt your log groups. Container Insights are supported only in Linux instances. Container Insights for Amazon EKS is supported in the these AWS Regions.
Using Amazon CloudWatch Container Insights with AWS Distro for Open Telemetry
We will now deep dive in to AWS Distro for OpenTelemetry (ADOT) which is one of the options to enable collection of Container insight metrics from Amazon EKS workloads. AWS Distro for OpenTelemetry (ADOT) is a secure, AWS-supported distribution of the OpenTelemetry project. With ADOT, users can instrument their applications just once to send correlated metrics and traces to multiple monitoring solutions. With ADOT support for CloudWatch Container Insights, customers can collect system metrics such as CPU, memory, disk, and network usage from Amazon EKS clusters running on Amazon Elastic Cloud Compute (Amazon EC2), providing the same experience as Amazon CloudWatch agent. ADOT Collector is now available with support for CloudWatch Container Insights for Amazon EKS and AWS Fargate profile for Amazon EKS. Customers can now collect container and pod metrics such as CPU and memory utilization for their pods that are deployed to an Amazon EKS cluster and view them in CloudWatch dashboards without any changes to their existing CloudWatch Container Insights experience. This will enable customers to also determine whether to scale up or down to respond to traffic and save costs.
The ADOT Collector has the concept of a pipeline which comprises three key types of components, namely, receiver, processor, and exporter. A receiver is how data gets into the collector. It accepts data in a specified format, translates it into the internal format and passes it to processors and exporters defined in the pipeline. It can be pull or push based. A processor is an optional component that is used to perform tasks such as batching, filtering, and transformations on data between being received and being exported. An exporter is used to determine which destination to send the metrics, logs or traces. The collector architecture allows multiple instances of such pipelines to be defined via YAML configuration. The following diagrams illustrates the pipeline components in an ADOT Collector instance deployed to Amazon EKS and Amazon EKS with Fargate profile.
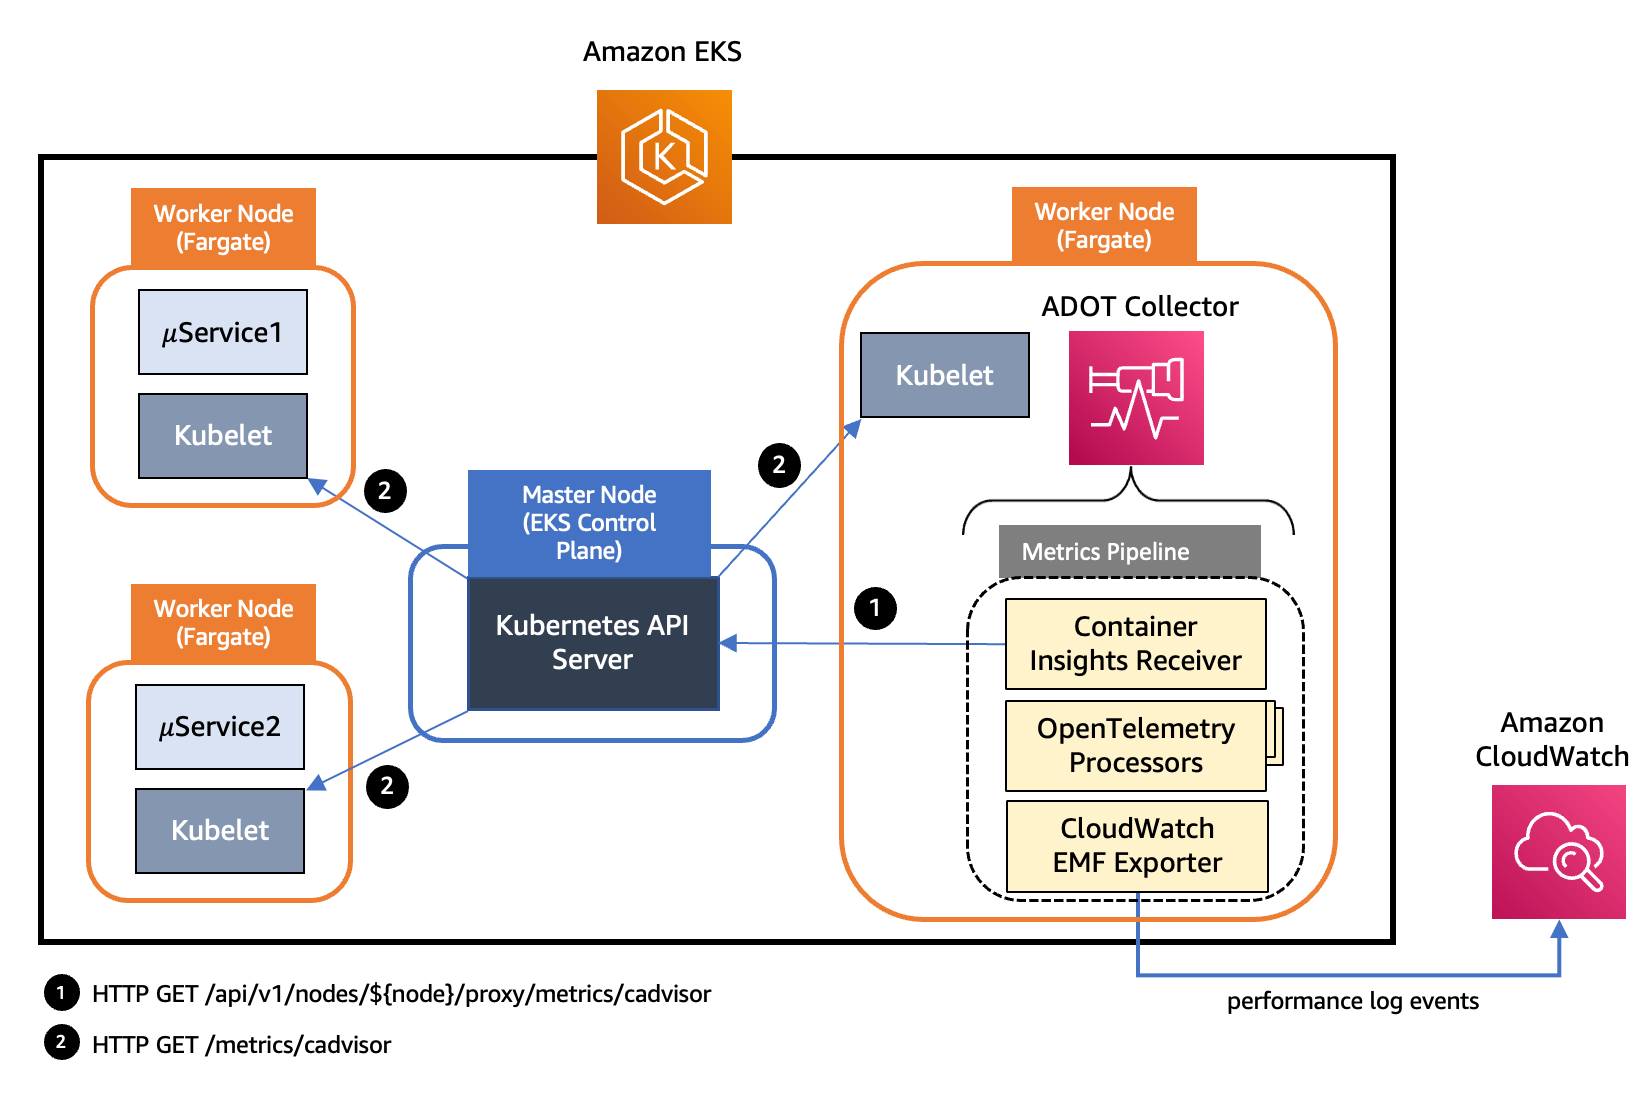
Figure: Pipeline components in an ADOT Collector instance deployed to Amazon EKS
In the above architecture, we are deploying we are using an instance of AWS Container Insights Receiver in the pipeline and collect the metrics directly from the Kubelet. AWS Container Insights Receiver (awscontainerinsightreceiver) is an AWS specific receiver that supports CloudWatch Container Insights. CloudWatch Container Insights collect, aggregate, and summarize metrics and logs from your containerized applications and microservices. Data are collected as as performance log events using embedded metric format. From the EMF data, Amazon CloudWatch can create the aggregated CloudWatch metrics at the cluster, node, pod, task, and service level. Below is an example of a sample awscontainerinsightreceiver configuration :
receivers:
  awscontainerinsightreceiver:
    # all parameters are optional
    collection_interval: 60s
    container_orchestrator: eks
    add_service_as_attribute: true
    prefer_full_pod_name: false
    add_full_pod_name_metric_label: false
This entails deploying the collector as a DaemonSet using the above configuration on Amazon EKS. You will also have access to a fuller set of metrics collected by this receiver directly from the Kubelet. Having more than one instances of ADOT Collector will suffice to collect resource metrics from all the nodes in a cluster. Having a single instance of ADOT collector can be overwhelming during higher loads so always recommend to deploy more than one collector.
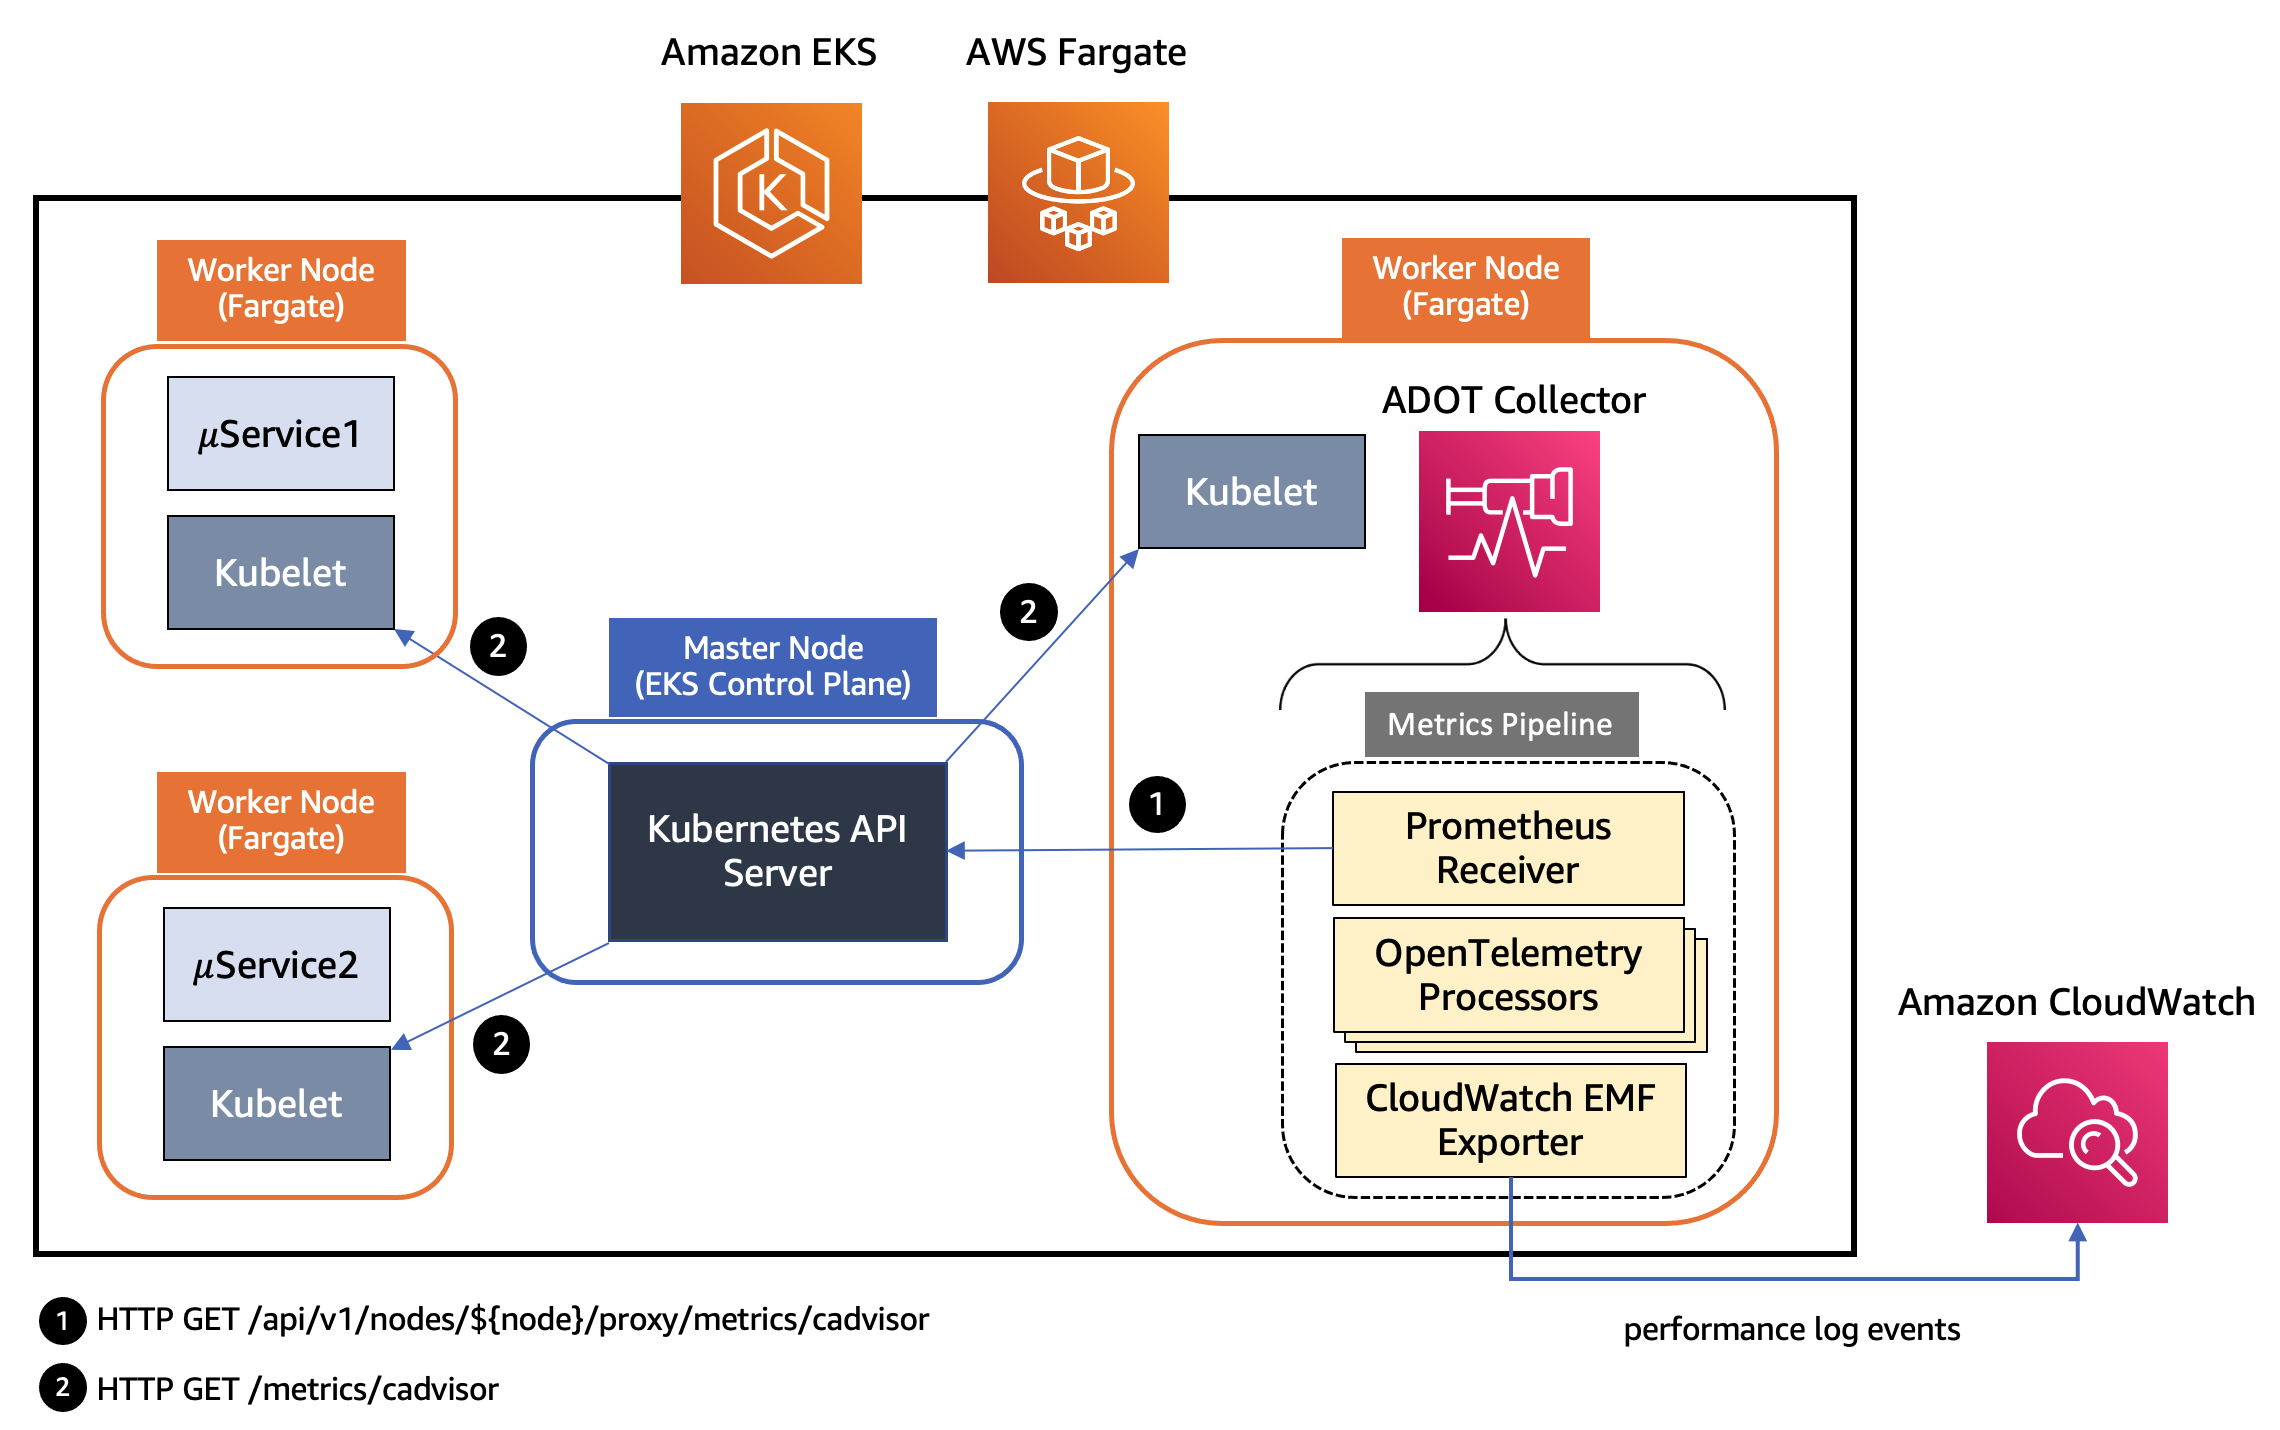
Figure: Pipeline components in an ADOT Collector instance deployed to Amazon EKS with Fargate profile
In the above architecture, the kubelet on a worker node in a Kubernetes cluster exposes resource metrics such as CPU, memory, disk, and network usage at the /metrics/cadvisor endpoint. However, in EKS Fargate networking architecture, a pod is not allowed to directly reach the kubelet on that worker node. Hence, the ADOT Collector calls the Kubernetes API Server to proxy the connection to the kubelet on a worker node, and collect kubelet’s cAdvisor metrics for workloads on that node. These metrics are made available in Prometheus format. Therefore, the collector uses an instance of Prometheus Receiver as a drop-in replacement for a Prometheus server and scrapes these metrics from the Kubernetes API server endpoint. Using Kubernetes service discovery, the receiver can discover all the worker nodes in an EKS cluster. Hence, more than one instances of ADOT Collector will suffice to collect resource metrics from all the nodes in a cluster. Having a single instance of ADOT collector can be overwhelming during higher loads so always recommend to deploy more than one collector.
The metrics then go through a series of processors that perform filtering, renaming, data aggregation and conversion, and so on. The following is the list of processors used in the pipeline of an ADOT Collector instance for Amazon EKS illustrated above.
- Filter Processor is part of the AWS OpenTelemetry distribution to include or exclude metrics based on their name. It can be used as part of the metrics collection pipeline to filter out unwanted metrics. For example, suppose that you want Container Insights to only collect pod-level metrics (with name prefix
pod_) excluding those for networking, with name prefixpod_network.
      # filter out only renamed metrics which we care about
      filter:
        metrics:
          include:
            match_type: regexp
            metric_names:
              - new_container_.*
              - pod_.*
- Metrics Transform Processor can be used to rename metrics, and add, rename or delete label keys and values. It can also be used to perform scaling and aggregations on metrics across labels or label values.
     metricstransform/rename:
        transforms:
          - include: container_spec_cpu_quota
            new_name: new_container_cpu_limit_raw
            action: insert
            match_type: regexp
            experimental_match_labels: {"container": "\\S"}
- Cumulative to Delta Processor converts monotonic, cumulative sum and histogram metrics to monotonic, delta metrics. Non-monotonic sums and exponential histograms are excluded.
` # convert cumulative sum datapoints to delta
 cumulativetodelta:
    metrics:
        - pod_cpu_usage_seconds_total
        - pod_network_rx_errors`
- Delta to Rate Processor to convert delta sum metrics to rate metrics. This rate is a gauge.
` # convert delta to rate
    deltatorate:
        metrics:
            - pod_memory_hierarchical_pgfault
            - pod_memory_hierarchical_pgmajfault
            - pod_network_rx_bytes
            - pod_network_rx_dropped
            - pod_network_rx_errors
            - pod_network_tx_errors
            - pod_network_tx_packets
            - new_container_memory_pgfault
            - new_container_memory_pgmajfault
            - new_container_memory_hierarchical_pgfault
            - new_container_memory_hierarchical_pgmajfault`
- Metrics Generation Processor can be used to create new metrics using existing metrics following a given rule.
      experimental_metricsgeneration/1:
        rules:
          - name: pod_memory_utilization_over_pod_limit
            unit: Percent
            type: calculate
            metric1: pod_memory_working_set
            metric2: pod_memory_limit
            operation: percent
The final component in the pipeline is AWS CloudWatch EMF Exporter, which converts the metrics to embedded metric format (EMF) and then sends them directly to CloudWatch Logs using the PutLogEvents API. The following list of metrics is sent to CloudWatch by the ADOT Collector for each of the workloads running on Amazon EKS.
- pod_cpu_utilization_over_pod_limit
- pod_cpu_usage_total
- pod_cpu_limit
- pod_memory_utilization_over_pod_limit
- pod_memory_working_set
- pod_memory_limit
- pod_network_rx_bytes
- pod_network_tx_bytes
Each metric will be associated with the following dimension sets and collected under the CloudWatch namespace named ContainerInsights.
- ClusterName, LaunchType
- ClusterName, Namespace, LaunchType
- ClusterName, Namespace, PodName, LaunchType
Further, Please learn about Container Insights Prometheus support for ADOT and deploying ADOT collector on Amazon EKS to visualize Amazon EKS resource metrics using CloudWatch Container Insights to setup ADOT collector pipeline in your Amazon EKS cluster and how to visualize your Amazon EKS resource metrics in CloudWatch Container Insights. Additionally, please reference Easily Monitor Containerized Applications with Amazon CloudWatch Container Insights, which includes step-by-step instructions on configuring an Amazon EKS cluster, deploying a containerized application, and monitoring the application's performance using Container Insights.
Fluent Bit Integration in CloudWatch Container Insights for Amazon EKS
Fluent Bit is an open source and multi-platform log processor and forwarder that allows you to collect data and logs from different sources, and unify and send them to different destinations including CloudWatch Logs. It’s also fully compatible with Docker and Kubernetes environments. Using the newly launched Fluent Bit daemonset, you can send container logs from your EKS clusters to CloudWatch logs for logs storage and analytics.
Due to its lightweight nature, using Fluent Bit as the default log forwarder in Container Insights on EKS worker nodes will allow you to stream application logs into CloudWatch logs efficiently and reliably. With Fluent Bit, Container Insights is able to deliver thousands of business critical logs at scale in a resource efficient manner, especially in terms of CPU and memory utilization at the pod level. In other words, compared to FluentD, which was the log forwarder used prior, Fluent Bit has a smaller resource footprint and, as a result, is more resource efficient for memory and CPU. On the other hand, AWS for Fluent Bit image, which includes Fluent Bit and related plugins, gives Fluent Bit an additional flexibility of adopting new AWS features faster as the image aims to provide a unified experience within AWS ecosystem.
The architecture below shows individual components used by CloudWatch Container Insights for EKS:
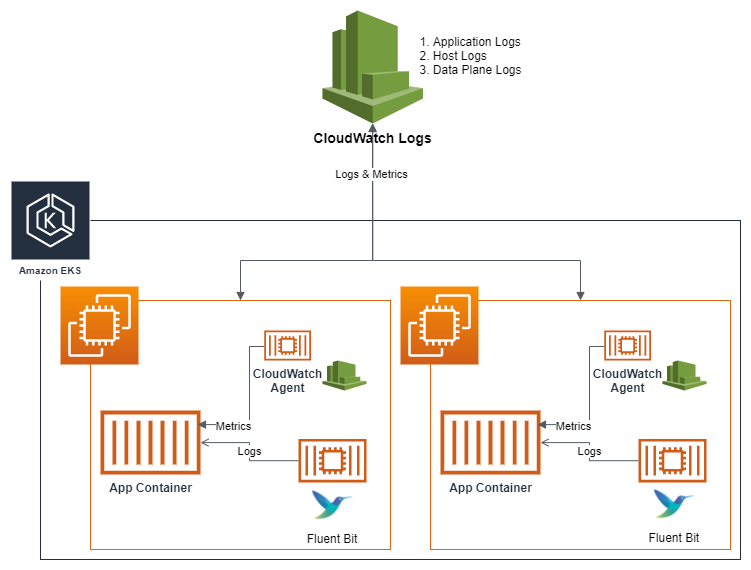
Figure: Individual components used by CloudWatch Container Insights for EKS.
While working with containers, it is recommended to push all the logs, including application logs, through the standard output (stdout) and standard error output (stderr) methods whenever possible using the Docker JSON logging driver. For this reason, in EKS, the logging driver is configured by default and everything that a containerized application writes to stdout or stderr is streamed into a JSON file under “/var/log/containers" on the worker node. Container Insights classifies those logs into three different categories by default and creates dedicated input streams for each category within Fluent Bit and independent log groups within CloudWatch Logs. Those categories are:
- Application logs: All applications logs stored under
“/var/log/containers/*.log"are streamed into the dedicated/aws/containerinsights/Cluster_Name/applicationlog group. All non-application logs such as kube-proxy and aws-node logs are excluded by default. However, additional Kubernetes add-on logs, such as CoreDNS logs, are also processed and streamed into this log group. - Host logs: system logs for each EKS worker node are streamed into the
/aws/containerinsights/Cluster_Name/hostlog group. These system logs include the contents of“/var/log/messages,/var/log/dmesg,/var/log/secure”files. Considering the stateless and dynamic nature of containerized workloads, where EKS worker nodes are often being terminated during scaling activities, streaming those logs in real time with Fluent Bit and having those logs available in CloudWatch logs, even after the node is terminated, are critical in terms of observability and monitoring health of EKS worker nodes. It also enables you to debug or troubleshoot cluster issues without logging into worker nodes in many cases and analyze these logs in more systematic way. - Data plane logs: EKS already provides control plane logs. With Fluent Bit integration in Container Insights, the logs generated by EKS data plane components, which run on every worker node and are responsible for maintaining running pods are captured as data plane logs. These logs are also streamed into a dedicated CloudWatch log group under
‘ /aws/containerinsights/Cluster_Name/dataplane. kube-proxy, aws-node, and Docker runtime logs are saved into this log group. In addition to control plane logs, having data plane logs stored in CloudWatch Logs helps to provide a complete picture of your EKS clusters.
Further, Please learn more on topics such as Fluent Bit Configurations, Fluent Bit Monitoring and Log analysis from Fluent Bit Integration with Amazon EKS.
Cost savings with Container Insights on Amazon EKS
With the default configuration, the Container Insights receiver collects the complete set of metrics as defined by the receiver documentation. The number of metrics and dimensions collected is high, and for large clusters this will significantly increase the costs for metric ingestion and storage. We are going to demonstrate two different approaches that you can use to configure the ADOT Collector to send only metrics that bring value and saves cost.
Using processors
This approach involves the introduction of OpenTelemetry processors as discussed above to filter out metrics or attributes to reduce the size of EMF logs. We will demonstrate the basic usage of two processors namely Filter and Resource.
Filter processors can be included in the ConfigMap named otel-agent-conf:
processors:
  # filter processors example
  filter/include:
    # any names NOT matching filters are excluded from remainder of pipeline
    metrics:
      include:
        match_type: regexp
        metric_names:
          # re2 regexp patterns
          - ^pod_.*
  filter/exclude:
    # any names matching filters are excluded from remainder of pipeline
    metrics:
      exclude:
        match_type: regexp
        metric_names:
          - ^pod_network.*
Resource processor is also built into the AWS OpenTelemetry Distro and can be used to remove unwanted metric attributes. For example, if you want to remove the Kubernetes and Sources fields from the EMF logs, you can add the resource processor to the pipeline:
  # resource processors example
  resource:
    attributes:
    - key: Sources
      action: delete
    - key: kubernetes
      action: delete
Customize Metrics and Dimensions
In this approach, you will configure the CloudWatch EMF exporter to generate only the set of metrics that you want to send to CloudWatch Logs. The metric_declaration section of CloudWatch EMF exporter configuration can be used to define the set of metrics and dimensions that you want to export. For example, you can keep only pod metrics from the default configuration. This metric_declaration section will look like the following and to reduce the number of metrics, you can keep the dimension set only [PodName, Namespace, ClusterName] if you do not care about others:
  awsemf:
    namespace: ContainerInsights
    log_group_name: '/aws/containerinsights/{ClusterName}/performance'
    log_stream_name: '{NodeName}'
    resource_to_telemetry_conversion:
      enabled: true
    dimension_rollup_option: NoDimensionRollup
    parse_json_encoded_attr_values: [Sources, kubernetes]
    # Customized metric declaration section
    metric_declarations:
      # pod metrics
      - dimensions: [[PodName, Namespace, ClusterName]]
        metric_name_selectors:
          - pod_cpu_utilization
          - pod_memory_utilization
          - pod_cpu_utilization_over_pod_limit
          - pod_memory_utilization_over_pod_limit
This configuration will produce and stream the following four metrics within single dimension [PodName, Namespace, ClusterName] rather than 55 different metrics for multiple dimensions in the default configuration:
- pod_cpu_utilization
- pod_memory_utilization
- pod_cpu_utilization_over_pod_limit
- pod_memory_utilization_over_pod_limit
With this configuration, you will only send the metrics that you are interested in rather than all the metrics configured by default. As a result, you will be able to decrease metric ingestion cost for Container Insights considerably. Having this flexibility will provide Container Insights costumers with high level of control over metrics being exported. Customizing metrics by modifying the awsemf exporter configuration is also highly flexible, and you can customize both the metrics that you want to send and their dimensions. Note that this is only applicable to logs that are sent to CloudWatch.
The two approaches demonstrated discussed above are not mutually exclusive with each other. In fact, they both can be combined for a high degree of flexibility in customizing metrics that we want ingested into our monitoring system. We use this approach to decrease costs associated with metric storage and processing, as show in following graph.
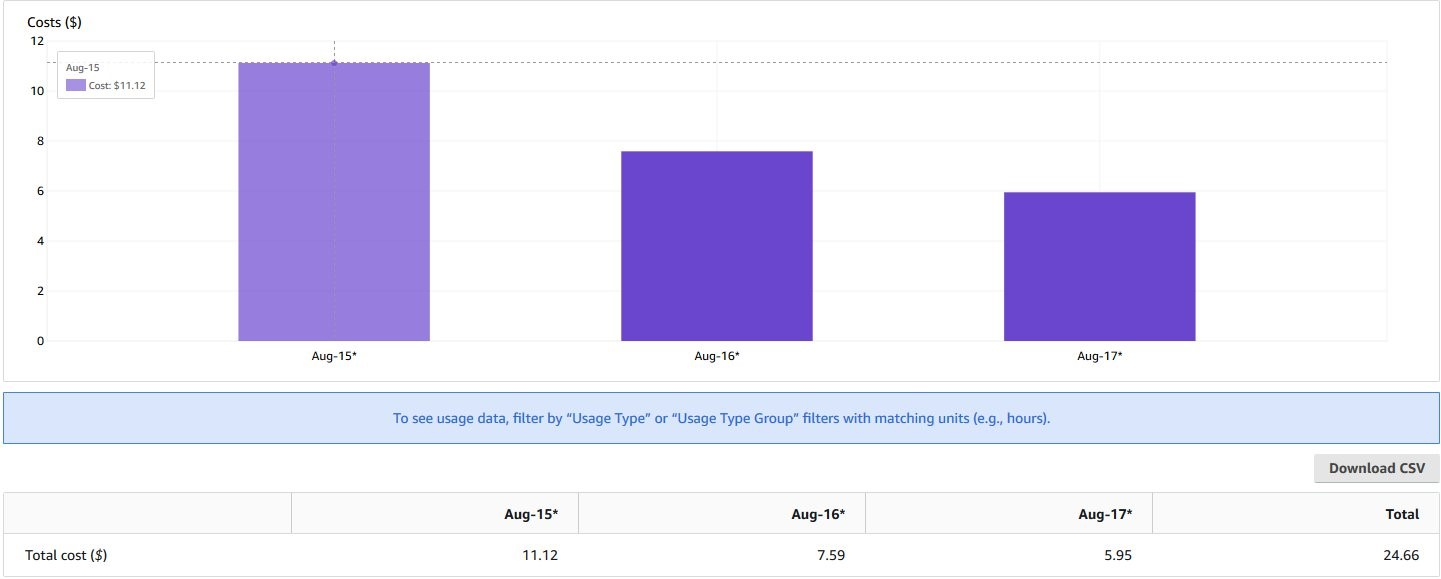
Figure: AWS Cost Explorer
In the preceding AWS Cost Explorer graph, we can see daily cost associated with CloudWatch using different configurations on the ADOT Collector in a small EKS cluster (20 Worker nodes, 220 pods). Aug 15th shows CloudWatch bill using ADOT Collector with the default configuration. On Aug 16th, we have used the Customize EMF exporter approach and can see about 30% cost savings. On Aug 17th, we used the Processors approach, which achieves about 45% costs saving. You must consider the trade-offs of customizing metrics sent by Container Insights as you will be able to decrease monitoring costs by sacrificing visibility of the monitored cluster. But also, the built-in dashboard provided by Container Insights within the AWS Console can be impacted by customized metrics as you can select not sending metrics and dimensions used by the dashboard. For further learning please check on Cost savings by customizing metrics sent by Container Insights in Amazon EKS.
Using EKS Blueprints to setup Container Insights
EKS Blueprints is a collection of Infrastructure as Code (IaC) modules that will help you configure and deploy consistent, batteries-included EKS clusters across accounts and regions. You can use EKS Blueprints to easily bootstrap an EKS cluster with Amazon EKS add-ons as well as a wide range of popular open-source add-ons, including Prometheus, Karpenter, Nginx, Traefik, AWS Load Balancer Controller, Container Insights, Fluent Bit, Keda, Argo CD, and more. EKS Blueprints is implemented in two popular IaC frameworks, HashiCorp Terraform and AWS Cloud Development Kit (AWS CDK), which help you automate infrastructure deployments.
As part of your Amazon EKS Cluster creation process using EKS Blueprints, you can setup Container Container Insights as a Day 2 operational tooling to collect, aggregate, and summarize metrics and logs from containerized applications and micro-services to Amazon CloudWatch console.
Conclusion
In this section of Observability best practices guide, we covered lot of deeper details around CloudWatch Container insights which included a introduction to Amazon CloudWatch Container Insights and how it can help you to observe your containerized workloads on Amazon EKS. We covered deeper grounds on using Amazon CloudWatch Container Insights with AWS Distro for Open Telemetry to enable collection fo Container insight metrics to visualize the metrics our your containerzied workloads on Amazon CloudWatch console. Next, we covered lot of depth around Fluent Bit Integration in CloudWatch Container Insights for Amazon EKS to create dedicated input streams within Fluent Bit and independent log groups within CloudWatch Logs for Application, Host and Data Plane logs. Next, we talked about two different approaches such as processors, metrics dimensions to achieve cost savings with CloudWatch Container insights. Finally we talked in brief about how use EKS Blueprints as a vehicle to setup Container Insights during the Amazon EKS cluster creation process. You can get hands-on experience with the CloudWatch Container Insights module with in theOne Observability Workshop.