Amazon EKS API Server Monitoring
In this section of Observability best practices guide, we will deep dive on to following topics related to API Server Monitoring:
- Introduction to Amazon EKS API Server Monitoring
- Setting up an API Server Troubleshooter Dashboard
- Using API Troubleshooter Dashboard to Understand API Server Problems
- Understanding Unbounded list calls to API Server
- Stopping bad behavior to API Server
- API Priority and Fairness
- Identifying slowest API calls and API Server Latency Issues
Introduction
Monitoring your Amazon EKS managed control plane is a very important Day 2 operational activity to proactively identity issues with health of your EKS cluster. Amazon EKS Control plane monitoring helps you to take proactive measures based on the collected metrics. These metrics would helps us to troubleshoot the API servers and pin point the problem under the hood.
We will be using Amazon Managed Service for Prometheus (AMP) for our demonstration in this section for Amazon EKS API server monitoring and Amazon Managed Grafana (AMG) for visualization of metrics. Prometheus is a popular open source monitoring tool that provides powerful querying features and has wide support for a variety of workloads. Amazon Managed Service for Prometheus is a fully managed Prometheus-compatible service that makes it easier to monitor environments, such as Amazon EKS, Amazon Elastic Container Service (Amazon ECS), and Amazon Elastic Compute Cloud (Amazon EC2), securely and reliably. Amazon Managed Grafana is a fully managed and secure data visualization service for open source Grafana that enables customers to instantly query, correlate, and visualize operational metrics, logs, and traces for their applications from multiple data sources
We will first setup a starter dashboard using Amazon Managed Service for Prometheus and Amazon Managed Grafana to help you with troubleshooting Amazon Elastic Kubernetes Service (Amazon EKS) API Servers with Prometheus. We will diving deep in up coming sections around understanding problems while troubleshooting the EKS API Servers, API priority and fairness, stopping bad behaviours. Finally we will deep dive in indentifying API calls that are slowest and API server latency issues which helps us to take actions to keep state of our Amazon EKS cluster healthy.
Setting up an API Server Troubleshooter Dashboard
We will setup a starter dashboard to help you with troubleshooting Amazon Elastic Kubernetes Service (Amazon EKS) API Servers with AMP. We will use this to help you understand the metrics while troubleshooting your production EKS clusters. We will further focus deep on the collected metrics to understand its importance while troubleshooting your Amazon EKS clusters.
First, setup an ADOT collector to collect metrics from your Amazon EKS cluster to Amazon Manager Service for Prometheus. In this setup you will be using EKS ADOT Addon which allows users to enable ADOT as an add-on at any time after the EKS cluster is up and running. The ADOT add-on includes the latest security patches and bug fixes and is validated by AWS to work with Amazon EKS. This setup will show you how to install the ADOT add-on in an EKS cluster and then use it to collect metrics from your cluster.
Next, setup your Amazon Managed Grafana workspace to visualize metrics using AMP as a data source which you have setup in the first step. Finally download the API troubleshooter dashboard, navigate to Amazon Managed Grafana to upload the API troubleshooter dashboard json to visualize the metrics for further troubleshooting.
Using API Troubleshooter Dashboard to Understand Problems
Let’s say you found an interesting open-source project that you wanted to install in your cluster. That operator deploys a DaemonSet to your cluster that might be using malformed requests, a needlessly high volume of LIST calls, or maybe each of its DaemonSets across all your 1,000 nodes are requesting status of all 50,000 pods on your cluster every minute! Does this really happen often? Yes, it does! Let’s take a quick detour on how that happens.
Understanding LIST vs. WATCH
Some applications need to understand the state of the objects in your cluster. For example, your machine learning (ML) application wants to know the job status by understanding how many pods are not in the Completed status. In Kubernetes, there are well-behaved ways to do this with something called a WATCH, and some not-so-well-behaved ways that list every object on the cluster to find the latest status on those pods.
A well-behaved WATCH
Using a WATCH or a single, long-lived connection to receive updates via a push model is the most scalable way to do updates in Kubernetes. To oversimplify, we ask for the full state of the system, then only update the object in a cache when changes are received for that object, periodically running a re-sync to ensure that no updates were missed.
In the below image we use the apiserver_longrunning_gauge to get an idea of the number of these long-lived connections across both API servers.
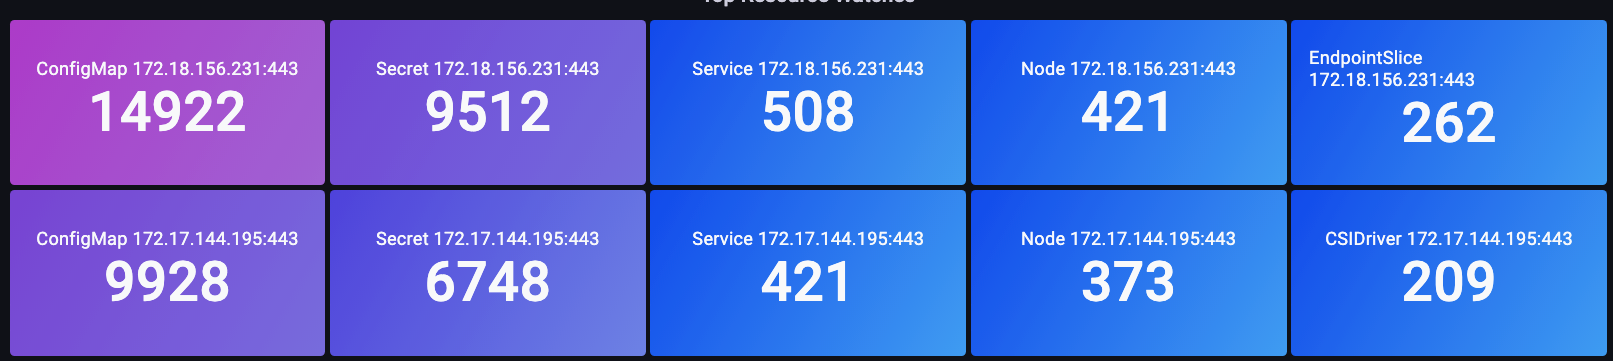
Figure: apiserver_longrunning_gauge metric
Even with this efficient system, we can still have too much of a good thing. For example, if we use many very small nodes, each using two or more DaemonSets that need to talk to the API server, it is quite easy to dramatically increase the number of WATCH calls on the system unnecessarily. For example, let’s look at the difference between eight xlarge nodes vs. a single 8xlarge. Here we see an 8x increase of WATCH calls on the system.
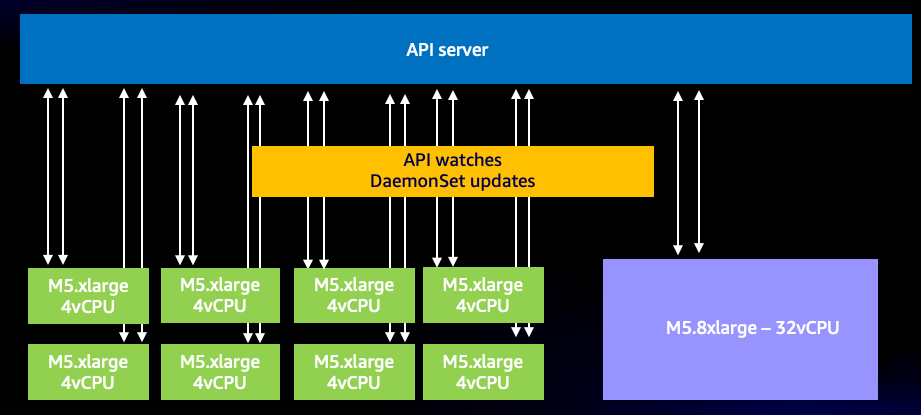
Figure: WATCH calls between 8 xlarge nodes.
Now these are efficient calls, but what if instead they were the ill-behaved calls we alluded to earlier? Imagine if one of the above DaemonSets on each of the 1,000 nodes is requesting updates on each of the total 50,000 pods in the cluster. We will explore this idea of an unbounded list call in next section.
A quick word of caution before continuing, the type of consolidation in the above example must be done with great care, and has many other factors to consider. Everything from the delay of the number of threads competing for a limited number of CPUs on the system, Pod churn rate, to the maximum number of volume attachments a node can handle safely. However, our focus will be on the metrics that lead us to actionable steps that can prevent issues from happening—and maybe give us new insight into our designs.
The WATCH metric is a simple one, but it can be used to track and reduce the number of watches, if that is a problem for you. Here are a few options you could consider to reduce this number:
- Limit the number of ConfigMaps Helm creates to track History
- Use Immutable ConfigMaps and Secrets which do not use a WATCH
- Sensible node sizing and consolidation
Understanding Unbounded list calls to API Server
Now for the LIST call we have been talking about. A list call is pulling the full history on our Kubernetes objects each time we need to understand an object’s state, nothing is being saved in a cache this time.
How impactful is all this? That will vary depending on how many agents are requesting data, how often they are doing so, and how much data they are requesting. Are they asking for everything on the cluster, or just a single namespace? Does that happen every minute, on very node? Let’s use an example of a logging agent that is appending Kubernetes metadata on every log sent from a node. This could be an overwhelming amount of data in larger clusters. There are many ways for the agent to get that data via a list call, so let’s look at a few.
The below request is asking for pods from a specific namespace.
/api/v1/namespaces/my-namespace/pods
Next, we request all 50,000 pods on the cluster, but in chunks of 500 pods at a time.
/api/v1/pods?limit=500
The next call is the most disruptive. Fetching all 50,000 pods on the entire cluster at the same time.
/api/v1/pods
This happens quite commonly in the field and can be seen in the logs.
Stopping bad behavior to API Server
How can we protect our cluster from such bad behavior? Before Kubernetes 1.20, the API server would protect itself by limiting the number of inflight requests processed per second. Since etcd can only handle so many requests at one time in a performant way, we need to ensure the number of requests is limited to a value per second that keeps etcd reads and writes in a reasonable latency band. Unfortunately, at the time of this writing, there is no dynamic way to do this.
In the below chart we see a breakdown of read requests, which has a default maximum of 400 inflight request per API server and a default max of 200 concurrent write requests. In a default EKS cluster you will see two API servers for a total of 800 reads and 400 writes. However, caution is advised as these servers can have asymmetric loads on them at different times like right after an upgrade, etc.
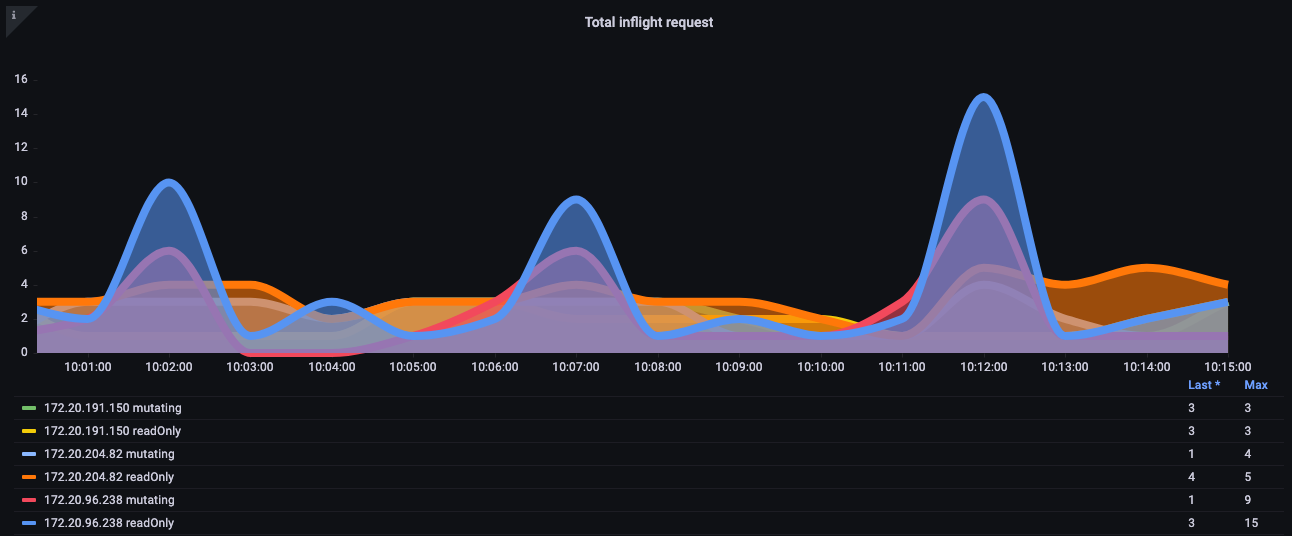
Figure: Grafana chart with breakdown of read requests.
It turns out that the above was not a perfect scheme. For example, how could we keep this badly behaving new operator we just installed from taking up all the inflight write requests on the API server and potentially delaying important requests such as node keepalive messages?
API Priority and Fairness
Instead of worrying about how many read/write requests were open per second, what if we treated the capacity as one total number, and each application on the cluster got a fair percentage or share of that total maximum number?
To do that that effectively, we would need to identify who sent the request to the API server, then give that request a name tag of sorts. With this new name tag, we could then see all these requests are coming from a new agent we will call “Chatty.” Now we can group all of Chatty’s requests into something called a flow, that identifies those requests are coming from the same DaemonSet. This concept now gives us the ability to restrict this bad agent and ensure it does not consume the whole cluster.
However, not all requests are created equal. The control plane traffic that is needed to keep the cluster operational should be a higher priority than our new operator. This is where the idea of priority levels comes into play. What if, by default, we had a several “buckets” or queues for critical, high, and low priority traffic? We do not want the chatty agent flow getting a fair share of traffic in the critical traffic queue. We can however put that traffic in a low priority queue so that flow is competing with perhaps other chatty agents. We then would want to ensure that each priority level had the right number of shares or percentage of the overall maximum the API server can handle to ensure the requests were not too delayed.
Priority and fairness in action
Since this is a relatively new feature, many existing dashboards will use the older model of maximum inflight reads and maximum inflight writes. Why this can be problematic?
What if we were giving high priority name tags to everything in the kube-system namespace, but we then installed that bad agent into that important namespace, or even simply deployed too many applications in that namespace? We could end up having the same problem we were trying to avoid! So best to keep a close eye on such situations.
I have broken out for you some of the metrics I find most interesting to track these kinds of issues.
- What percentage of a priority group’s shares are used?
- What is the longest time a request waited in a queue?
- Which flow is using the most shares?
- Are there unexpected delays on the system?
Percent in use
Here we see the different default priority groups on the cluster and what percentage of the max is used.
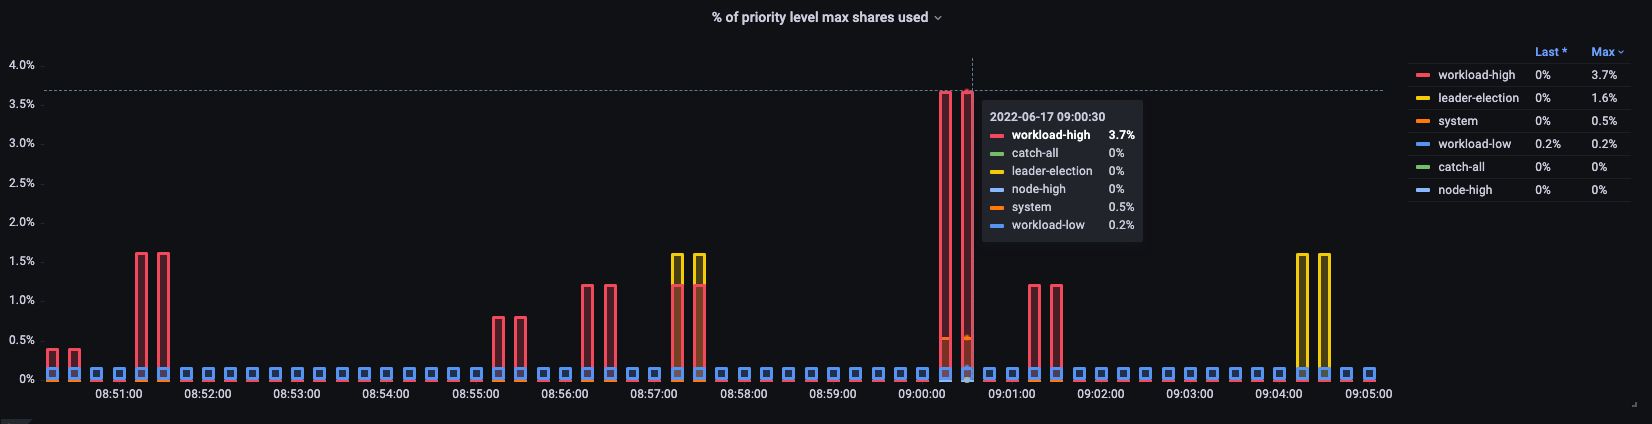
Figure: Priority groups on the cluster.
Time request was in queue
How long in seconds the request sat in the priority queue before being processed.
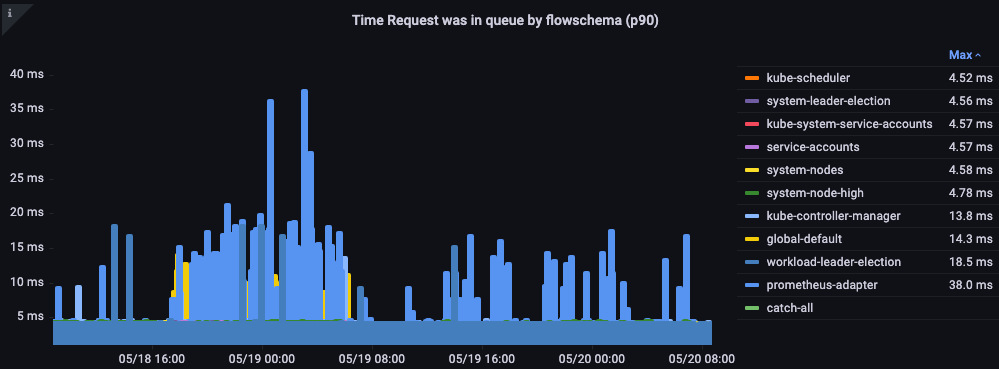
Figure: Time the request was in priority queue.
Top executed requests by flow
Which flow is taking up the most shares?
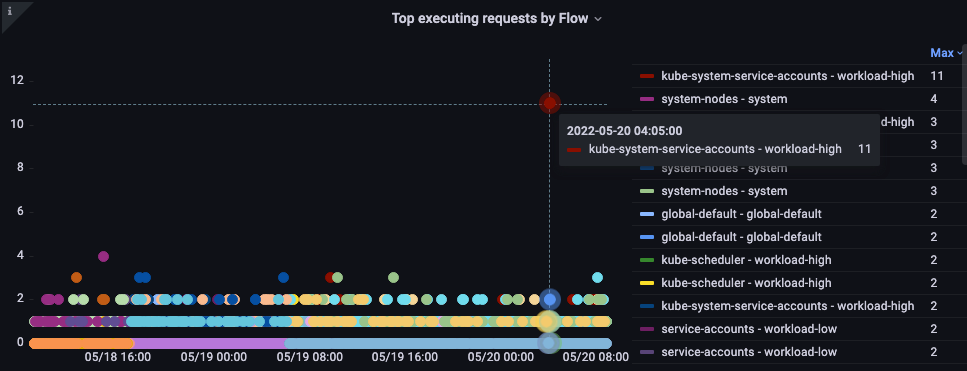
Figure: Top executing requests by flow.
Request Execution Time
Are there any unexpected delays in processing?
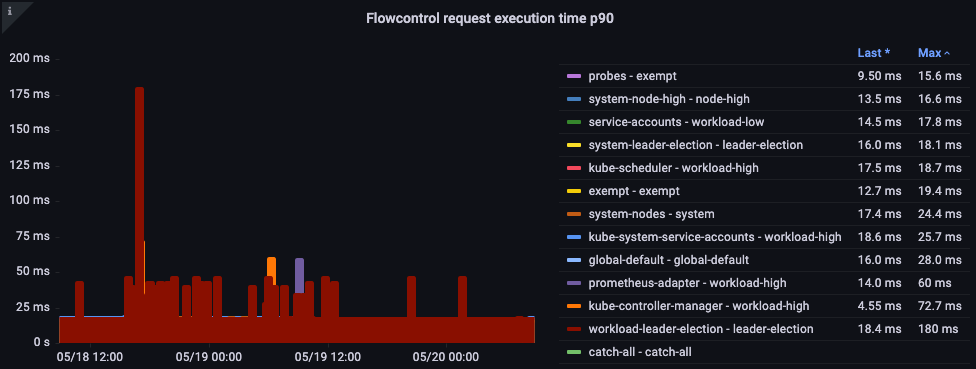
Figure: Flow control request execution time.
Identifying slowest API calls and API Server Latency Issues
Now that we understand the nature of the things that cause API latency, we can take a step back and look at the big picture. It’s important to remember that our dashboard designs are simply trying to get a quick snapshot if there is a problem we should be investigating. For detailed analysis, we would use ad-hoc queries with PromQL—or better yet, logging queries.
What are some ideas for the high-level metrics we would want to look at?
- What API call is taking the most time to complete?
- What is the call doing? (Listing objects, deleting them, etc.)
- What objects is it trying to do that operation on? (Pods, Secrets, ConfigMaps, etc.)
- Is there a latency problem on the API server itself?
- Is there a delay in one of my priority queues causing a backup in requests?
- Does it just look like API server is slow because the etcd server is experiencing latency?
Slowest API call
In the below chart we are looking for the API calls that took the most time to complete for that period. In this case we see a custom resource definition (CRD) is calling a LIST function that is the most latent call during the 05:40 time frame. Armed with this data we can use CloudWatch Insights to pull LIST requests from the audit log in that timeframe to see which application this might be.
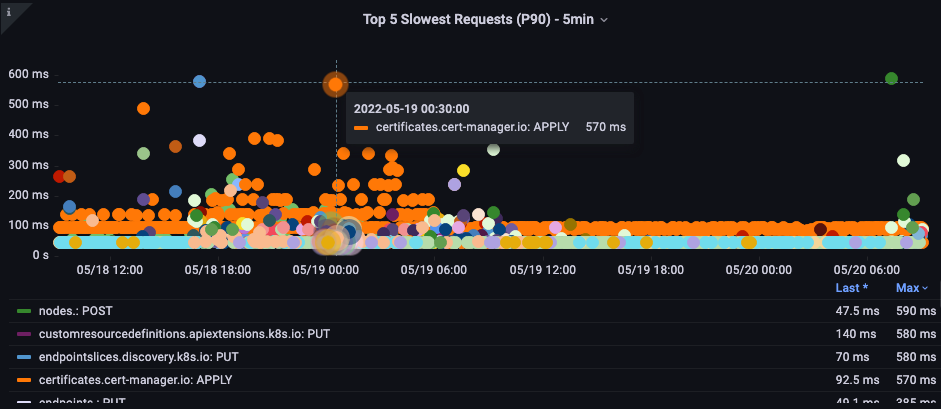
Figure: Top 5 slowest API calls.
API Request Duration
This API latency chart helps us to understand if any requests are approaching the timeout value of one minute. I like the histogram over time format below as I can see outliers in the data that a line graph would hide.
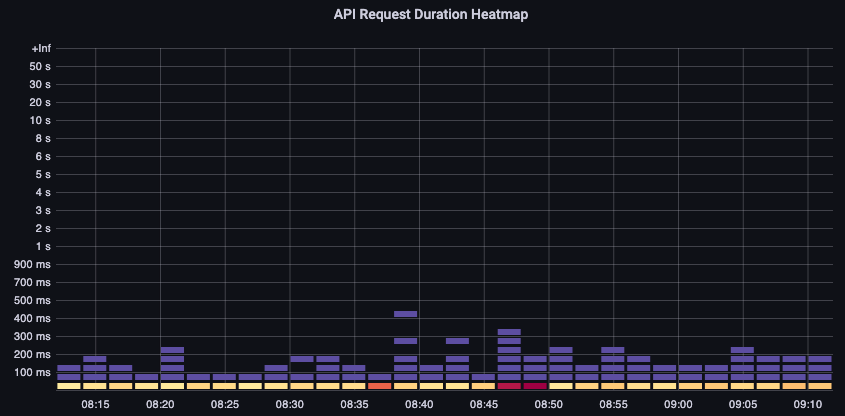
Figure: API Request duration heatmap.
Simply hovering over a bucket shows us the exact number of calls that took around 25 milliseconds. [Image: Image.jpg]Figure: Calls over 25 milliseconds.
This concept is important when we are working with other systems that cache requests. Cache requests will be fast; we do not want to merge those request latencies with slower requests. Here we can see two distinct bands of latency, requests that have been cached, and those that have not.
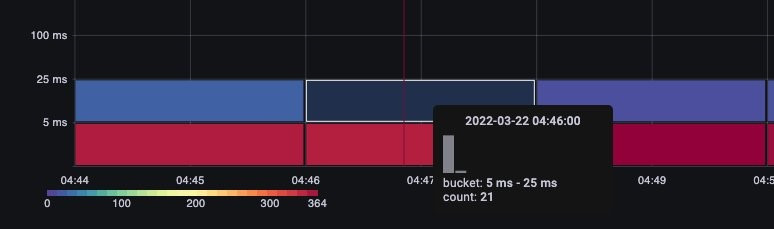
Figure: Latency, requests cached.
ETCD Request Duration
ETCD latency is one of the most important factors in Kubernetes performance. Amazon EKS allows you see this performance from the API server’s perspective by looking at the request_duration_seconds_bucket metric.
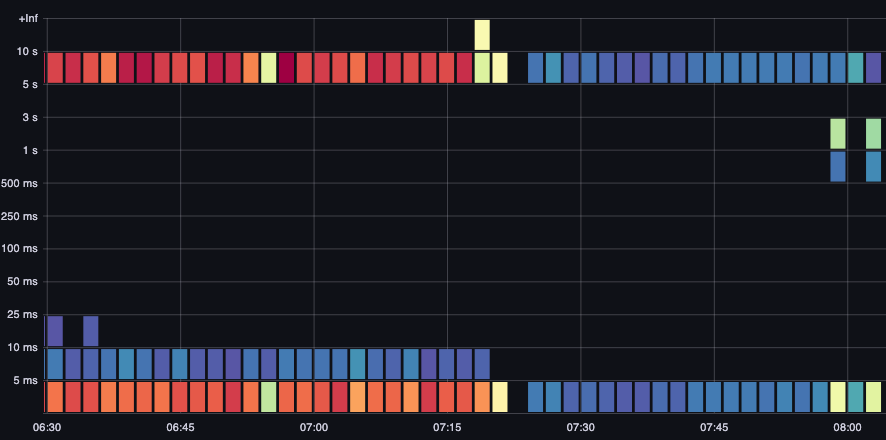
Figure : request_duration_seconds_bucket metric.
We can now start to put the things we learned together by seeing if certain events are correlated. In the below chart we see API server latency, but we also see much of this latency is coming from the etcd server. Being able to quickly move to the right problem area with just a glance is what makes a dashboard powerful.
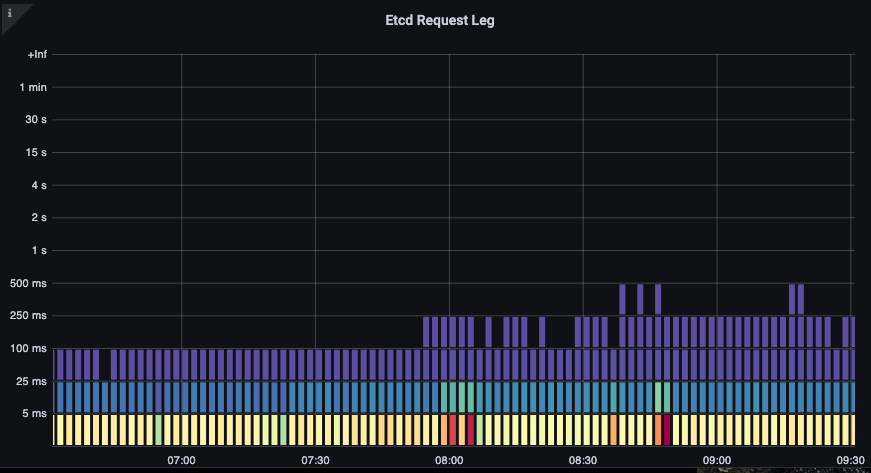
Figure: Etcd Requests
Conclusion
In this section of Observability best practices guide, We used a starter dashboard using Amazon Managed Service for Prometheus and Amazon Managed Grafana to help you with troubleshooting Amazon Elastic Kubernetes Service (Amazon EKS) API Servers. Further, we deep dived around understanding problems while troubleshooting the EKS API Servers, API priority and fairness, stopping bad behaviours. Finally deep dived in indentifying API calls that are slowest and API server latency issues which helps us to take actions to keep state of our Amazon EKS cluster healthy. For further deep dive, we would highly recommend you to practice Application Monitoring module under AWS native Observability category of AWS One Observability Workshop.