Log Aggregation
In this section of Observability best practices guide, we will deep dive on to following topics related to Amazon EKS Logging with AWS Native services:
- Introduction to AWS EKS logging
- Amazon EKS control plane logging
- Amazon EKS data plane logging
- Amazon EKS application logging
- Unified log aggregation from Amazon EKS and other compute platforms using AWS Native services
- Conclusion
Introduction
Amazon EKS logging can be divided into three types such as control plane logging, node logging, and application logging. The Kubernetes control plane is a set of components that manage Kubernetes clusters and produce logs used for auditing and diagnostic purposes. With Amazon EKS, you can turn on logs for different control plane components and send them to CloudWatch.
Kubernetes also runs system components such as kubelet and kube-proxy on each Kubernetes node that runs your pods. These components write logs within each node and you can configure CloudWatch and Container Insights to capture these logs for each Amazon EKS node.
Containers are grouped as pods within a Kubernetes cluster and are scheduled to run on your Kubernetes nodes. Most containerized applications write to standard output and standard error, and the container engine redirects the output to a logging driver. In Kubernetes, the container logs are found in the /var/log/pods directory on a node. You can configure CloudWatch and Container Insights to capture these logs for each of your Amazon EKS pods.
There are three common approaches for capturing logs Shipping container logs to a centralized log aggregation system in Kubernetes:
- Node level agent, like a Fluentd daemonset. This is the recommended pattern.
- Sidecar container, like a Fluentd sidecar container.
- Directly writing to log collection system. In this approach, the application is responsible for shipping the logs. This is the least recommended option because you will have to include the log aggregation system’s SDK in your application code instead of reusing community build solutions like Fluentd. This pattern also disobeys the principle of separation of concerns, according to which, logging implementation should be independent of the application. Doing so allows you to change the logging infrastructure without impacting or changing your application.
We will now dive in to each of these logging categories for Amazon EKS logging along with talking about unified log aggregation from Amazon EKS and other compute platforms.
Amazon EKS control plane logging
An Amazon EKS cluster consists of a high availability, single-tenant control plane for your Kubernetes cluster and the Amazon EKS nodes that run your containers. The control plane nodes run in an account managed by AWS. The Amazon EKS cluster control plane nodes are integrated with CloudWatch and you can turn on logging for specific control plane components. Logs are provided for each Kubernetes control plane component instance. AWS manages the health of your control plane nodes and provides a service-level agreement (SLA) for the Kubernetes endpoint.
Amazon EKS control plane logging consists of following cluster control plane log types. Each log type corresponds to a component of the Kubernetes control plane. To learn more about these components, see Kubernetes Components in the Kubernetes documentation.
- API server (
api) – Your cluster's API server is the control plane component that exposes the Kubernetes API. If you enable API server logs when you launch the cluster, or shortly thereafter, the logs include API server flags that were used to start the API server. For more information, seekube-apiserverand the audit policy in the Kubernetes documentation. - Audit (
audit) – Kubernetes audit logs provide a record of the individual users, administrators, or system components that have affected your cluster. For more information, see Auditing in the Kubernetes documentation. - Authenticator (
authenticator) – Authenticator logs are unique to Amazon EKS. These logs represent the control plane component that Amazon EKS uses for Kubernetes Role Based Access Control (RBAC) authentication using IAM credentials. For more information, see Cluster management. - Controller manager (
controllerManager) – The controller manager manages the core control loops that are shipped with Kubernetes. For more information, see kube-controller-manager in the Kubernetes documentation. - Scheduler (
scheduler) – The scheduler component manages when and where to run pods in your cluster. For more information, see kube-scheduler in the Kubernetes documentation.
Please follow enabling and disabling control plane logs section and enable control plane logs via AWS console or via AWS CLI.
Querying control plane logs from CloudWatch console
After you enable control plane logging on your Amazon EKS cluster, you can find EKS control plane logs in the /aws/eks/cluster-name/cluster log group. For more information, see Viewing cluster control plane logs. Please make sure to replace cluster-name with your cluster's name.
You can use CloudWatch Logs Insights to search through the EKS control plane log data. For more information, see Analyzing log data with CloudWatch Insights. It is important to node that, you can view log events in CloudWatch Logs only after you turn on control plane logging in a cluster. Before you select a time range to run queries in CloudWatch Logs Insights, verify that you turned on control plane logging. Please check the screenshot below showing an example of a EKS control plane log query with query output.
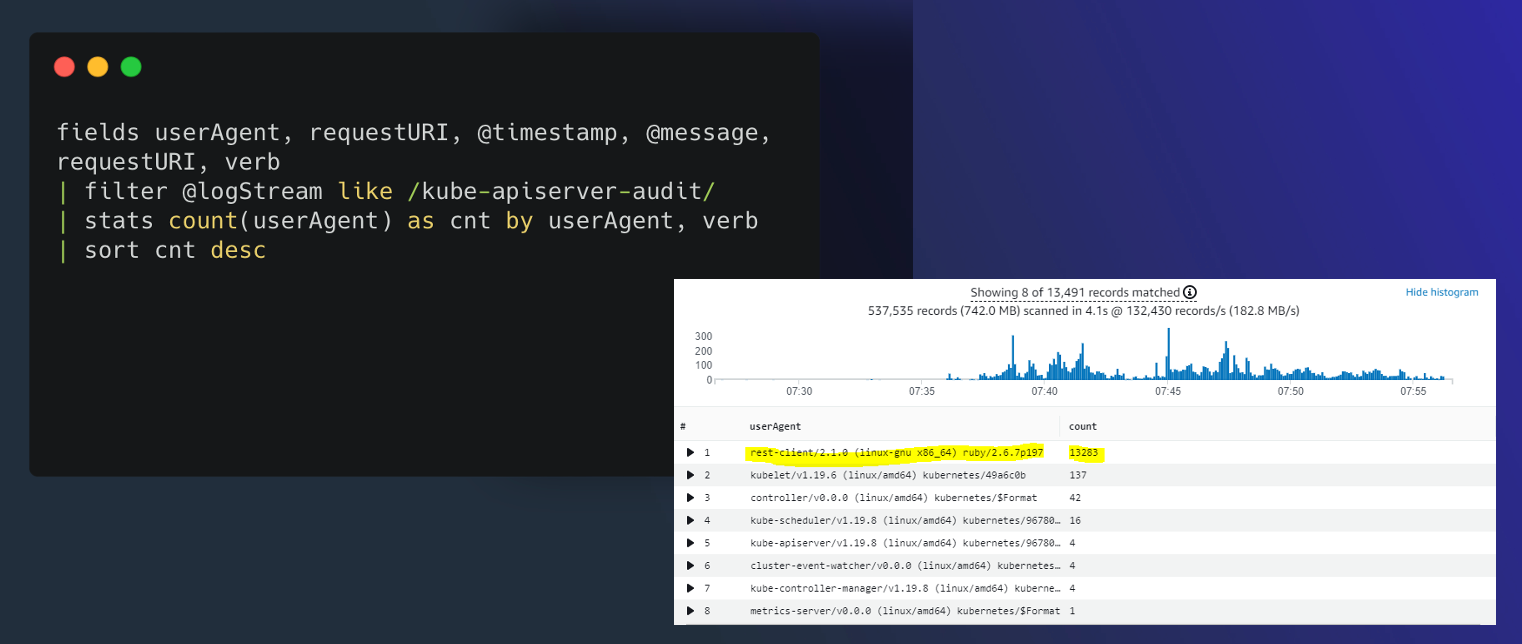
Figure: CloudWatch Logs Insights.
Sample queries for common EKS use cases on CloudWatch Logs Insights
To find the cluster creator, search for the IAM entity that's mapped to the kubernetes-admin user.
fields @logStream, @timestamp, @message| sort @timestamp desc
| filter @logStream like /authenticator/
| filter @message like "username=kubernetes-admin"
| limit 50
Example output:
@logStream, @timestamp @messageauthenticator-71976 ca11bea5d3083393f7d32dab75b,2021-08-11-10:09:49.020,"time=""2021-08-11T10:09:43Z"" level=info msg=""access granted"" arn=""arn:aws:iam::12345678910:user/awscli"" client=""127.0.0.1:51326"" groups=""[system:masters]"" method=POST path=/authenticate sts=sts.eu-west-1.amazonaws.com uid=""heptio-authenticator-aws:12345678910:ABCDEFGHIJKLMNOP"" username=kubernetes-admin"
In this output, IAM user arn:aws:iam::12345678910:user/awscli is mapped to user kubernetes-admin.
To find requests that a specific user performed, search for operations that the kubernetes-admin user performed.
fields @logStream, @timestamp, @message| filter @logStream like /^kube-apiserver-audit/
| filter strcontains(user.username,"kubernetes-admin")
| sort @timestamp desc
| limit 50
Example output:
@logStream,@timestamp,@messagekube-apiserver-audit-71976ca11bea5d3083393f7d32dab75b,2021-08-11 09:29:13.095,"{...""requestURI"":""/api/v1/namespaces/kube-system/endpoints?limit=500";","string""verb"":""list"",""user"":{""username"":""kubernetes-admin"",""uid"":""heptio-authenticator-aws:12345678910:ABCDEFGHIJKLMNOP"",""groups"":[""system:masters"",""system:authenticated""],""extra"":{""accessKeyId"":[""ABCDEFGHIJKLMNOP""],""arn"":[""arn:aws:iam::12345678910:user/awscli""],""canonicalArn"":[""arn:aws:iam::12345678910:user/awscli""],""sessionName"":[""""]}},""sourceIPs"":[""12.34.56.78""],""userAgent"":""kubectl/v1.22.0 (darwin/amd64) kubernetes/c2b5237"",""objectRef"":{""resource"":""endpoints"",""namespace"":""kube-system"",""apiVersion"":""v1""}...}"
To find API calls that a specific userAgent made, you can use this example query:
fields @logStream, @timestamp, userAgent, verb, requestURI, @message| filter @logStream like /kube-apiserver-audit/
| filter userAgent like /kubectl\/v1.22.0/
| sort @timestamp desc
| filter verb like /(get)/
Shortened example output:
@logStream,@timestamp,userAgent,verb,requestURI,@messagekube-apiserver-audit-71976ca11bea5d3083393f7d32dab75b,2021-08-11 14:06:47.068,kubectl/v1.22.0 (darwin/amd64) kubernetes/c2b5237,get,/apis/metrics.k8s.io/v1beta1?timeout=32s,"{""kind"":""Event"",""apiVersion"":""audit.k8s.io/v1"",""level"":""Metadata"",""auditID"":""863d9353-61a2-4255-a243-afaeb9183524"",""stage"":""ResponseComplete"",""requestURI"":""/apis/metrics.k8s.io/v1beta1?timeout=32s"",""verb"":""get"",""user"":{""username"":""kubernetes-admin"",""uid"":""heptio-authenticator-aws:12345678910:AIDAUQGC5HFOHXON7M22F"",""groups"":[""system:masters"",""system:authenticated""],""extra"":{""accessKeyId"":[""ABCDEFGHIJKLMNOP""],""arn"":[""arn:aws:iam::12345678910:user/awscli""],""canonicalArn"":[""arn:aws:iam::12345678910:user/awscli""],""sourceIPs"":[""12.34.56.78""],""userAgent"":""kubectl/v1.22.0 (darwin/amd64) kubernetes/c2b5237""...}"
To find mutating changes made to the aws-auth ConfigMap, you can use this example query:
fields @logStream, @timestamp, @message| filter @logStream like /^kube-apiserver-audit/
| filter requestURI like /\/api\/v1\/namespaces\/kube-system\/configmaps/
| filter objectRef.name = "aws-auth"
| filter verb like /(create|delete|patch)/
| sort @timestamp desc
| limit 50
Shortened example output:
@logStream,@timestamp,@messagekube-apiserver-audit-f01c77ed8078a670a2eb63af6f127163,2021-10-27 05:43:01.850,{""kind"":""Event"",""apiVersion"":""audit.k8s.io/v1"",""level"":""RequestResponse"",""auditID"":""8f9a5a16-f115-4bb8-912f-ee2b1d737ff1"",""stage"":""ResponseComplete"",""requestURI"":""/api/v1/namespaces/kube-system/configmaps/aws-auth?timeout=19s"",""verb"":""patch"",""responseStatus"": {""metadata"": {},""code"": 200 },""requestObject"": {""data"": { contents of aws-auth ConfigMap } },""requestReceivedTimestamp"":""2021-10-27T05:43:01.033516Z"",""stageTimestamp"":""2021-10-27T05:43:01.042364Z"" }
To find requests that were denied, you can use this example query:
fields @logStream, @timestamp, @message| filter @logStream like /^authenticator/
| filter @message like "denied"
| sort @timestamp desc
| limit 50
Example output:
@logStream,@timestamp,@messageauthenticator-8c0c570ea5676c62c44d98da6189a02b,2021-08-08 20:04:46.282,"time=""2021-08-08T20:04:44Z"" level=warning msg=""access denied"" client=""127.0.0.1:52856"" error=""sts getCallerIdentity failed: error from AWS (expected 200, got 403)"" method=POST path=/authenticate"
To find the node that a pod was scheduled on, query the kube-scheduler logs.
fields @logStream, @timestamp, @message| sort @timestamp desc
| filter @logStream like /kube-scheduler/
| filter @message like "aws-6799fc88d8-jqc2r"
| limit 50
Example output:
@logStream,@timestamp,@messagekube-scheduler-bb3ea89d63fd2b9735ba06b144377db6,2021-08-15 12:19:43.000,"I0915 12:19:43.933124 1 scheduler.go:604] ""Successfully bound pod to node"" pod=""kube-system/aws-6799fc88d8-jqc2r"" node=""ip-192-168-66-187.eu-west-1.compute.internal"" evaluatedNodes=3 feasibleNodes=2"
In this example output, pod aws-6799fc88d8-jqc2r was scheduled on node ip-192-168-66-187.eu-west-1.compute.internal.
To find HTTP 5xx server errors for Kubernetes API server requests, you can use this example query:
fields @logStream, @timestamp, responseStatus.code, @message| filter @logStream like /^kube-apiserver-audit/
| filter responseStatus.code >= 500
| limit 50
Shortened example output:
@logStream,@timestamp,responseStatus.code,@messagekube-apiserver-audit-4d5145b53c40d10c276ad08fa36d1f11,2021-08-04 07:22:06.518,503,"...""requestURI"":""/apis/metrics.k8s.io/v1beta1?timeout=32s"",""verb"":""get"",""user"":{""username"":""system:serviceaccount:kube-system:resourcequota-controller"",""uid"":""36d9c3dd-f1fd-4cae-9266-900d64d6a754"",""groups"":[""system:serviceaccounts"",""system:serviceaccounts:kube-system"",""system:authenticated""]},""sourceIPs"":[""12.34.56.78""],""userAgent"":""kube-controller-manager/v1.21.2 (linux/amd64) kubernetes/d2965f0/system:serviceaccount:kube-system:resourcequota-controller"",""responseStatus"":{""metadata"":{},""code"":503},..."}}"
To troubleshoot a CronJob activation, search for API calls that the cronjob-controller made.
fields @logStream, @timestamp, @message| filter @logStream like /kube-apiserver-audit/
| filter user.username like "system:serviceaccount:kube-system:cronjob-controller"
| display @logStream, @timestamp, @message, objectRef.namespace, objectRef.name
| sort @timestamp desc
| limit 50
Shortened example output:
{ "kind": "Event", "apiVersion": "audit.k8s.io/v1", "objectRef": { "resource": "cronjobs", "namespace": "default", "name": "hello", "apiGroup": "batch", "apiVersion": "v1" }, "responseObject": { "kind": "CronJob", "apiVersion": "batch/v1", "spec": { "schedule": "*/1 * * * *" }, "status": { "lastScheduleTime": "2021-08-09T07:19:00Z" } } }
In this example output, the hello job in the default namespace runs every minute and was last scheduled at 2021-08-09T07:19:00Z.
To find API calls that the replicaset-controller made, you can use this example query:
fields @logStream, @timestamp, @message| filter @logStream like /kube-apiserver-audit/
| filter user.username like "system:serviceaccount:kube-system:replicaset-controller"
| display @logStream, @timestamp, requestURI, verb, user.username
| sort @timestamp desc
| limit 50
Example output:
@logStream,@timestamp,requestURI,verb,user.usernamekube-apiserver-audit-8c0c570ea5676c62c44d98da6189a02b,2021-08-10 17:13:53.281,/api/v1/namespaces/kube-system/pods,create,system:serviceaccount:kube-system:replicaset-controller
kube-apiserver-audit-4d5145b53c40d10c276ad08fa36d1f11,2021-08-04 0718:44.561,/apis/apps/v1/namespaces/kube-system/replicasets/coredns-6496b6c8b9/status,update,system:serviceaccount:kube-system:replicaset-controller
To find operations that are made against a Kubernetes resource, you can use this example query:
fields @logStream, @timestamp, @message| filter @logStream like /^kube-apiserver-audit/
| filter verb == "delete" and requestURI like "/api/v1/namespaces/default/pods/my-app"
| sort @timestamp desc
| limit 10
The preceding example query filters for delete API calls on the default namespace for pod my-app. Shortened example output:
@logStream,@timestamp,@messagekube-apiserver-audit-e7b3cb08c0296daf439493a6fc9aff8c,2021-08-11 14:09:47.813,"...""requestURI"":""/api/v1/namespaces/default/pods/my-app"",""verb"":""delete"",""user"":{""username""""kubernetes-admin"",""uid"":""heptio-authenticator-aws:12345678910:ABCDEFGHIJKLMNOP"",""groups"":[""system:masters"",""system:authenticated""],""extra"":{""accessKeyId"":[""ABCDEFGHIJKLMNOP""],""arn"":[""arn:aws:iam::12345678910:user/awscli""],""canonicalArn"":[""arn:aws:iam::12345678910:user/awscli""],""sessionName"":[""""]}},""sourceIPs"":[""12.34.56.78""],""userAgent"":""kubectl/v1.22.0 (darwin/amd64) kubernetes/c2b5237"",""objectRef"":{""resource"":""pods"",""namespace"":""default"",""name"":""my-app"",""apiVersion"":""v1""},""responseStatus"":{""metadata"":{},""code"":200},""requestObject"":{""kind"":""DeleteOptions"",""apiVersion"":""v1"",""propagationPolicy"":""Background""},
..."
To retrieve a count of HTTP response codes for calls made to the Kubernetes API server, you can use this example query:
fields @logStream, @timestamp, @message| filter @logStream like /^kube-apiserver-audit/
| stats count(*) as count by responseStatus.code
| sort count desc
Example output:
responseStatus.code,count200,35066
201,525
403,125
404,116
101,2
To find changes that are made to DaemonSets/Addons in the kube-system namespace, you can use this example query:
filter @logStream like /^kube-apiserver-audit/| fields @logStream, @timestamp, @message
| filter verb like /(create|update|delete)/ and strcontains(requestURI,"/apis/apps/v1/namespaces/kube-system/daemonsets")
| sort @timestamp desc
| limit 50
Example output:
{ "kind": "Event", "apiVersion": "audit.k8s.io/v1", "level": "RequestResponse", "auditID": "93e24148-0aa6-4166-8086-a689b0031612", "stage": "ResponseComplete", "requestURI": "/apis/apps/v1/namespaces/kube-system/daemonsets/aws-node?fieldManager=kubectl-set", "verb": "patch", "user": { "username": "kubernetes-admin", "groups": [ "system:masters", "system:authenticated" ] }, "userAgent": "kubectl/v1.22.2 (darwin/amd64) kubernetes/8b5a191", "objectRef": { "resource": "daemonsets", "namespace": "kube-system", "name": "aws-node", "apiGroup": "apps", "apiVersion": "v1" }, "requestObject": { "REDACTED": "REDACTED" }, "requestReceivedTimestamp": "2021-08-09T08:07:21.868376Z", "stageTimestamp": "2021-08-09T08:07:21.883489Z", "annotations": { "authorization.k8s.io/decision": "allow", "authorization.k8s.io/reason": "" } }
In this example output, the kubernetes-admin user used kubectl v1.22.2 to patch the aws-node DaemonSet.
To find the user that deleted a node, you can use this example query:
fields @logStream, @timestamp, @message| filter @logStream like /^kube-apiserver-audit/
| filter verb == "delete" and requestURI like "/api/v1/nodes"
| sort @timestamp desc
| limit 10
Shortened example output:
@logStream,@timestamp,@messagekube-apiserver-audit-e503271cd443efdbd2050ae8ca0794eb,2022-03-25 07:26:55.661,"{"kind":"Event","
Finally, if you have started using control plane logging feature, we would highly recommend you to learn more about Understanding and Cost Optimizing Amazon EKS Control Plane Logs.
Amazon EKS data plane logging
We recommend that you use CloudWatch Container Insights to capture logs and metrics for Amazon EKS. Container Insights implements cluster, node, and pod-level metrics with the CloudWatch agent, and Fluent Bit or Fluentd for log capture to CloudWatch. Container Insights also provides automatic dashboards with layered views of your captured CloudWatch metrics. Container Insights is deployed as CloudWatch DaemonSet and Fluent Bit DaemonSet that runs on every Amazon EKS node. Fargate nodes are not supported by Container Insights because the nodes are managed by AWS and don’t support DaemonSets. Fargate logging for Amazon EKS is covered separately in this guide.
The following table shows the CloudWatch log groups and logs captured by the default Fluentd or Fluent Bit log capture configuration for Amazon EKS.
/aws/containerinsights/Cluster_Name/host | Logs from /var/log/dmesg, /var/log/secure, and /var/log/messages. |
|---|---|
/aws/containerinsights/Cluster_Name/dataplane | The logs in /var/log/journal for kubelet.service, kubeproxy.service, and docker.service. |
If you don’t want to use Container Insights with Fluent Bit or Fluentd for logging, you can capture node and container logs with the CloudWatch agent installed on Amazon EKS nodes. Amazon EKS nodes are EC2 instances, which means you should include them in your standard system-level logging approach for Amazon EC2. If you install the CloudWatch agent using Distributor and State Manager, then Amazon EKS nodes are also included in the CloudWatch agent installation, configuration, and update. The following table shows logs that are specific to Kubernetes and that you must capture if you aren’t using Container Insights with Fluent Bit or Fluentd for logging.
var/log/aws-routed-eni/ipamd.log``/var/log/aws-routed-eni/plugin.log | The logs for the L-IPAM daemon can be found here |
|---|
Please reference Amazon EKS node logging prescriptive guidance to learn more about data plane logging.
Amazon EKS application logging
Amazon EKS application logging becomes inevitable while running applications at scale in Kubernetes environment. To collect application logs you must install a log aggregator, such as Fluent Bit, Fluentd, or CloudWatch Container Insights, in your Amazon EKS cluster.
Fluent Bit is an open-source log processor and forwarder that is written in C++, which means that you can collect data from different sources, enrich them with filters, and send them to multiple destinations. By using this guide's solution you can enable aws-for-fluent-bit or fargate-fluentbit for logging. Fluentd is an open-source data collector for unified logging layer and written in Ruby. Fluentd acts as a unified logging layer that can aggregate data from multiple sources, unify data with different formats into JSON-formatted objects, and route them to different output destinations. Choosing a log collector is important for CPU and memory utilization when you monitor thousands of servers. If you have multiple Amazon EKS clusters, you can use Fluent Bit as a lightweight shipper to collect data from different nodes in the cluster and forward it to Fluentd for aggregation, processing and routing to a supported output destination.
We recommend to use Fluent Bit as the log collector and forwarder to send application and cluster logs to CloudWatch. You can then stream the logs to Amazon OpenSearch Service by using a subscription filter in CloudWatch. This option is shown in this section's architecture diagram.
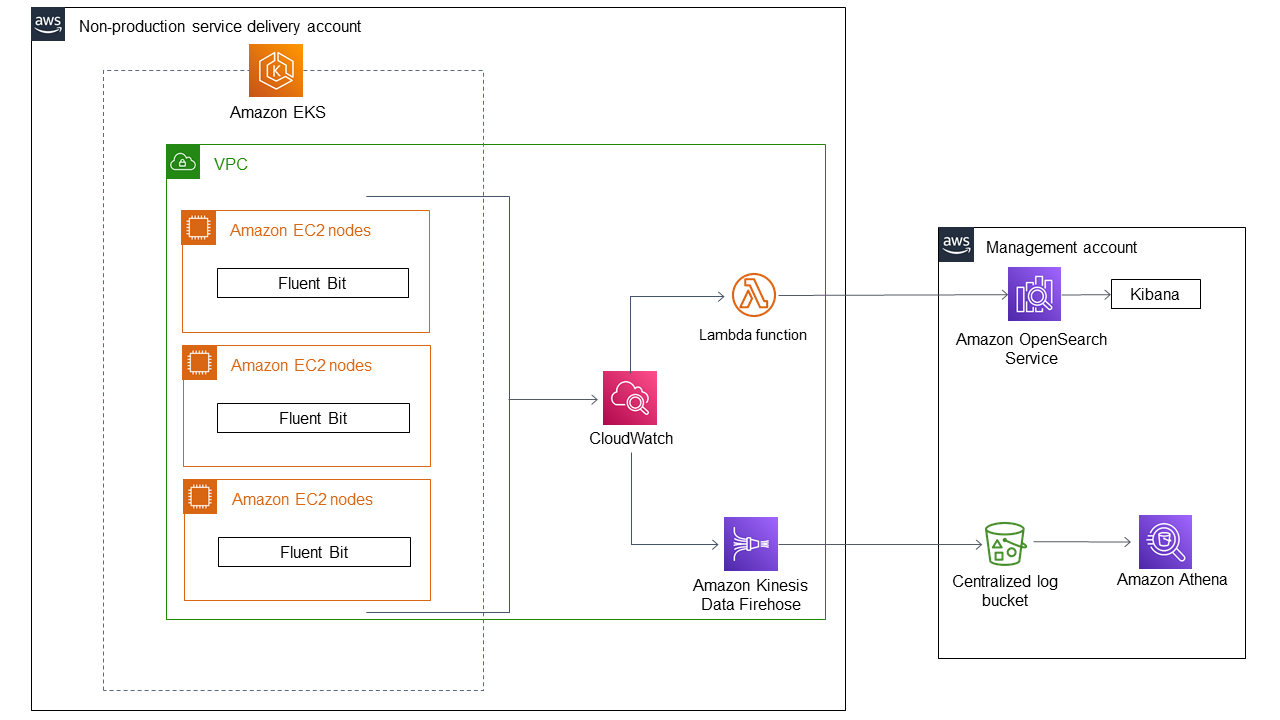
Figure: Amazon EKS application logging architecture.
The diagram shows the following workflow when application logs from Amazon EKS clusters are streamed to Amazon OpenSearch Service. The Fluent Bit service in the Amazon EKS cluster pushes the logs to CloudWatch. The AWS Lambda function streams the logs to Amazon OpenSearch Service using a subscription filter. You can then use Kibana to visualize the logs in the configured indexes. You can also stream logs by using Amazon Kinesis Data Firehose and store them in an S3 bucket for analysis and querying with Amazon Athena.
In most clusters, using Fluentd or Fluent Bit for log aggregation needs little optimization. This changes when you’re dealing with larger clusters with thousands of pods and nodes. We have published our findings from studying the impact of Fluentd and Fluent Bit in clusters with thousands of pods. For further learning, we would recommend you to check on enhancement to Fluent Bit that is designed to reduce the volume API calls it makes to the Kubernetes API servers using Use_Kubelet option. This Fluent Bit’s Use_Kubelet feature allows it to retrieve pod metadata from the kubelet on the host. Amazon EKS customers can use Fluent Bit to capture logs in clusters that run tens of thousands of pods with this feature enabled without overloading the Kubernetes API server. We recommend enabling the feature even if you aren’t running a large Kubernetes cluster.
Logging for Amazon EKS on Fargate
With Amazon EKS on Fargate, you can deploy pods without allocating or managing your Kubernetes nodes. This removes the need to capture system-level logs for your Kubernetes nodes. To capture the logs from your Fargate pods, you can use Fluent Bit to forward the logs directly to CloudWatch. This enables you to automatically route logs to CloudWatch without further configuration or a sidecar container for your Amazon EKS pods on Fargate. For more information about this, see Fargate logging in the Amazon EKS documentation and Fluent Bit for Amazon EKS on the AWS Blog. This solution captures the STDOUT and STDERR input/output (I/O) streams from your container and sends them to CloudWatch through Fluent Bit, based on the Fluent Bit configuration established for the Amazon EKS cluster on Fargate.
With Fluent Bit support for Amazon EKS, you no longer need to run a sidecar to route container logs from Amazon EKS pods running on Fargate. With the new built-in logging support, you can select a destination of your choice to send the records to. Amazon EKS on Fargate uses a version of Fluent Bit for AWS, an upstream conformant distribution of Fluent Bit managed by AWS.
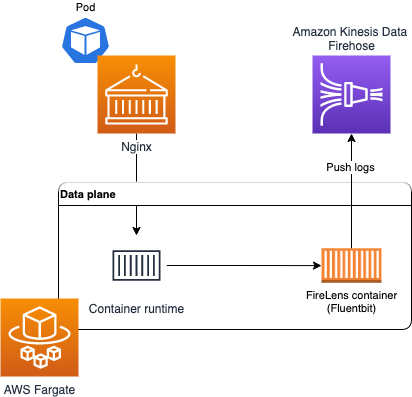
Figure: Logging for Amazon EKS on Fargate.
Please learn more about Fluent Bit support for Amazon EKS see Fargate logging in the Amazon EKS documentation.
For some reasons, for pods running on AWS Fargate where you need to use the sidecar pattern. You can run a Fluentd (or Fluent Bit) sidecar container to capture logs produced by your applications. This option requires that the application writes logs to filesystem instead of stdout or stderr. A consequence of this approach is that you will not be able use kubectl logs to view container logs. To make logs appear in kubectl logs, you can write application logs to both stdout and filesystem simultaneously.
Pods on Fargate get 20GB of ephemeral storage, which is available to all the containers that belong to a pod. You can configure your application to write logs to the local filesystem and instruct Fluentd to watch the log directory (or file). Fluentd will read events from the tail of log files and send the events to a destination like CloudWatch for storage. Ensure that you rotate logs regularly to prevent logs from usurping the entire volume.
Please learn more about How to capture application logs when using Amazon EKS on AWS Fargate to operate and observe your kubernets applications at scale on AWS Fargate. We will also tee write to file and stdout so we see logs in kubectl logs in this approach.
Unified log aggregation from Amazon EKS and other compute platforms using AWS Native services
Customers these days want to unify and centralize logs across different computing platforms such as Amazon Elastic Kubernetes Service (Amazon EKS), Amazon Elastic Compute Cloud (Amazon EC2), Amazon Elastic Container Service (Amazon ECS), Amazon Kinesis Data Firehose, and AWS Lambda using agents, log routers, and extensions. We can then use Amazon OpenSearch Service with OpenSearch Dashboards to visualize and analyze the logs, collected across different computing platforms to get application insights.
A unified aggregated log system provides the following benefits:
- A single point of access to all the logs across different computing platforms
- Help defining and standardizing the transformations of logs before they get delivered to downstream systems like Amazon Simple Storage Service (Amazon S3), Amazon OpenSearch Service, Amazon Redshift, and other services
- The ability to use Amazon OpenSearch Service to quickly index, and OpenSearch Dashboards to search and visualize logs from its routers, applications, and other devices
The following diagram shows the architecture which performs log aggregation across different compute platforms such as Amazon Elastic Kubernetes Service (Amazon EKS), Amazon Elastic Compute Cloud (Amazon EC2), Amazon Elastic Container Service (Amazon ECS),and AWS Lambda.
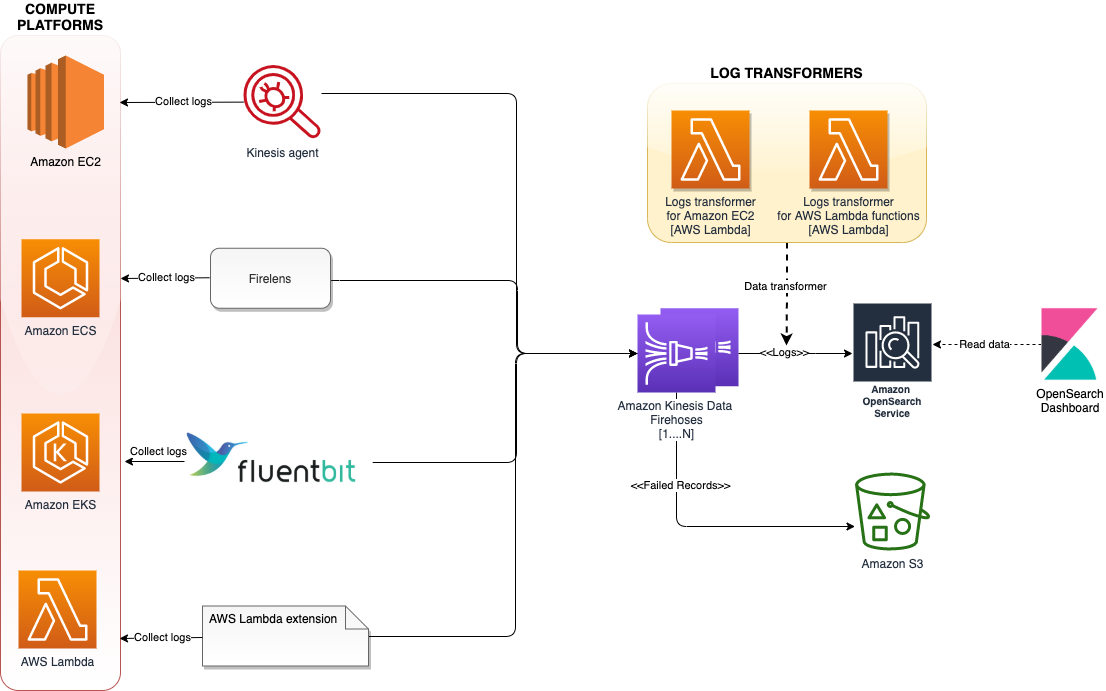
Figure: Log aggregation across different compute platforms.
The architecture uses various log aggregation tools such as log agents, log routers, and Lambda extensions to collect logs from multiple compute platforms and deliver them to Kinesis Data Firehose. Kinesis Data Firehose streams the logs to Amazon OpenSearch Service. Log records that fail to get persisted in Amazon OpenSearch service will get written to AWS S3. To scale this architecture, each of these compute platforms streams the logs to a different Firehose delivery stream, added as a separate index, and rotated every 24 hours.
For further learning check on how to unify and centralize logs across different compute platforms such as Amazon Elastic Kubernetes Service (Amazon EKS), Amazon Elastic Compute Cloud (Amazon EC2), Amazon Elastic Container Service (Amazon ECS),and AWS Lambda using Kinesis Data Firehose and Amazon OpenSearch Service. This approach allows you to analyze logs quickly and the root cause of failures, using a single platform rather than different platforms for different services.
Conclusion
In this section of Observability best practices guide, we started with deep diving in three types of Kubernetes logging such as control plane logging, node logging, and application logging. Further we learned about unified log aggregation from Amazon EKS and other compute platforms using AWS Native services such as Kinesis Data Firehose and Amazon OpenSearch Service. For further deep dive, we would highly recommend you to practice Logs and Insights modules under AWS native Observability category of AWS One Observability Workshop.