Collecting system metrics in an ECS cluster using AWS Distro for OpenTelemetry
AWS Distro for OpenTelemetry (ADOT) is a secure, AWS-supported distribution of the OpenTelemetry project. Using ADOT, you can collect telemetry data from multiple sources and send correlated metrics, traces and logs to multiple monitoring solutions. ADOT may be deployed on Amazon ECS cluster in two difference patterns.
Deployment patterns for ADOT Collector
-
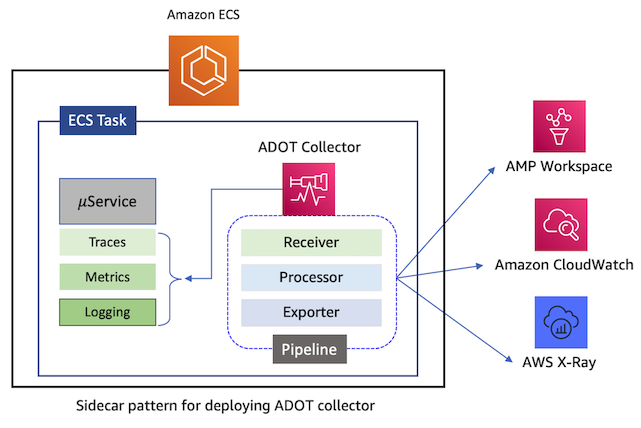
In the sidecar pattern, the ADOT collector runs inside each task in the cluster and it processes telemetry data collected from application containers only within that task. This deployment pattern is required only when you need the collector to read task metadata from Amazon ECS Task Metadata Endpoint, and generate resource usage metrics (such as CPU, memory, network, and disk) from them.
-
In the central collector pattern, a single instance of ADOT collector is deployed on the cluster and it processes telemetry data from all the tasks running on the cluster. This is the most commonly used deployment pattern. The collector is deployed using either REPLICA or DAEMON service scheduler strategy.
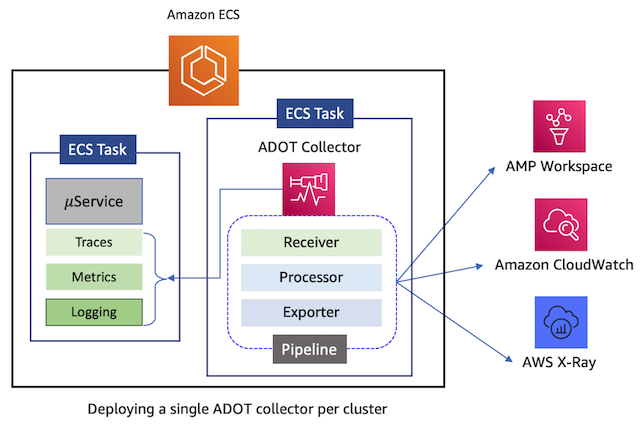
The ADOT collector architecture has the concept of a pipeline. A single collector can contain more than one pipeline. Each pipeline is dedicated to processing one of the three types of telemetry data, namely, metrics, traces and logs. You can configure multiple pipelines for each type of telemetry data. This versatile architecture thus allows a single collector to perform the role of multiple observability agents that would otherwise have to be deployed on the cluster. It significantly reduces the deployment footprint of obsevrability agents on the cluster. The primary components of a collector that make up a pipeline are grouped into three categories, namely, Receiver, Processor, and Exporter. There are secondary components called Extensions which provide capabilities that can be added to the collector, but which are not part of pipelines.
Refer to the OpenTelemetry documentaton for a detailed explanation of Receivers, Processors, Exporters and Extensions.
Deploying ADOT Collector for ECS task metrics collection
To collect resource utilization metrics at the ECS task level, the ADOT collector should be deployed using the sidecar pattern, using a task definition as shown below. The container image used for the collector is bundled with several pipeline configurations. You can choose one of them based on your requirments and specify the configuration file path in the command section of the container defintion. Setting this value to --config=/etc/ecs/container-insights/otel-task-metrics-config.yaml will result in the use of a pipeline configuration that collects resource utilization metrics and traces from other containers running within the same task as the collector and send them to Amazon CloudWatch and AWS X-Ray. Specifically, the collector uses an AWS ECS Container Metrics Receiver that reads task metadata and docker stats from Amazon ECS Task Metadata Endpoint, and generates resource usage metrics (such as CPU, memory, network, and disk) from them.
{
    "family":"AdotTask",
    "taskRoleArn":"arn:aws:iam::123456789012:role/ECS-ADOT-Task-Role",
    "executionRoleArn":"arn:aws:iam::123456789012:role/ECS-Task-Execution-Role",
    "networkMode":"awsvpc",
    "containerDefinitions":[
       {
          "name":"application-container",
          "image":"..."
       },
       {
          "name":"aws-otel-collector",
          "image":"public.ecr.aws/aws-observability/aws-otel-collector:latest",
          "cpu":512,
          "memory":1024,
          "command": [
            "--config=/etc/ecs/container-insights/otel-task-metrics-config.yaml"
          ],
          "portMappings":[
             {
                "containerPort":2000,
                "protocol":"udp"
             }
          ],
          "essential":true
       }
    ],
    "requiresCompatibilities":[
       "EC2"
    ],
    "cpu":"1024",
    "memory":"2048"
 }
Refer to the documentation for details about setting up the IAM task role and task execution role that the ADOT collector will use when deployed on an Amazon ECS cluster.
The AWS ECS Container Metrics Receiver works only for ECS Task Metadata Endpoint V4. Amazon ECS tasks on Fargate that use platform version 1.4.0 or later and Amazon ECS tasks on Amazon EC2 that are running at least version 1.39.0 of the Amazon ECS container agent can utilize this receiver. For more information, see Amazon ECS Container Agent Versions
As seen in the default pipeline configuration, the collector's pipeline first uses the Filter Processor which filters out a subset of metrics pertaining to CPU, memory, network, and disk usage. Then it uses the Metrics Transform Processor that performs a set of transformations to change the names of these metrics as well as update their attributes. Finally, the metrics are sent to CloudWatch as performance log events using the Amazon CloudWatch EMF Exporter. Using this default configuration will result in collection of the following resource usage metrics under the CloudWatch namespace ECS/ContainerInsights.
- MemoryUtilized
- MemoryReserved
- CpuUtilized
- CpuReserved
- NetworkRxBytes
- NetworkTxBytes
- StorageReadBytes
- StorageWriteBytes
Note that these are the same metrics collected by Container Insights for Amazon ECS and are made readily available in CloudWatch when you enable Container Insights at the cluster or account level. Hence, enabling Container Insights is the recommended approach for collecting ECS resource usage metrics in CloudWatch.
The AWS ECS Container Metrics Receiver emits 52 unique metrics which it reads from the Amazon ECS Task Metadata Endpoint. The complete list of metrics collected by the receiver is documented here. You may not want to send all of them to your preferred destination. If you want more explicit control over the ECS resource usage metrics, then you can create a custom pipeline configuration, filtering and transforming the available metrics with your choice of processors/transfomers and send them to a destination based on your choice of exporters. Refer to the documentation for additional examples of pipeline configurations to capture ECS task level metrics.
If you want to use a custom pipeline configuration, then you can use the task definition shown below and deploy the collector using the sidecar pattern. Here, the configuration of the collector pipeline is loaded from a parameter named otel-collector-config in AWS SSM Parameter Store.
The SSM Parameter Store parameter name must be exposed to the collector using an environment variable named AOT_CONFIG_CONTENT.
{
    "family":"AdotTask",
    "taskRoleArn":"arn:aws:iam::123456789012:role/ECS-ADOT-Task-Role",
    "executionRoleArn":"arn:aws:iam::123456789012:role/ECS-Task-Execution-Role",
    "networkMode":"awsvpc",
    "containerDefinitions":[
       {
          "name":"application-container",
          "image":"..."
       },
       {
          "name":"aws-otel-collector",
          "image":"public.ecr.aws/aws-observability/aws-otel-collector:latest",
          "cpu":512,
          "memory":1024,
          "secrets":[
             {
                "name":"AOT_CONFIG_CONTENT",
                "valueFrom":"arn:aws:ssm:us-east-1:123456789012:parameter/otel-collector-config"
             }
          ],
          "portMappings":[
             {
                "containerPort":2000,
                "protocol":"udp"
             }
          ],
          "essential":true
       }
    ],
    "requiresCompatibilities":[
       "EC2"
    ],
    "cpu":"1024",
    "memory":"2048"
 }
Deploying ADOT Collector for ECS container instance metrics collection
To collect EC2 instance-level metrics from your ECS cluster, the ADOT collector can be deployed using a task definition as shown below. It should be deployed with the daemon service scheduler strategy. You can choose a pipeline configuration bundled into the container image. The configuration file path in the command section of the container defintion should be set to --config=/etc/ecs/otel-instance-metrics-config.yaml. The collector uses the AWS Container Insights Receiver to collect EC2 instance-level infrastructure metrics for many resources such as such as CPU, memory, disk, and network. the metrics are sent to CloudWatch as performance log events using the Amazon CloudWatch EMF Exporter. The functionality of the collector with this configuration is equivalent to that of deploying the CloudWatch agent to an Amazon ECS cluster hosted on EC2,
The ADOT Collector deployment for collecting EC2 instance-level metrics is not supported on ECS clusters running on AWS Fargate
{
    "family":"AdotTask",
    "taskRoleArn":"arn:aws:iam::123456789012:role/ECS-ADOT-Task-Role",
    "executionRoleArn":"arn:aws:iam::123456789012:role/ECS-Task-Execution-Role",
    "networkMode":"awsvpc",
    "containerDefinitions":[
       {
          "name":"application-container",
          "image":"..."
       },
       {
          "name":"aws-otel-collector",
          "image":"public.ecr.aws/aws-observability/aws-otel-collector:latest",
          "cpu":512,
          "memory":1024,
          "command": [
            "--config=/etc/ecs/otel-instance-metrics-config.yaml"
          ],
          "portMappings":[
             {
                "containerPort":2000,
                "protocol":"udp"
             }
          ],
          "essential":true
       }
    ],
    "requiresCompatibilities":[
       "EC2"
    ],
    "cpu":"1024",
    "memory":"2048"
 }