Real-time cost monitoring
Amazon Managed Service for Prometheus is a server-less, Prometheus-compatible monitoring service for container metrics that makes it easier to securely monitor container environments at scale. Amazon Managed Service for Prometheus pricing model is based on Metric samples ingested, Query samples processed, and Metrics stored. You can find the latest pricing details here.
As a managed service, Amazon Managed Service for Prometheus automatically scales the ingestion, storage, and querying of operational metrics as workloads scale up and down. Some of our customers asked us guidance on how to track metric samples ingestion rate and it's cost real-time. Let's explore how you can achieve that.
Solution
Amazon Managed Service for Prometheus vends usage metrics to Amazon CloudWatch. These metrics can be used to help you gain better visibility into your Amazon Managed Service for Prometheus workspace. The vended metrics can be found in the AWS/Usage and AWS/Prometheus namespaces in CloudWatch and these metrics are available in CloudWatch for no additional charge. You can always create a CloudWatch dashboard to further explore and visualize these metrics.
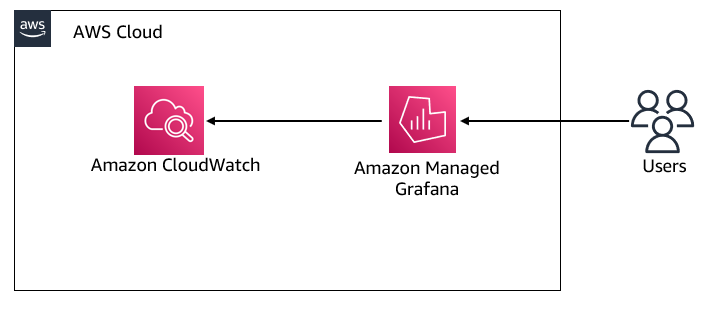
Today, you will be using Amazon CloudWatch as a data-source for Amazon Managed Grafana and build dashboards in Grafana to visualize those metrics. The architecture diagram illustrates the following.
-
Amazon Managed Service for Prometheus publishing vended metrics to Amazon CloudWatch
-
Amazon CloudWatch as a data-source for Amazon Managed Grafana
-
Users accessing the dashboards created in Amazon Managed Grafana
Amazon Managed Grafana Dashboards
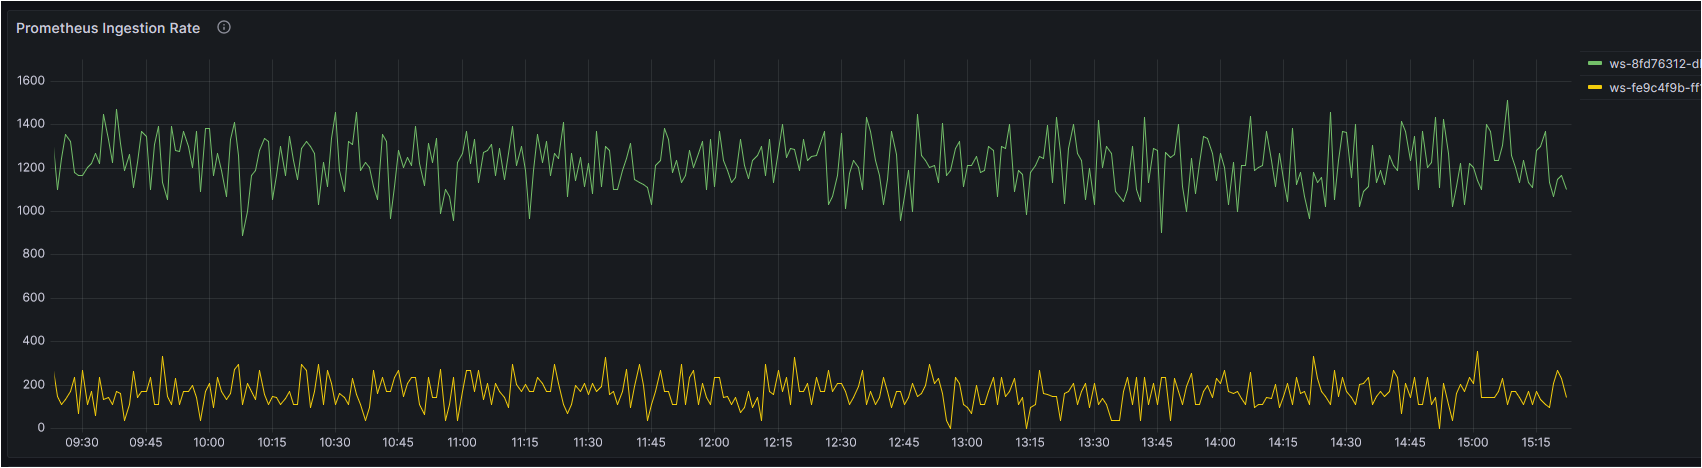
The dashboard created in Amazon Managed Grafana will enable you to visualize;
-
Prometheus Ingestion Rate per workspace
-
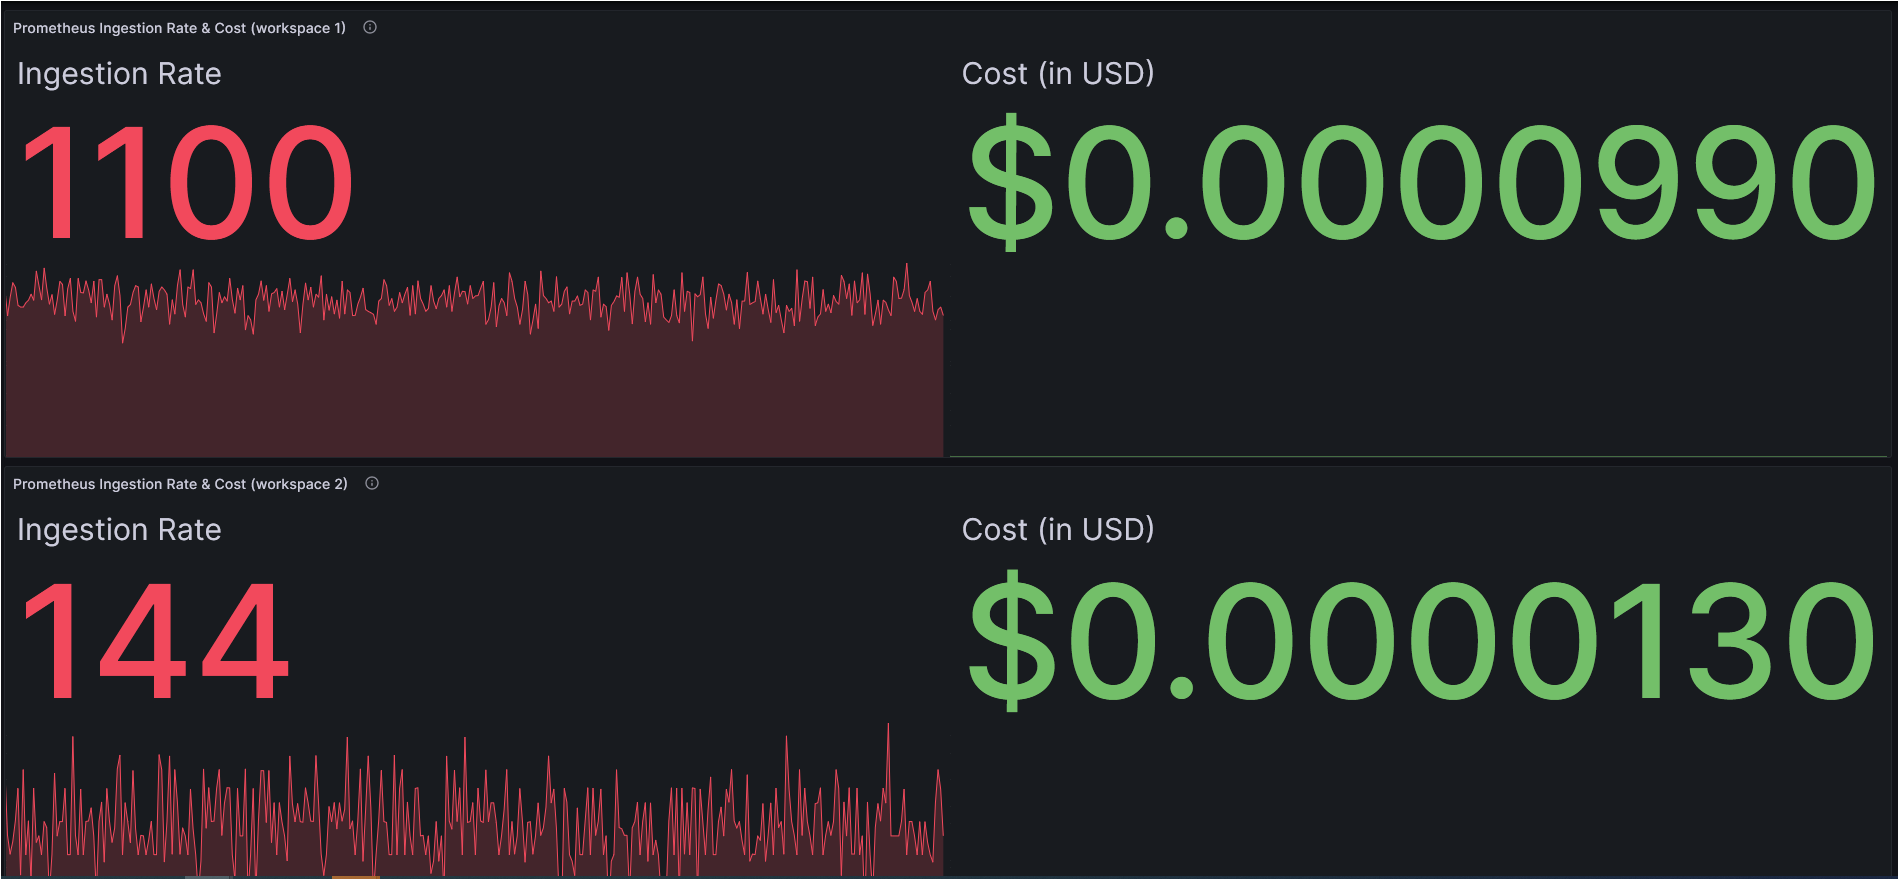
Prometheus Ingestion Rate and Real-time Cost per workspace
For real-time cost tracking, you will be using amath expressionbased on the pricing ofMetrics Ingested Tierfor theFirst 2 billion samplesmentioned in the official AWS pricing document. Math operations take numbers and time series as input and change them to different numbers and time series and refer this document for further customization to fit your business requirements.
-
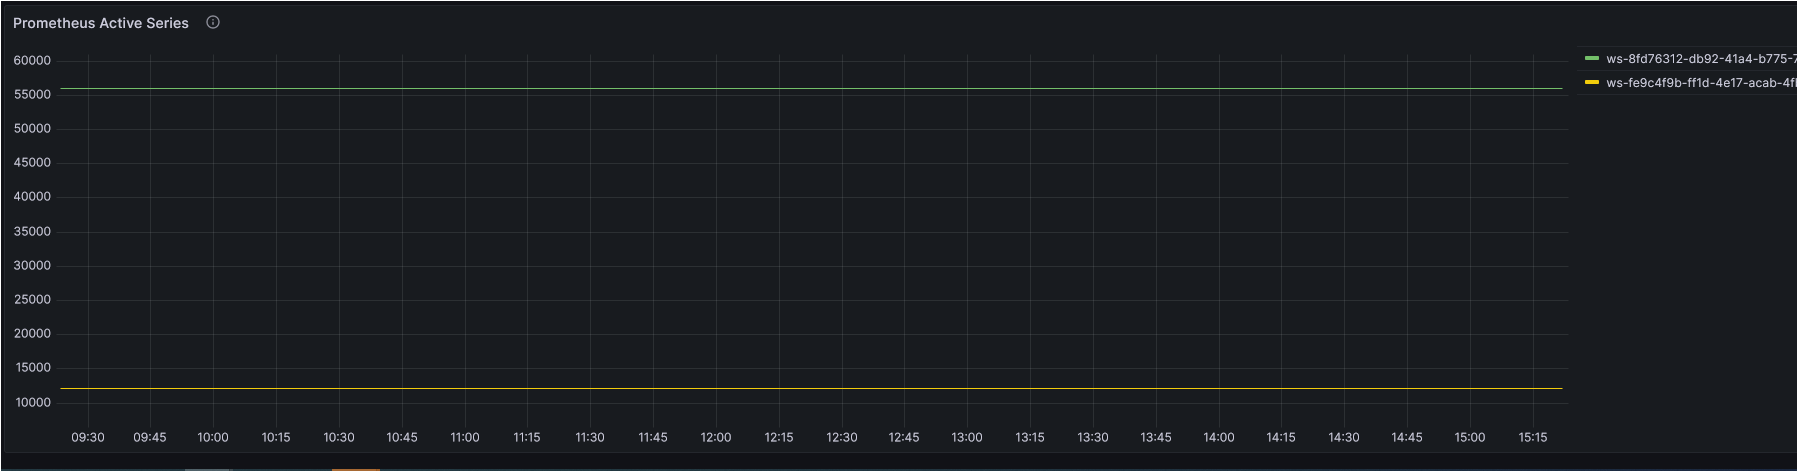
Prometheus Active Series per workspace
A dashboard in Grafana is represented by a JSON object, which stores metadata of its dashboard. Dashboard metadata includes dashboard properties, metadata from panels, template variables, panel queries, etc.
You can access the JSON template of the above dashboard here.
With the preceding dashboard, you can now identify ingestion rate per workspace and monitor real-time cost per workspace based on the metrics ingestion rate for Amazon Managed Service for Prometheus. You can use other Grafana dashboard panels to build visuals to suit your requirements.