Amazon Managed Service for Prometheus
Amazon Managed Service for Prometheus cost and usage visuals will allow you to gain insights into cost of individual AWS Accounts, AWS Regions, specific Prometheus Workspace instances along with Operations like RemoteWrite, Query, and HourlyStorageMetering!
To visualize and analyze the cost and usage data, you need to create a custom Athena view.
-
Before proceeding, make sure that you’ve created the CUR (step #1) and deployed the AWS CloudFormation Template (step #2) mentioned in the Implementation overview.
-
Now, Create a new Amazon Athena view by using the following query. This query fetches cost and usage of Amazon Managed Service for Prometheus across all the AWS Accounts in your Organization.
CREATE OR REPLACE VIEW "prometheus_cost" AS SELECT line_item_usage_type , line_item_resource_id , line_item_operation , line_item_usage_account_id , month , year , "sum"(line_item_usage_amount) "Usage" , "sum"(line_item_unblended_cost) cost FROM database.tablename #replace database.tablename with your database and table name WHERE ("line_item_product_code" = 'AmazonPrometheus') GROUP BY 1, 2, 3, 4, 5, 6
Create Amazon Managed Grafana dashboard
With Amazon Managed Grafana, you can add Athena as a data source by using the AWS data source configuration option in the Grafana workspace console. This feature simplifies adding Athena as a data source by discovering your existing Athena accounts and manages the configuration of the authentication credentials that are required to access Athena. For prerequisites associated with using the Athena data source, see Prerequisites.
The following Grafana dashboard shows Amazon Managed Service for Prometheus cost and usage across all AWS Accounts in your AWS Organizations along with cost of individual Prometheus Workspace instances and the Operations like RemoteWrite, Query, and HourlyStorageMetering!
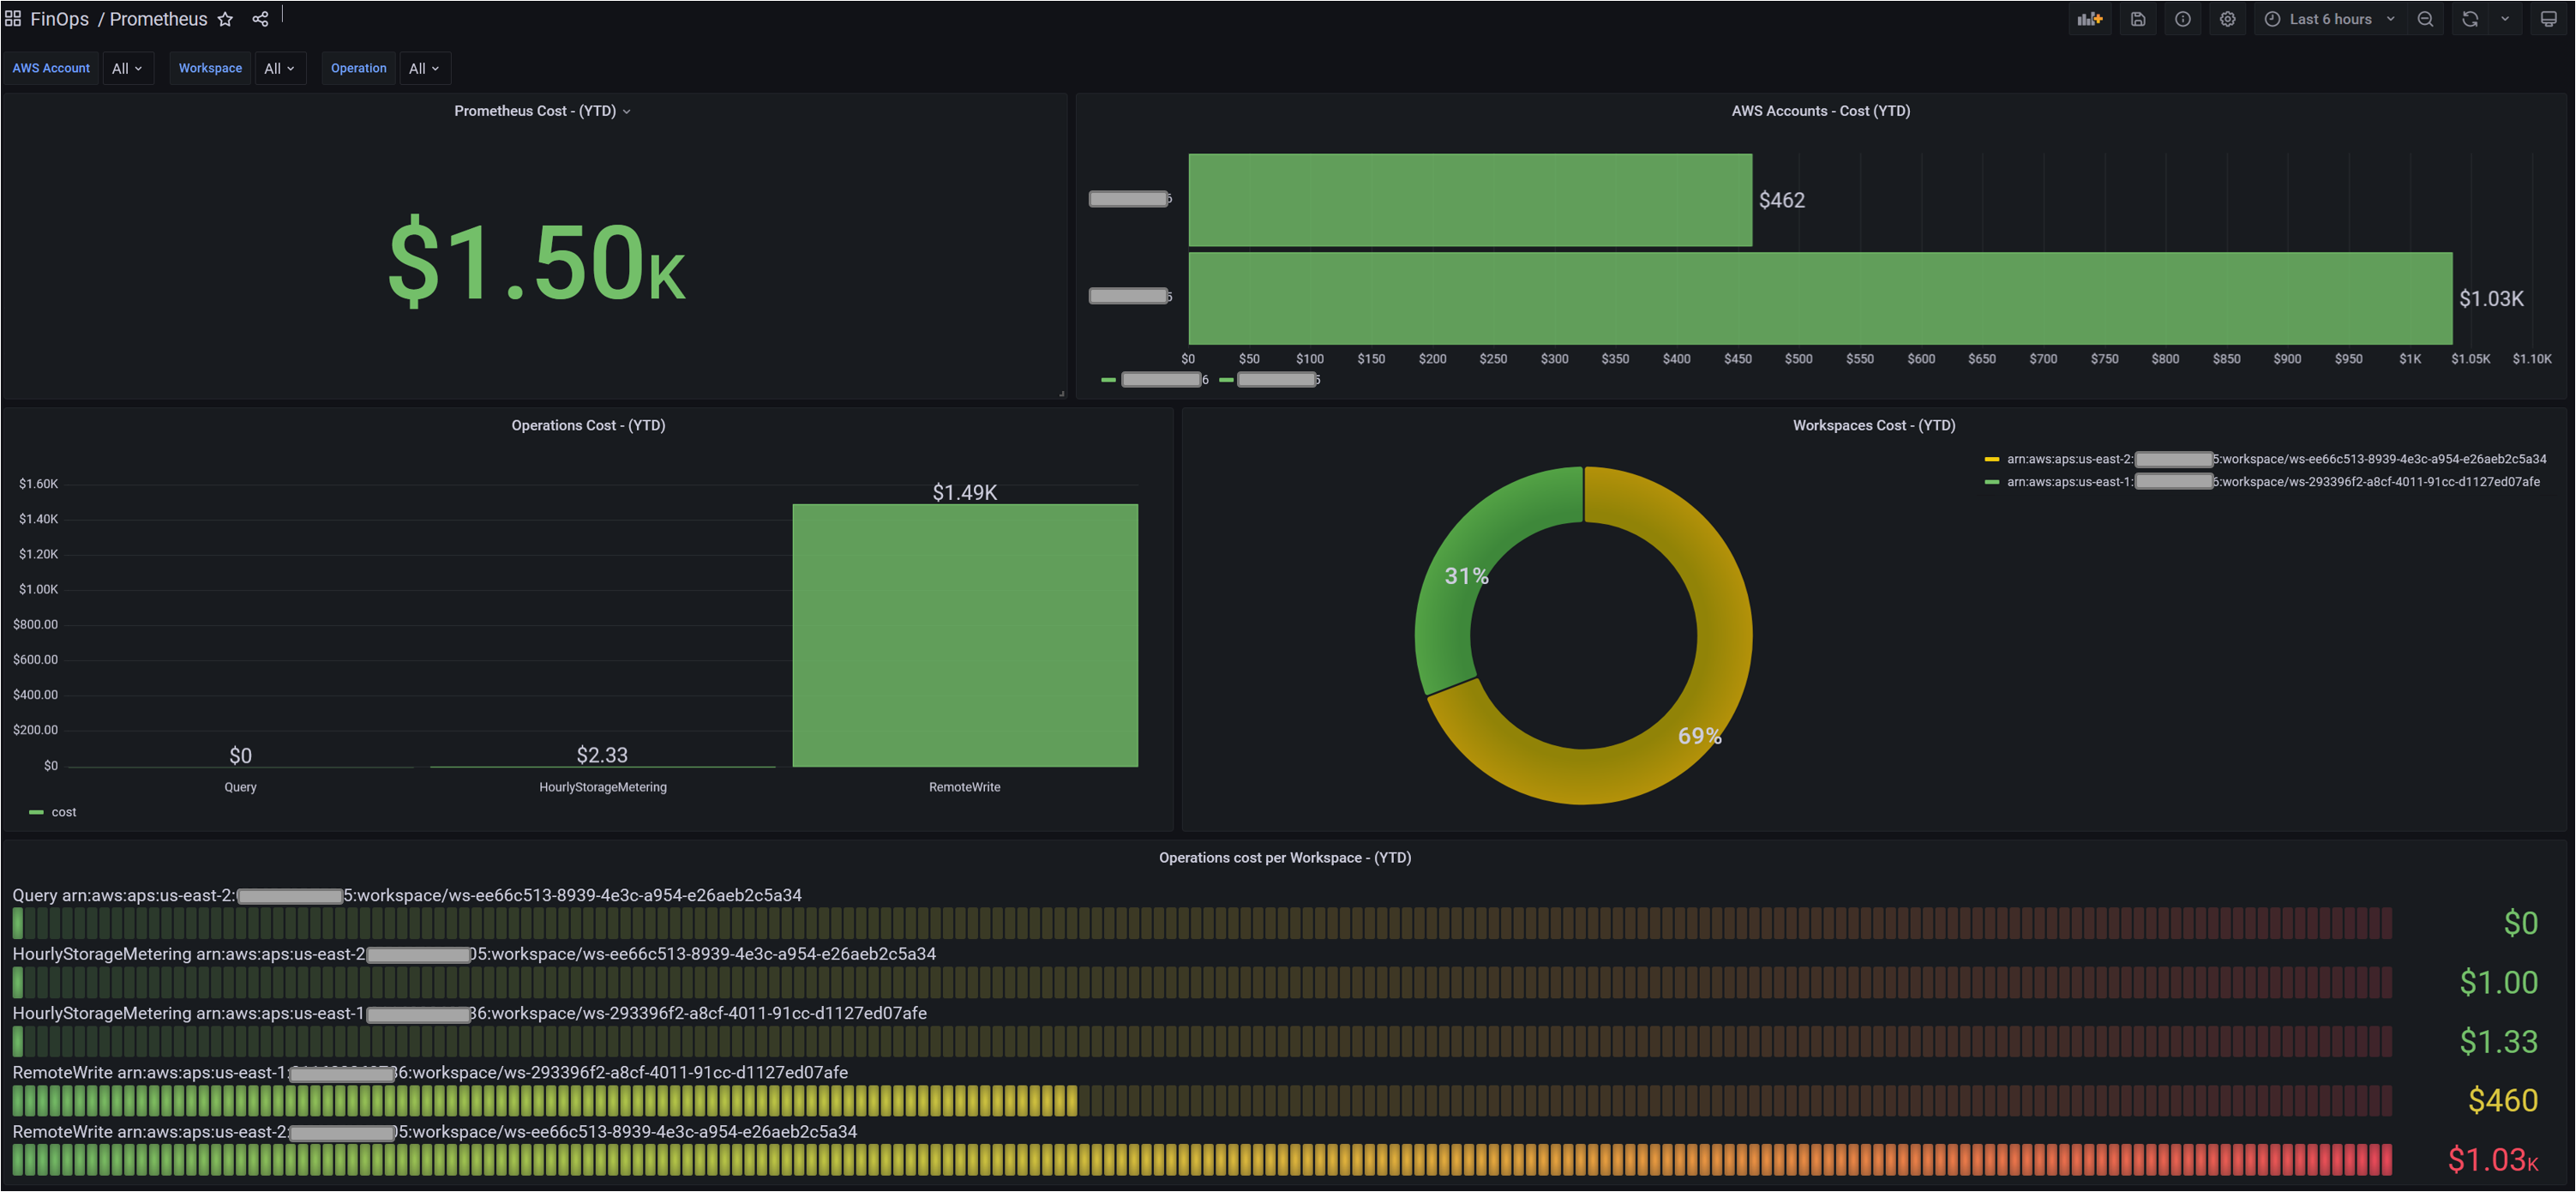
A dashboard in Grafana is represented by a JSON object, which stores metadata of its dashboard. Dashboard metadata includes dashboard properties, metadata from panels, template variables, panel queries, etc. Access the JSON template of the above dashboard here.
With the preceding dashboard, you can now identify the cost and usage of Amazon Managed Service for Prometheus in the AWS accounts across your Organization. You can use other Grafana dashboard panels to build visuals to suit your requirements.