AWS Observability services and Cost
As you invest in your Observability stack, it’s important that you monitor the cost of your observability products on a regular basis. This allows you to ensure that you are only incurring the costs you need and that you are not overspending on resources you don't need.
AWS Tools for Cost Optimization
Most organizations’ core focus lies on scaling their IT infrastructure on cloud, and usually are uncontrolled, unprepared, and unaware of their actual or forthcoming cloud spend. To help you track, report, and analyze costs over time, AWS provides several cost-optimization tools:
AWS Cost Explorer – See patterns in AWS spending over time, project future costs, identify areas that need further inquiry, observe Reserved Instance utilization, observe Reserved Instance coverage, and receive Reserved Instance recommendations.
AWS Cost and Usage Report(CUR)– Granular raw data files detailing your hourly AWS usage across accounts used for Do-It-Yourself (DIY) analysis. The AWS Cost and Usage Report has dynamic columns that populate depending on the services you use.
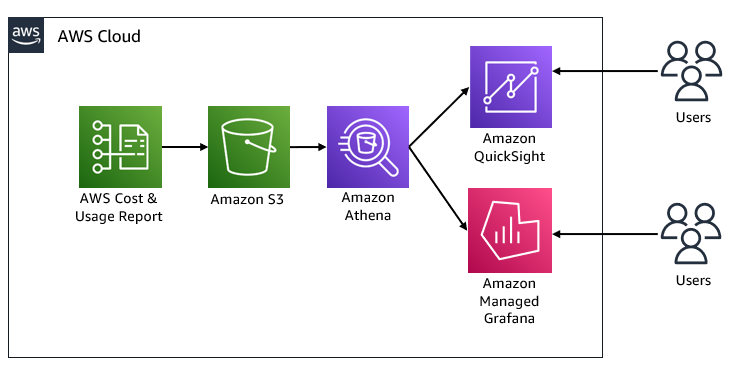
Architecture overview: Visualizing AWS Cost and Usage Report
You can build AWS cost and usage dashboards in Amazon Managed Grafana or Amazon QuickSight. The following architecture diagram illustrates both the solutions.
 Architecture diagram
Cloud Intelligence Dashboards
The Cloud Intelligence Dashboards are a collection of Amazon QuickSight dashboards built on top of AWS Cost and Usage report (CUR). These dashboards work as your own cost management and optimization (FinOps) tool. You get in-depth, granular, and recommendation-driven dashboards that can help you get a detailed view of your AWS usage and costs.
Implementation
-
Create a CUR report with Amazon Athena integration enabled.
During the initial configuration, it can take up to 24 hours for AWS to start delivering reports to your Amazon S3 bucket. Reports are delivered once a day. To streamline and automate integration of your Cost and Usage Reports with Athena, AWS provides an AWS CloudFormation template with several key resources along with the reports that you set up for Athena integration. -
Deploy the AWS CloudFormation template.
This template includes an AWS Glue crawler, an AWS Glue database, and an AWS Lambda event. At this point, CUR data is made available through tables in Amazon Athena for you to query.- Run Amazon Athena queries directly on your CUR data.
To run Athena queries on your data, first use the Athena console to check whether AWS is refreshing your data and then run your query on the Athena console.
- Run Amazon Athena queries directly on your CUR data.
-
Deploy Cloud Intelligence dashboards.
- For manual deployment, refer the AWS Well-Architected Cost Optimization lab.
- For automated deployment, refer the GitHub repo.
Cloud Intelligence dashboards are great for Finance teams, Executives, and IT managers. However, one common question that we get from customers is how to gain insights into organizational wide cost of individual AWS Observability products like Amazon CloudWatch, AWS X-Ray, Amazon Managed Service for Prometheus, and Amazon Managed Grafana.
In the next section, you will dive-deep into cost and usage of each of those products. Companies of any size can adopt this proactive approach to cloud cost optimization strategy and improve business efficiency through cloud cost analytics and data-driven decisions, without any performance impact or operational overhead.