AWS Lambda based Serverless Observability with OpenTelemetry
This guide covers the best practices on configuring observability for Lambda based serverless applications using managed open-source tools and technologies together with the native AWS monitoring services such as AWS X-Ray, and Amazon CloudWatch. We will cover tools such as AWS Distro for OpenTelemetry (ADOT), AWS X-Ray, and Amazon Managed Service for Prometheus (AMP) and how you can use these tools to gain actionable insights into your serverless applications, troubleshoot issues, and optimize application performance.
Key topics covered
In this section of the observability best practices guide, we will deep dive on to following topics:
- Introduction to AWS Distro for OpenTelemetry (ADOT) and ADOT Lambda Layer
- Auto-instrumentation Lambda function using ADOT Lambda Layer
- Custom configuration support for ADOT Collector
- Integration with Amazon Managed Service for Prometheus (AMP)
- Pros and cons of using ADOT Lambda Layer
- Managing cold start latency when using ADOT
Introduction to AWS Distro for OpenTelemetry (ADOT)
AWS Distro for OpenTelemetry (ADOT) is a secure, production-ready, AWS-supported distribution of the Cloud Native Computing Foundation (CNCF) OpenTelemetry (OTel) project. Using ADOT, you can instrument your applications just once and send correlated metrics and traces to multiple monitoring solutions.
AWS's managed OpenTelemetry Lambda Layer utilizes OpenTelemetry Lambda Layer to export telemetry data. It provides plug-and-play user experience by wrapping an AWS Lambda function, and by packaging the OpenTelemetry runtime specific SDK, trimmed down version of ADOT collector together with an out-of-the-box configuration for auto-instrumenting AWS Lambda functions. ADOT Lambda Layer collector components, such as Receivers, Exporters, and Extensions support integration with Amazon CloudWatch, Amazon OpenSearch Service, Amazon Managed Service for Prometheus, AWS X-Ray, and others. Find the complete list here. ADOT also supports integrations with partner solutions.
ADOT Lambda Layer supports both auto-instrumentation (for Python, NodeJS, and Java) as well as custom instrumentation for any specific set of libraries and SDKs. With auto-instrumentation, by default, the Lambda Layer is configured to export traces to AWS X-Ray. For custom instrumentation, you will need to include the corresponding library instrumentation from the respective OpenTelemetry runtime instrumentation repository and modify your code to initialize it in your function.
Auto-instrumentation using ADOT Lambda Layer with AWS Lambda
You can easily enable auto-instrumentation of Lambda function using ADOT Lambda Layer without any code changes. Let’s take an example of adding ADOT Lambda layer to your existing Java based Lambda function and view execution logs and traces in CloudWatch.
- Choose the ARN of the Lambda Layer based on the
runtime,regionand thearch typeas per the documentation. Make sure you use the Lambda Layer in the same region as your Lambda function. For example, Lambda Layer for java auto-instrumentation would bearn:aws:lambda:us-east-1:901920570463:layer:aws-otel-java-agent-x86_64-ver-1-28-1:1 - Add Layer to your Lambda function either via Console of IaC of your choice.
- With AWS Console, follow the instructions to add Layer to your Lambda function. Under Specify an ARN paste the layer ARN selected above.
- With IaC option, SAM template for Lambda function would look like this:
Layers:
- !Sub arn:aws:lambda:${AWS::Region}:901920570463:layer:aws-otel-java-agent-arm64-ver-1-28-1:1 - Add an environment variable
AWS_LAMBDA_EXEC_WRAPPER=/opt/otel-handlerfor Node.js or Java, andAWS_LAMBDA_EXEC_WRAPPER=/opt/otel-instrumentfor Python to your Lambda function. - Enable Active Tracing for your Lambda function.
Notethat by default, the layer is configured to export traces to AWS X-Ray. Make sure your Lambda function’s execution role has the required AWS X-Ray permissions. For more on AWS X-Ray permissions for AWS Lambda, see the AWS Lambda documentation.Tracing: Active
- Example SAM template with Lambda Layer configuration, Environment Variable, and X-Ray tracing would look something like this:
Resources:
  ListBucketsFunction:
    Type: AWS::Serverless::Function
    Properties:
      Handler: com.example.App::handleRequest
      ...
      ProvisionedConcurrencyConfig:
        ProvisionedConcurrentExecutions: 1
      Policies:
        - AWSXrayWriteOnlyAccess
        - AmazonS3ReadOnlyAccess
      Environment:
        Variables:
          AWS_LAMBDA_EXEC_WRAPPER: /opt/otel-handler
      Tracing: Active
      Layers:
        - !Sub arn:aws:lambda:${AWS::Region}:901920570463:layer:aws-otel-java-agent-amd64-ver-1-28-1:1
      Events:
        HelloWorld:
          Type: Api
          Properties:
            Path: /listBuckets
            Method: get
- Testing and Visualizing traces in AWS X-Ray
Invoke your Lambda function either directly or via an API (if an API is configured as a trigger). For example, invoking Lambda function via API (using
curl) would generate logs as below:
curl -X GET https://XXXXXX.execute-api.us-east-1.amazonaws.com/Prod/listBuckets
Lambda function logs:
OpenJDK 64-Bit Server VM warning: Sharing is only supported for boot loader classes because bootstrap classpath has been appended
[otel.javaagent 2023-09-24 15:28:16:862 +0000] [main] INFO io.opentelemetry.javaagent.tooling.VersionLogger - opentelemetry-javaagent - version: 1.28.0-adot-lambda1-aws
EXTENSION Name: collector State: Ready Events: [INVOKE, SHUTDOWN]
START RequestId: ed8f8444-3c29-40fe-a4a1-aca7af8cd940 Version: 3
...
END RequestId: ed8f8444-3c29-40fe-a4a1-aca7af8cd940
REPORT RequestId: ed8f8444-3c29-40fe-a4a1-aca7af8cd940 Duration: 5144.38 ms Billed Duration: 5145 ms Memory Size: 1024 MB Max Memory Used: 345 MB Init Duration: 27769.64 ms
XRAY TraceId: 1-65105691-384f7da75714148655fa631b SegmentId: 2c52a147021ebd20 Sampled: true
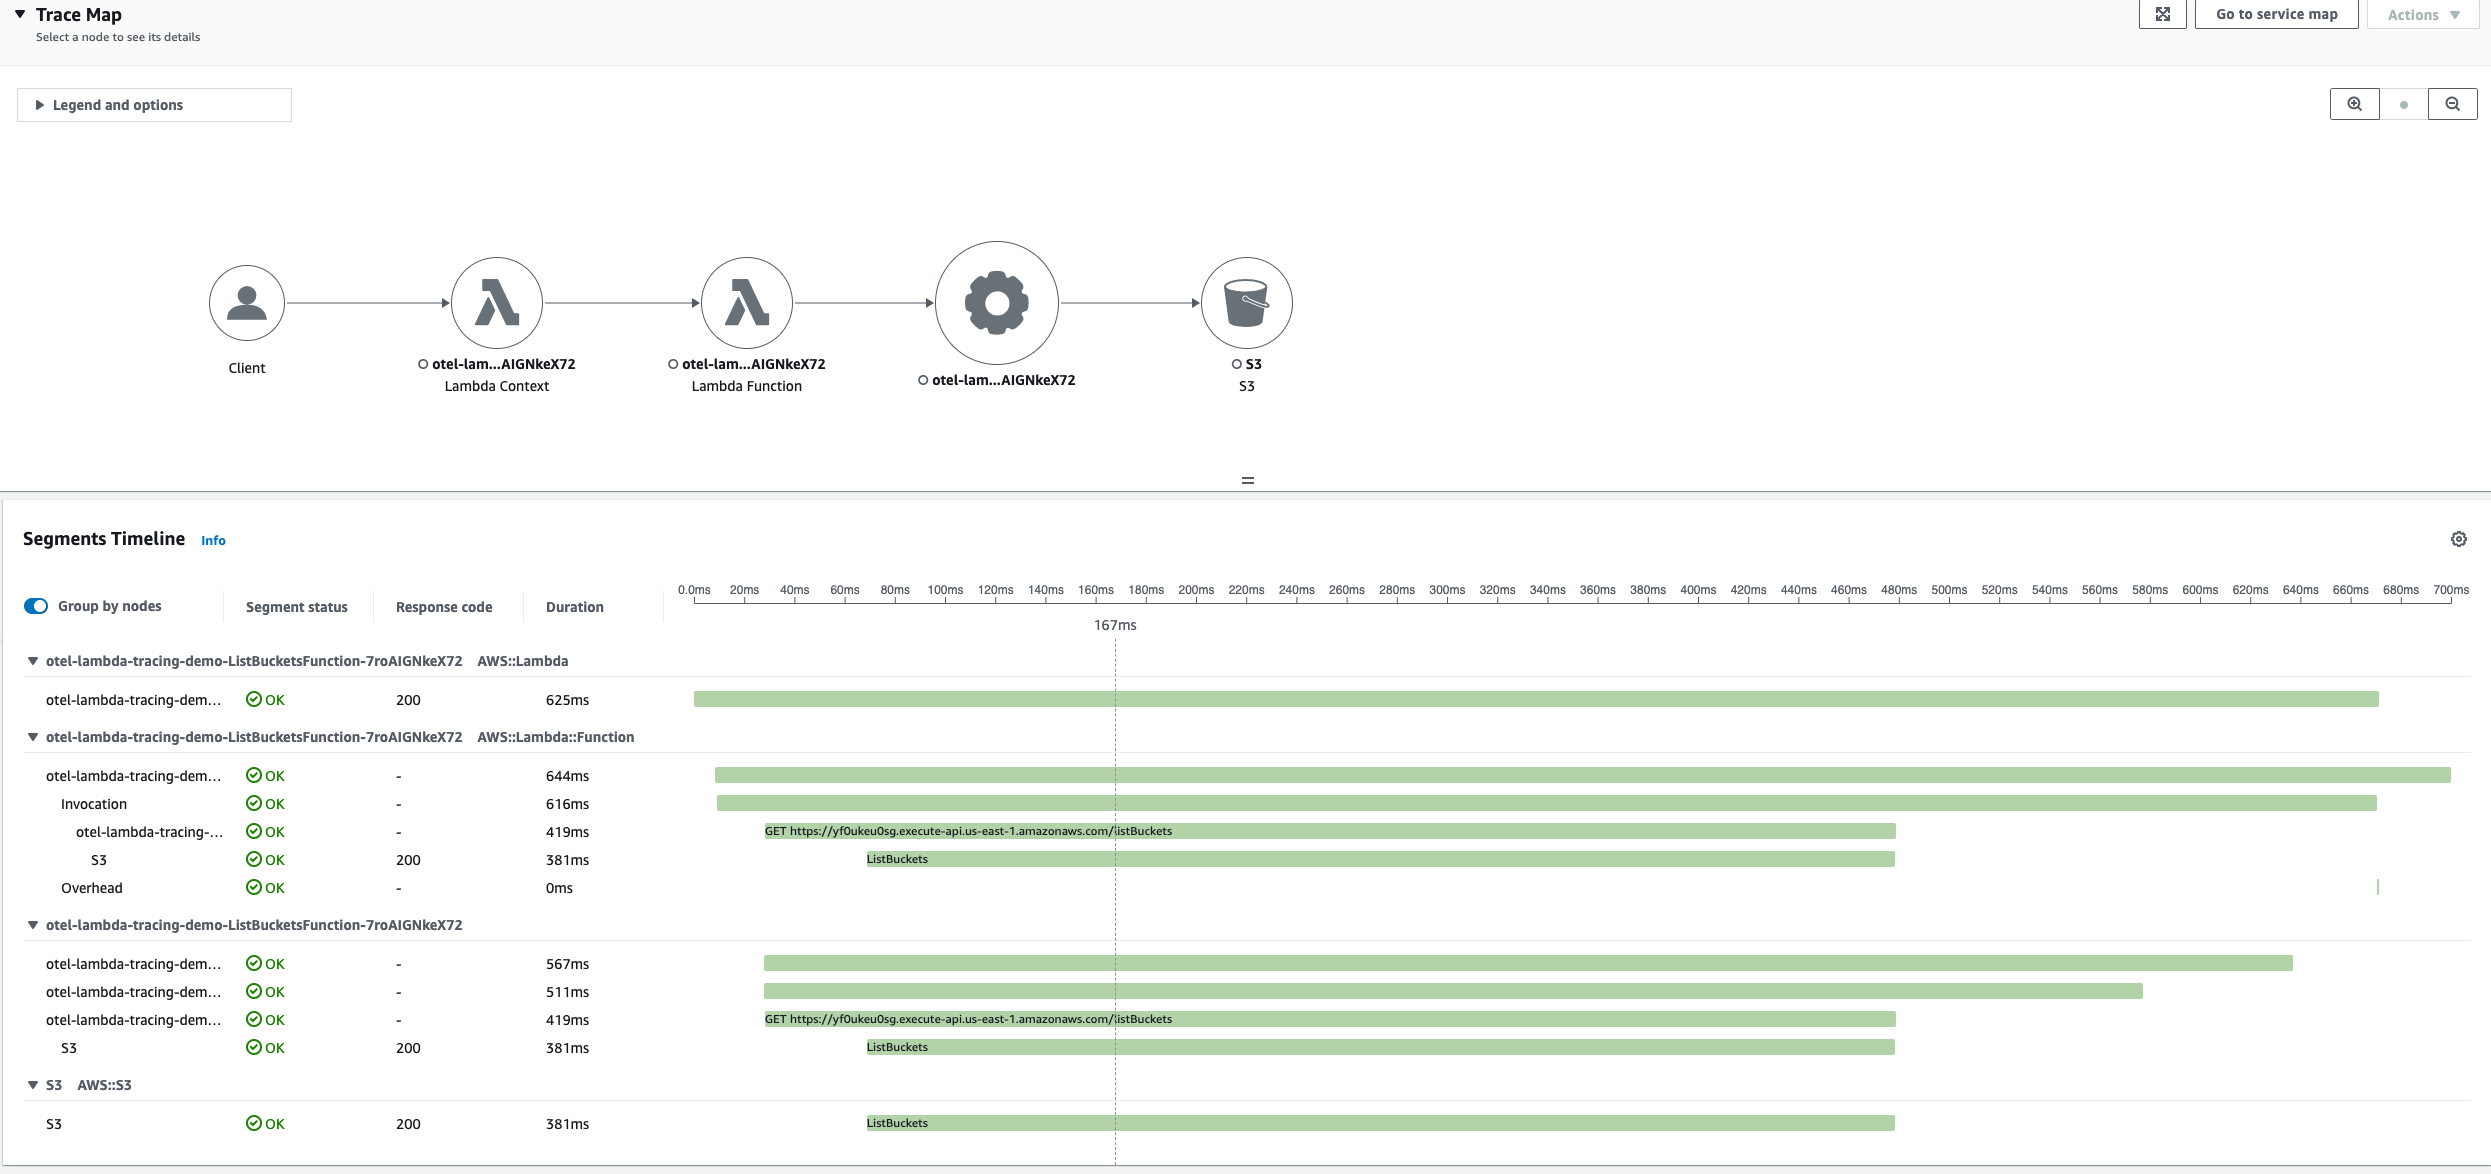
As you can see from the logs, OpenTelemetry Lambda extension starts listening and instrumenting Lambda functions using opentelemetry-javaagent and generates traces in AWS X-Ray.
To view the traces from the above Lambda function invocation, navigate to the AWS X-Ray console and select the trace id under Traces. You should see a Trace Map along with Segments Timeline as below:
Custom configuration support for ADOT Collector
The ADOT Lambda Layer combines both OpenTelemetry SDK and the ADOT Collector components. The configuration of the ADOT Collector follows the OpenTelemetry standard. By default, the ADOT Lambda Layer uses config.yaml, which exports telemetry data to AWS X-Ray. However, ADOT Lambda Layer also supports other exporters, which enables you to send metrics and traces to other destinations. Find the complete list of available components supported for custom configuration here.
Integration with Amazon Managed Service for Prometheus (AMP)
You can use custom collector configuration to export metrics from your Lambda function to Amazon Managed Prometheus (AMP).
- Follow the steps from auto-instrumentation above, to configure Lambda Layer, set Environment variable
AWS_LAMBDA_EXEC_WRAPPER. - Follow the instructions to create Amazon Manager Prometheus workspace in your AWS account, where your Lambda function will be sending metrics to. Make a note of the
Endpoint - remote write URLfrom the AMP workspace. You would need that to be configured on ADOT collector configuration. - Create a custom ADOT collector configuration file (say
collector.yaml) in your Lambda function's root directory with details of AMP endpoint remote write URL from previous step. You can also load the configuration file from S3 bucket. Sample ADOT collector configuration file:
#collector.yaml in the root directory
#Set an environemnt variable 'OPENTELEMETRY_COLLECTOR_CONFIG_FILE' to '/var/task/collector.yaml'

extensions:
  sigv4auth:
    service: "aps"
    region: "<workspace_region>"

receivers:
  otlp:
    protocols:
      grpc:
      http:

exporters:
  logging:
  prometheusremotewrite:
    endpoint: "<workspace_remote_write_url>"
    namespace: test
    auth:
      authenticator: sigv4auth

service:
  extensions: [sigv4auth]
  pipelines:
    traces:
      receivers: [otlp]
      exporters: [awsxray]
    metrics:
      receivers: [otlp]
      exporters: [logging, prometheusremotewrite]
Prometheus Remote Write Exporter can also be configured with retry, and timeout settings. For more information see the documentation. Note Service value for sigv4auth extension should be aps (amazon prometheus service). Also, Make sure your Lambda function execution role has the required AMP permissions. For more information on permissions and policies required on AMP for AWS Lambda, see the AWS Managed Service for Prometheus documentation.
- Add an environment variable
OPENTELEMETRY_COLLECTOR_CONFIG_FILEand set value to the path of configuration file. E.g. /var/task/<path to config file>.yaml. This will tell the Lambda Layer extension where to find the collector configuration.
Function:
    Type: AWS::Serverless::Function
    Properties:
      ...
      Environment:
        Variables:
          OPENTELEMETRY_COLLECTOR_CONFIG_FILE: /var/task/collector.yaml
- Update your Lambda function code to add metrics using OpenTelemetry Metrics API. Check out examples here.
// get meter
Meter meter = GlobalOpenTelemetry.getMeterProvider()
    .meterBuilder("aws-otel")
    .setInstrumentationVersion("1.0")
    .build();

// Build counter e.g. LongCounter
LongCounter counter = meter
    .counterBuilder("processed_jobs")
    .setDescription("Processed jobs")
    .setUnit("1")
    .build();

// It is recommended that the API user keep a reference to Attributes they will record against
Attributes attributes = Attributes.of(stringKey("Key"), "SomeWork");

// Record data
counter.add(123, attributes);
Pros and Cons of using ADOT Lambda Layer
If you intend to send traces to AWS X-Ray from Lambda function, you can either use X-Ray SDK or AWS Distro for OpenTelemetry (ADOT) Lambda Layer. While X-Ray SDK supports easy instrumentation of various AWS services, it can only send traces to X-Ray. Whereas, ADOT collector, which is included as part of the Lambda Layer supports large number of library instrumentations for each language. You can use it to collect and send metrics and traces to AWS X-Ray and other monitoring solutions, such as Amazon CloudWatch, Amazon OpenSearch Service, Amazon Managed Service for Prometheus and other partner solutions.
However, due to the flexibility ADOT offers, your Lambda function may require additional memory and can experience notable impact on cold start latency. So, if you are optimizing your Lambda function for low-latency and do not need advanced features of OpenTelemetry, using AWS X-Ray SDK over ADOT might be more suitable. For detailed comparison and guidance on choosing the right tracing tool, refer to AWS docs on choosing between ADOT and X-Ray SDK.
Managing cold start latency when using ADOT
ADOT Lambda Layer for Java is agent-based, which means that when you enable auto-instrumentation, Java Agent will try to instrument all the OTel supported libraries. This will increase the Lambda function cold start latency significantly. So, we recommend that you only enable auto-instrumentation for the libraries/frameworks that are used by your application.
To enable only specific instrumentations, you can use the following environment variables:
OTEL_INSTRUMENTATION_COMMON_DEFAULT_ENABLED: when set to false, disables auto-instrumentation in the Layer, requiring each instrumentation to be enabled individually.OTEL_INSTRUMENTATION_<NAME>_ENABLED: set to true to enable auto-instrumentation for a specific library or framework. Replace "NAME" by the instrumentation that you want to enable. For the list of available instrumentations, see Suppressing specific agent instrumentation.
For example, to only enable auto-instrumentation for Lambda and the AWS SDK, you would set the following environment variables:
OTEL_INSTRUMENTATION_COMMON_DEFAULT_ENABLED=false
OTEL_INSTRUMENTATION_AWS_LAMBDA_ENABLED=true
OTEL_INSTRUMENTATION_AWS_SDK_ENABLED=true
Additional Resources
Summary
In this observability best practice guide for AWS Lambda based serverless application using Open Source technologies, we covered AWS Distro for OpenTelemetry (ADOT) and Lambda Layer and how you can use it instrument your AWS Lambda functions. We covered how you can easily enable auto-instrumentation as well as customize the ADOT collector with simple configuration to send observability signals to multiple destinations. We highlighted pros and cons of using ADOT and how it can impact cold start latency for your Lambda function and also recommended best practices to manage cold-start times. By adopting these best practices, you can instrument your applications just once to send logs, metrics and traces to multiple monitoring solutions in a vendor agnostic way.
For further deep dive, we would highly recommend you to practice AWS managed open-source Observability module of AWS One Observability Workshop.