Using Redshift in Amazon Managed Grafana
In this recipe we show you how to use Amazon Redshift—a petabyte-scale data warehouse service using standard SQL—in Amazon Managed Grafana. This integration is enabled by the Redshift data source for Grafana, an open source plugin available for you to use in any DIY Grafana instance as well as pre-installed in Amazon Managed Grafana.
This guide will take approximately 10 minutes to complete.
Prerequisites
- You have admin access to Amazon Redshift from your account.
- Tag your Amazon Redshift cluster with
GrafanaDataSource: true. - In order to benefit from the service-managed policies, create the database
credentials in one of the following ways:
- If you want to use the default mechanism, that is, the temporary credentials
option, to authenticate against the Redshift database, you must create a database
user named
redshift_data_api_user. - If you want to use the credentials from Secrets Manager, you must tag the
secret with
RedshiftQueryOwner: true.
- If you want to use the default mechanism, that is, the temporary credentials
option, to authenticate against the Redshift database, you must create a database
user named
For more information on how to work with the service-managed or custom policies, see the examples in the Amazon Managed Grafana docs.
Infrastructure
We need a Grafana instance, so go ahead and set up a new Amazon Managed Grafana workspace, for example by using the Getting Started guide, or use an existing one.
To use AWS data source configuration, first go to the Amazon Managed Grafana console to enable service-mananged IAM roles that grant the workspace the IAM policies necessary to read the Athena resources.
To set up the Athena data source, use the left-hand toolbar and choose the lower AWS icon and then choose "Redshift". Select your default region you want the plugin to discover the Redshift data source to use, and then select the accounts that you want, and finally choose "Add data source".
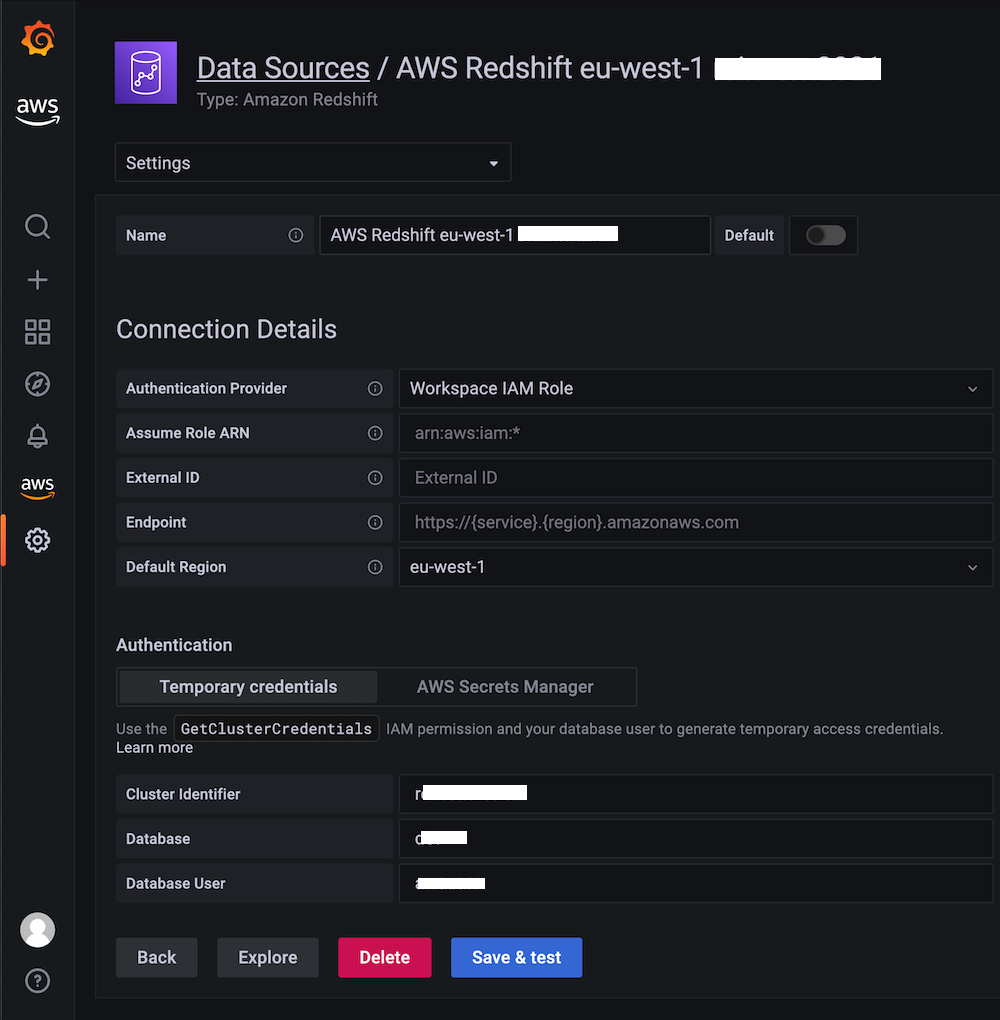
Alternatively, you can manually add and configure the Redshift data source by following these steps:
- Click on the "Configurations" icon on the left-hand toolbar and then on "Add data source".
- Search for "Redshift".
- [OPTIONAL] Configure the authentication provider (recommended: workspace IAM role).
- Provide the "Cluster Identifier", "Database", and "Database User" values.
- Click "Save & test".
You should see something like the following:
Usage
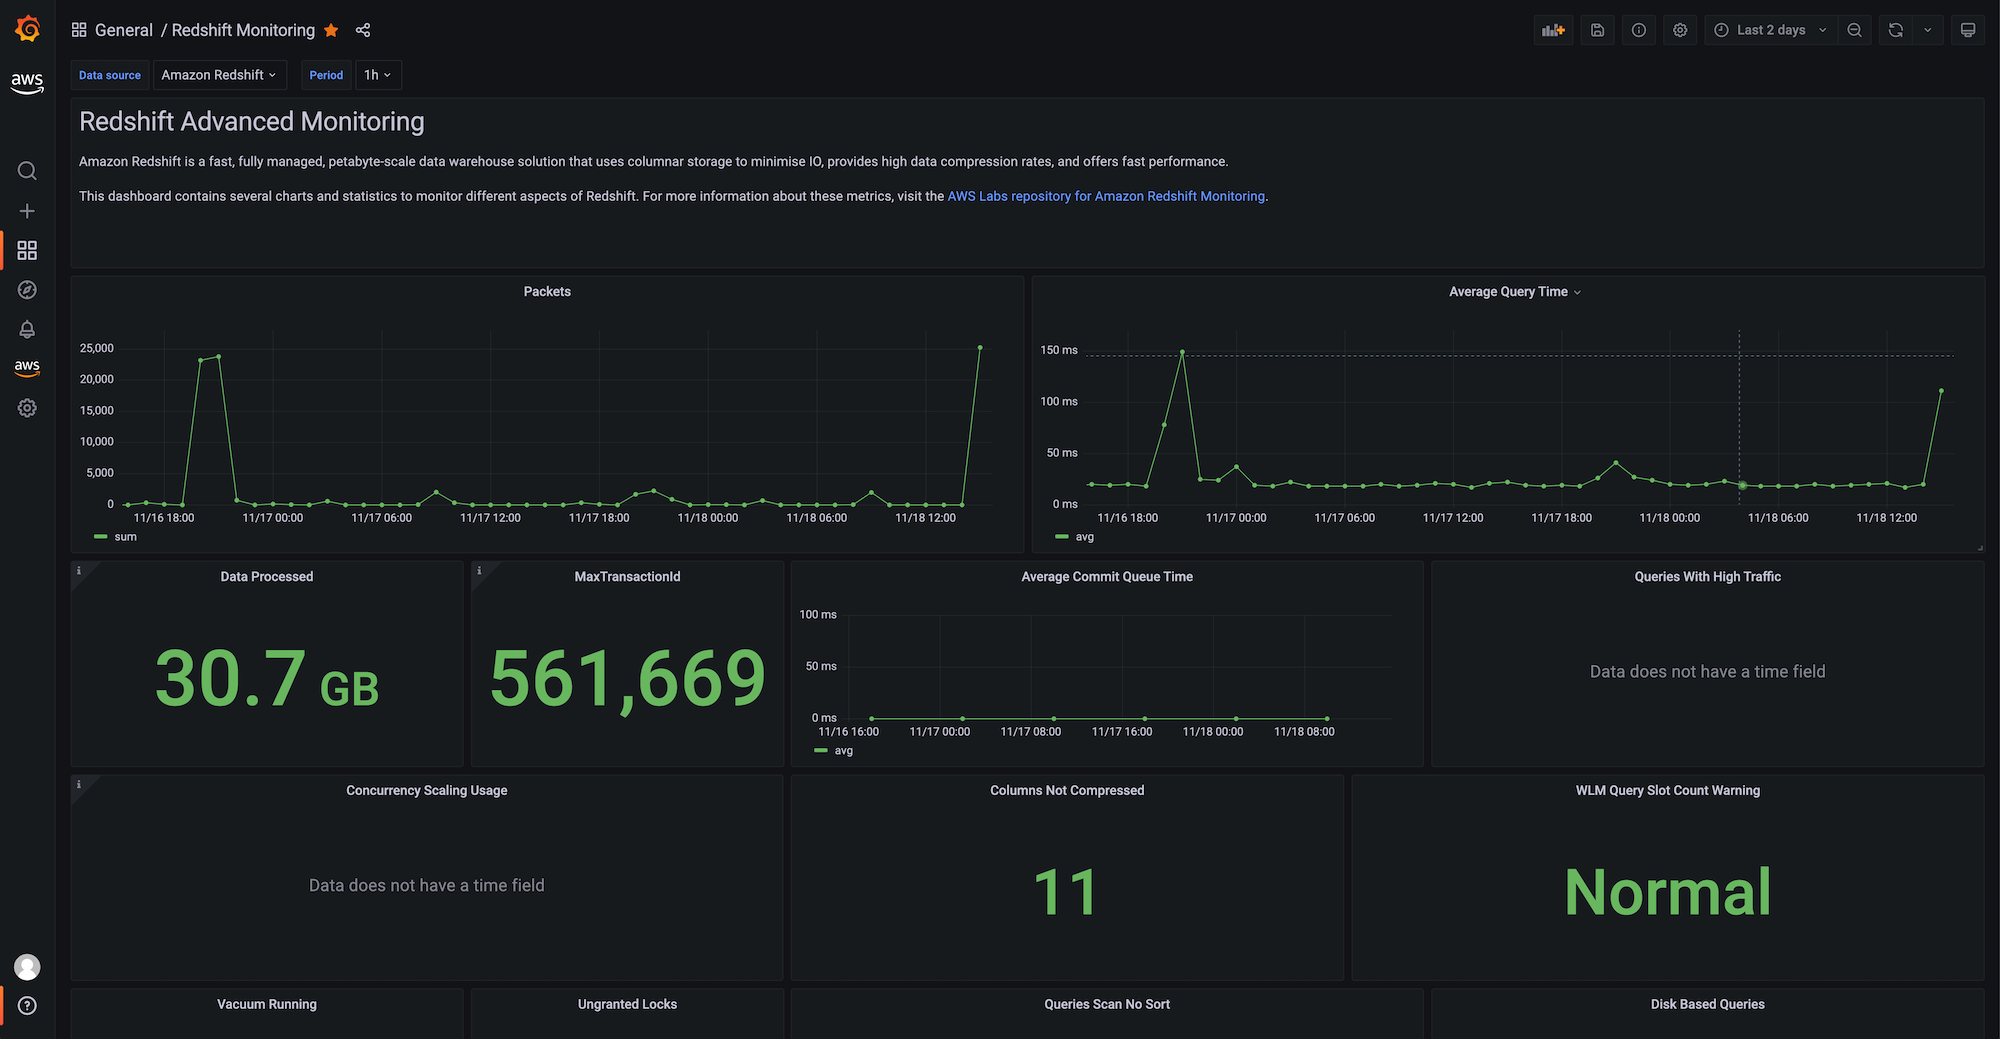
We will be using the Redshift Advance Monitoring setup. Since all is available out of the box, there's nothing else to configure at this point.
You can import the Redshift monitoring dashboard, included in the Redshift plugin. Once imported you should see something like this:
From here, you can use the following guides to create your own dashboard in Amazon Managed Grafana:
That's it, congratulations you've learned how to use Redshift from Grafana!
Cleanup
Remove the Redshift database you've been using and then the Amazon Managed Grafana workspace by removing it from the console.