Using Amazon CloudWatch Metrics explorer to aggregate and visualize metrics filtered by resource tags
In this recipe we show you how to use Metrics explorer to filter, aggregate, and visualize metrics by resource tags and resource properties - Use metrics explorer to monitor resources by their tags and properties.
There are number of ways to create visualizations with Metrics explorer; in this walkthrough we simply leverage the AWS Console.
This guide will take approximately 5 minutes to complete.
Prerequisites
- Access to AWS account
- Access to Amazon CloudWatch Metrics explorer via AWS Console
- Resource tags set for the relevant resources
Metrics Explorer tag based queries and visualizations
-
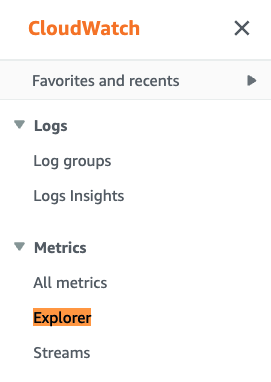
Open the CloudWatch console
-
Under Metrics, click on the Explorer menu
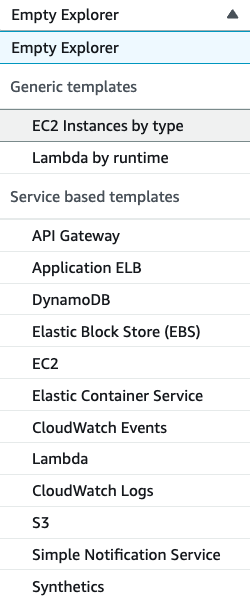
- You can either choose from one of the Generic templates or a Service based templates list; in this example we use the EC2 Instances by type template
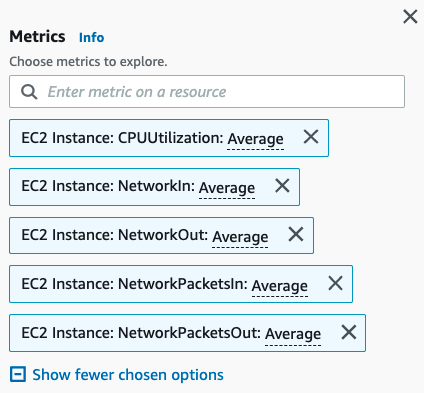
- Choose metrics you would like to explore; remove obsolete once, and add other metrics you would like to see
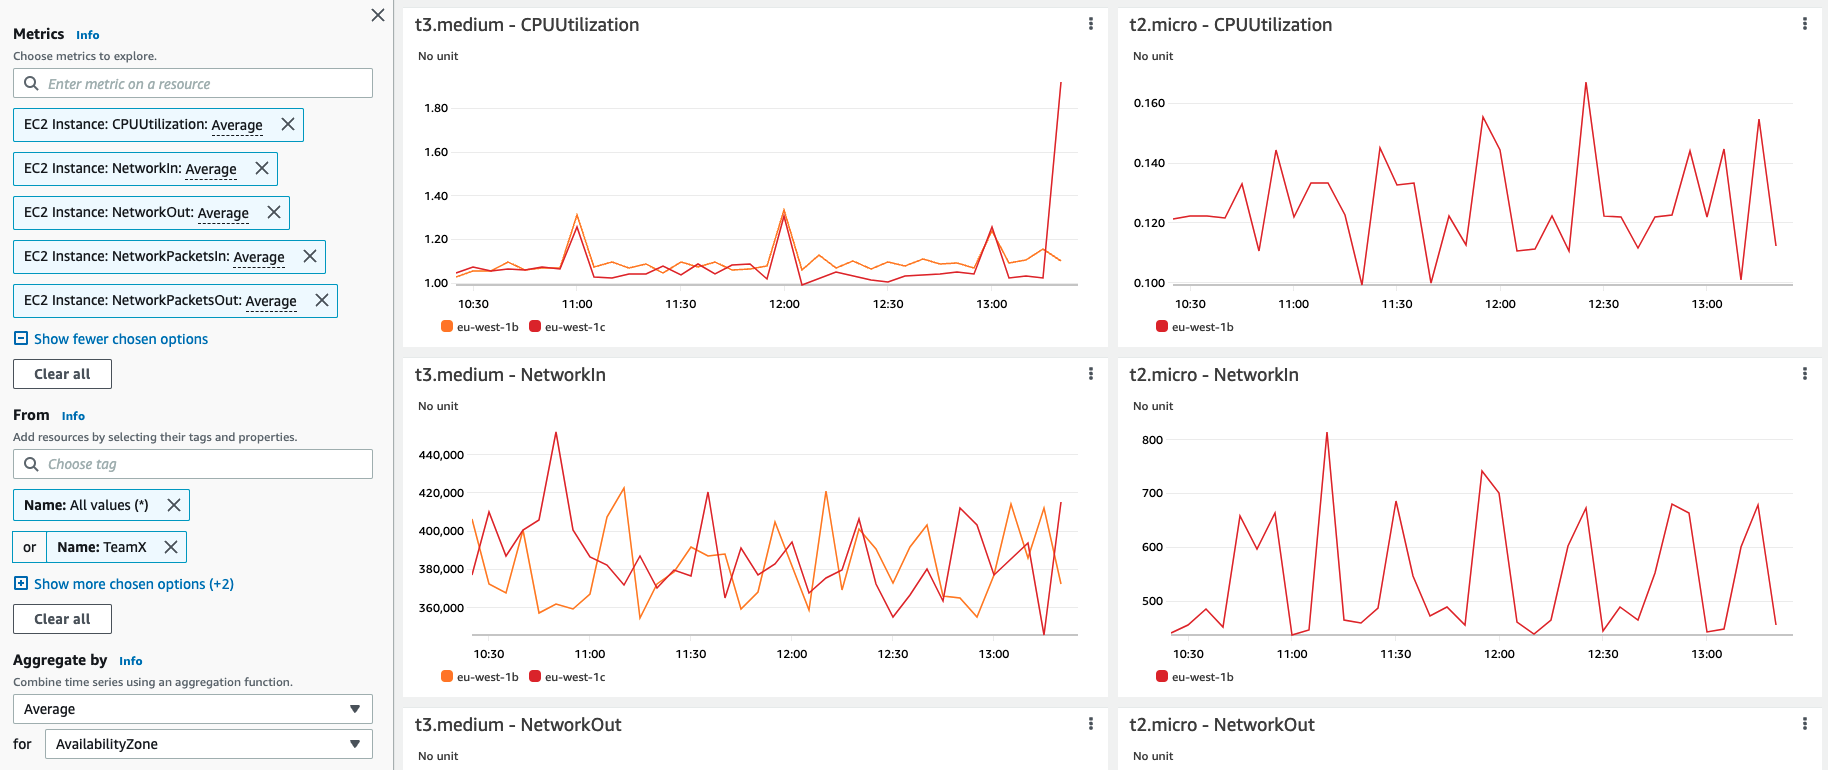
- Under From, choose a resource tag or a resource property you are looking for; in the below example we show number of CPU and Network related metrics for different EC2 instances with Name: TeamX Tag
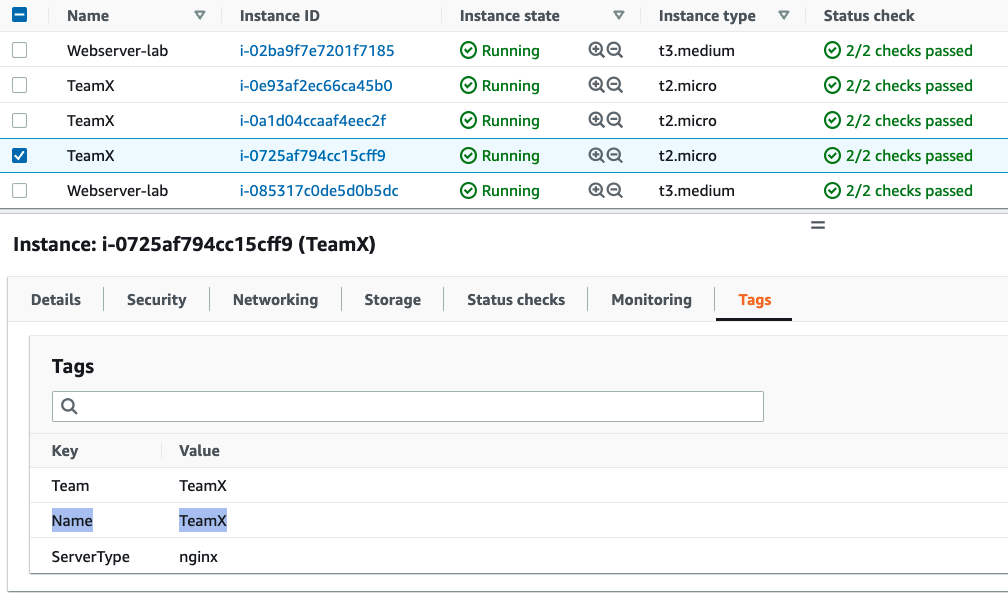
- Please note, you can combine time series using an aggregation function under Aggregated by; in the below example TeamX metrics are aggregated by Availability Zone
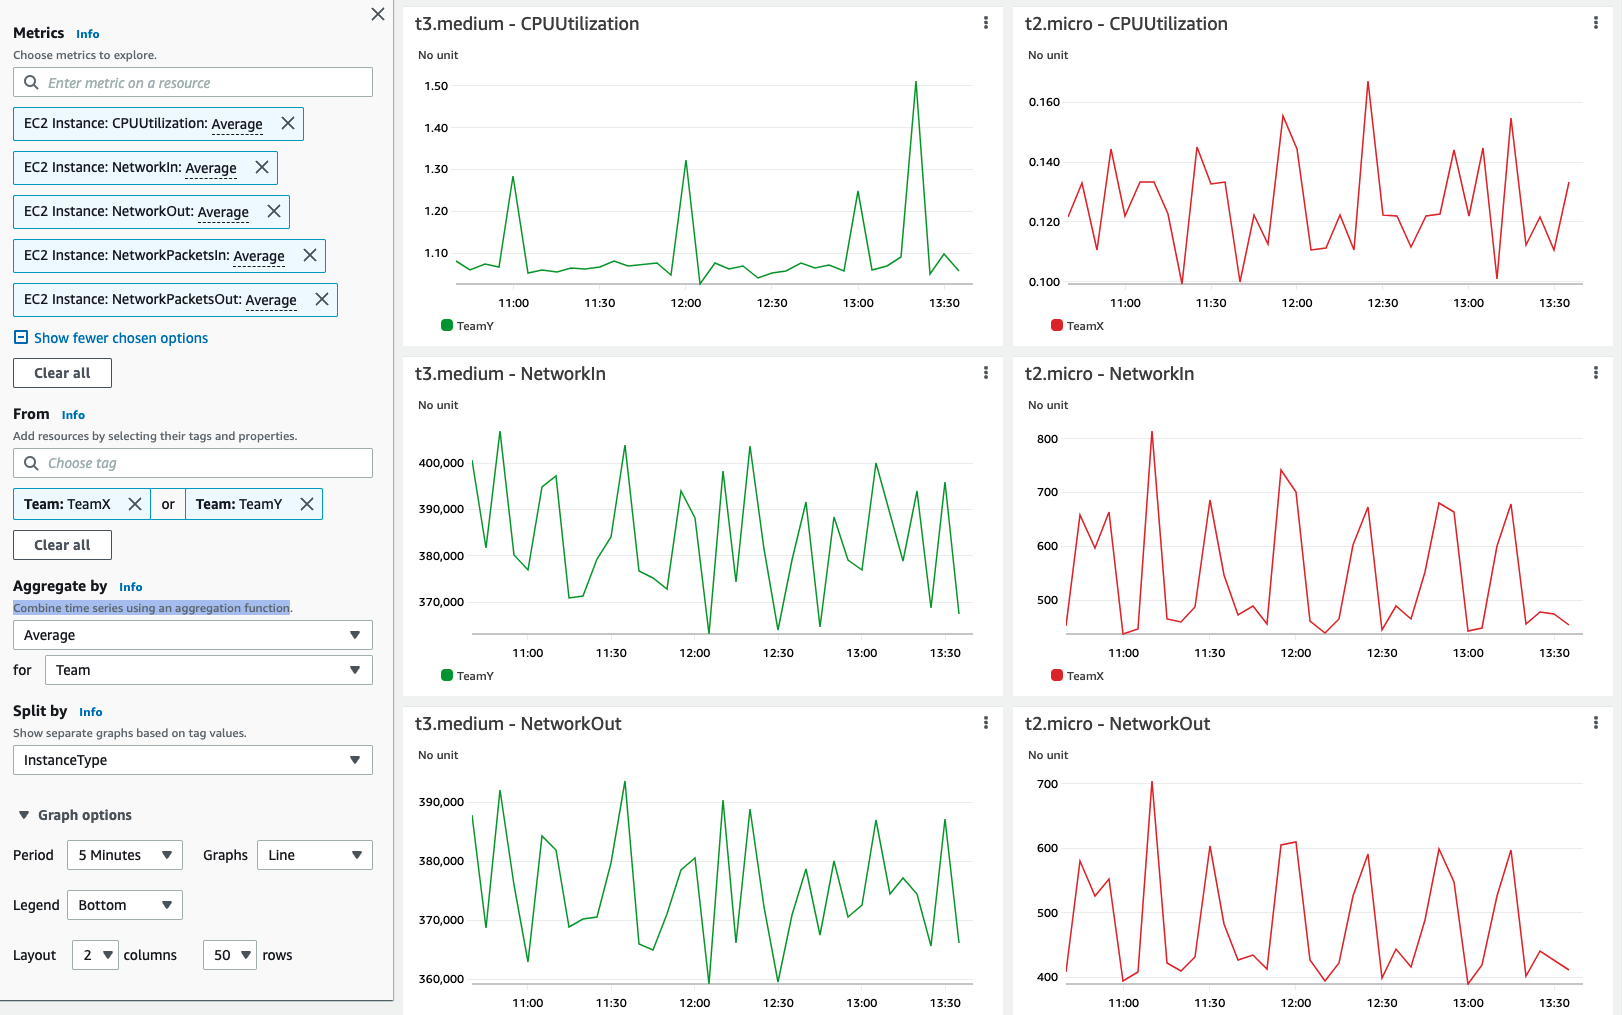
Alternatively, you could aggregate TeamX and TeamY by the Team Tag, or choose any other configuration that suits your needs
Dynamic visualizations
You can easily customize resulting visualizations by using From, Aggregated by and Split by options. Metrics explorer visualizations are dynamic, so any new tagged resource automatically appears in the explorer widget.
Reference
For more information on Metrics explorer please refer to the following article: https://docs.aws.amazon.com/AmazonCloudWatch/latest/monitoring/CloudWatch-Metrics-Explorer.html