Introducing Amazon CloudWatch Omni
Overview
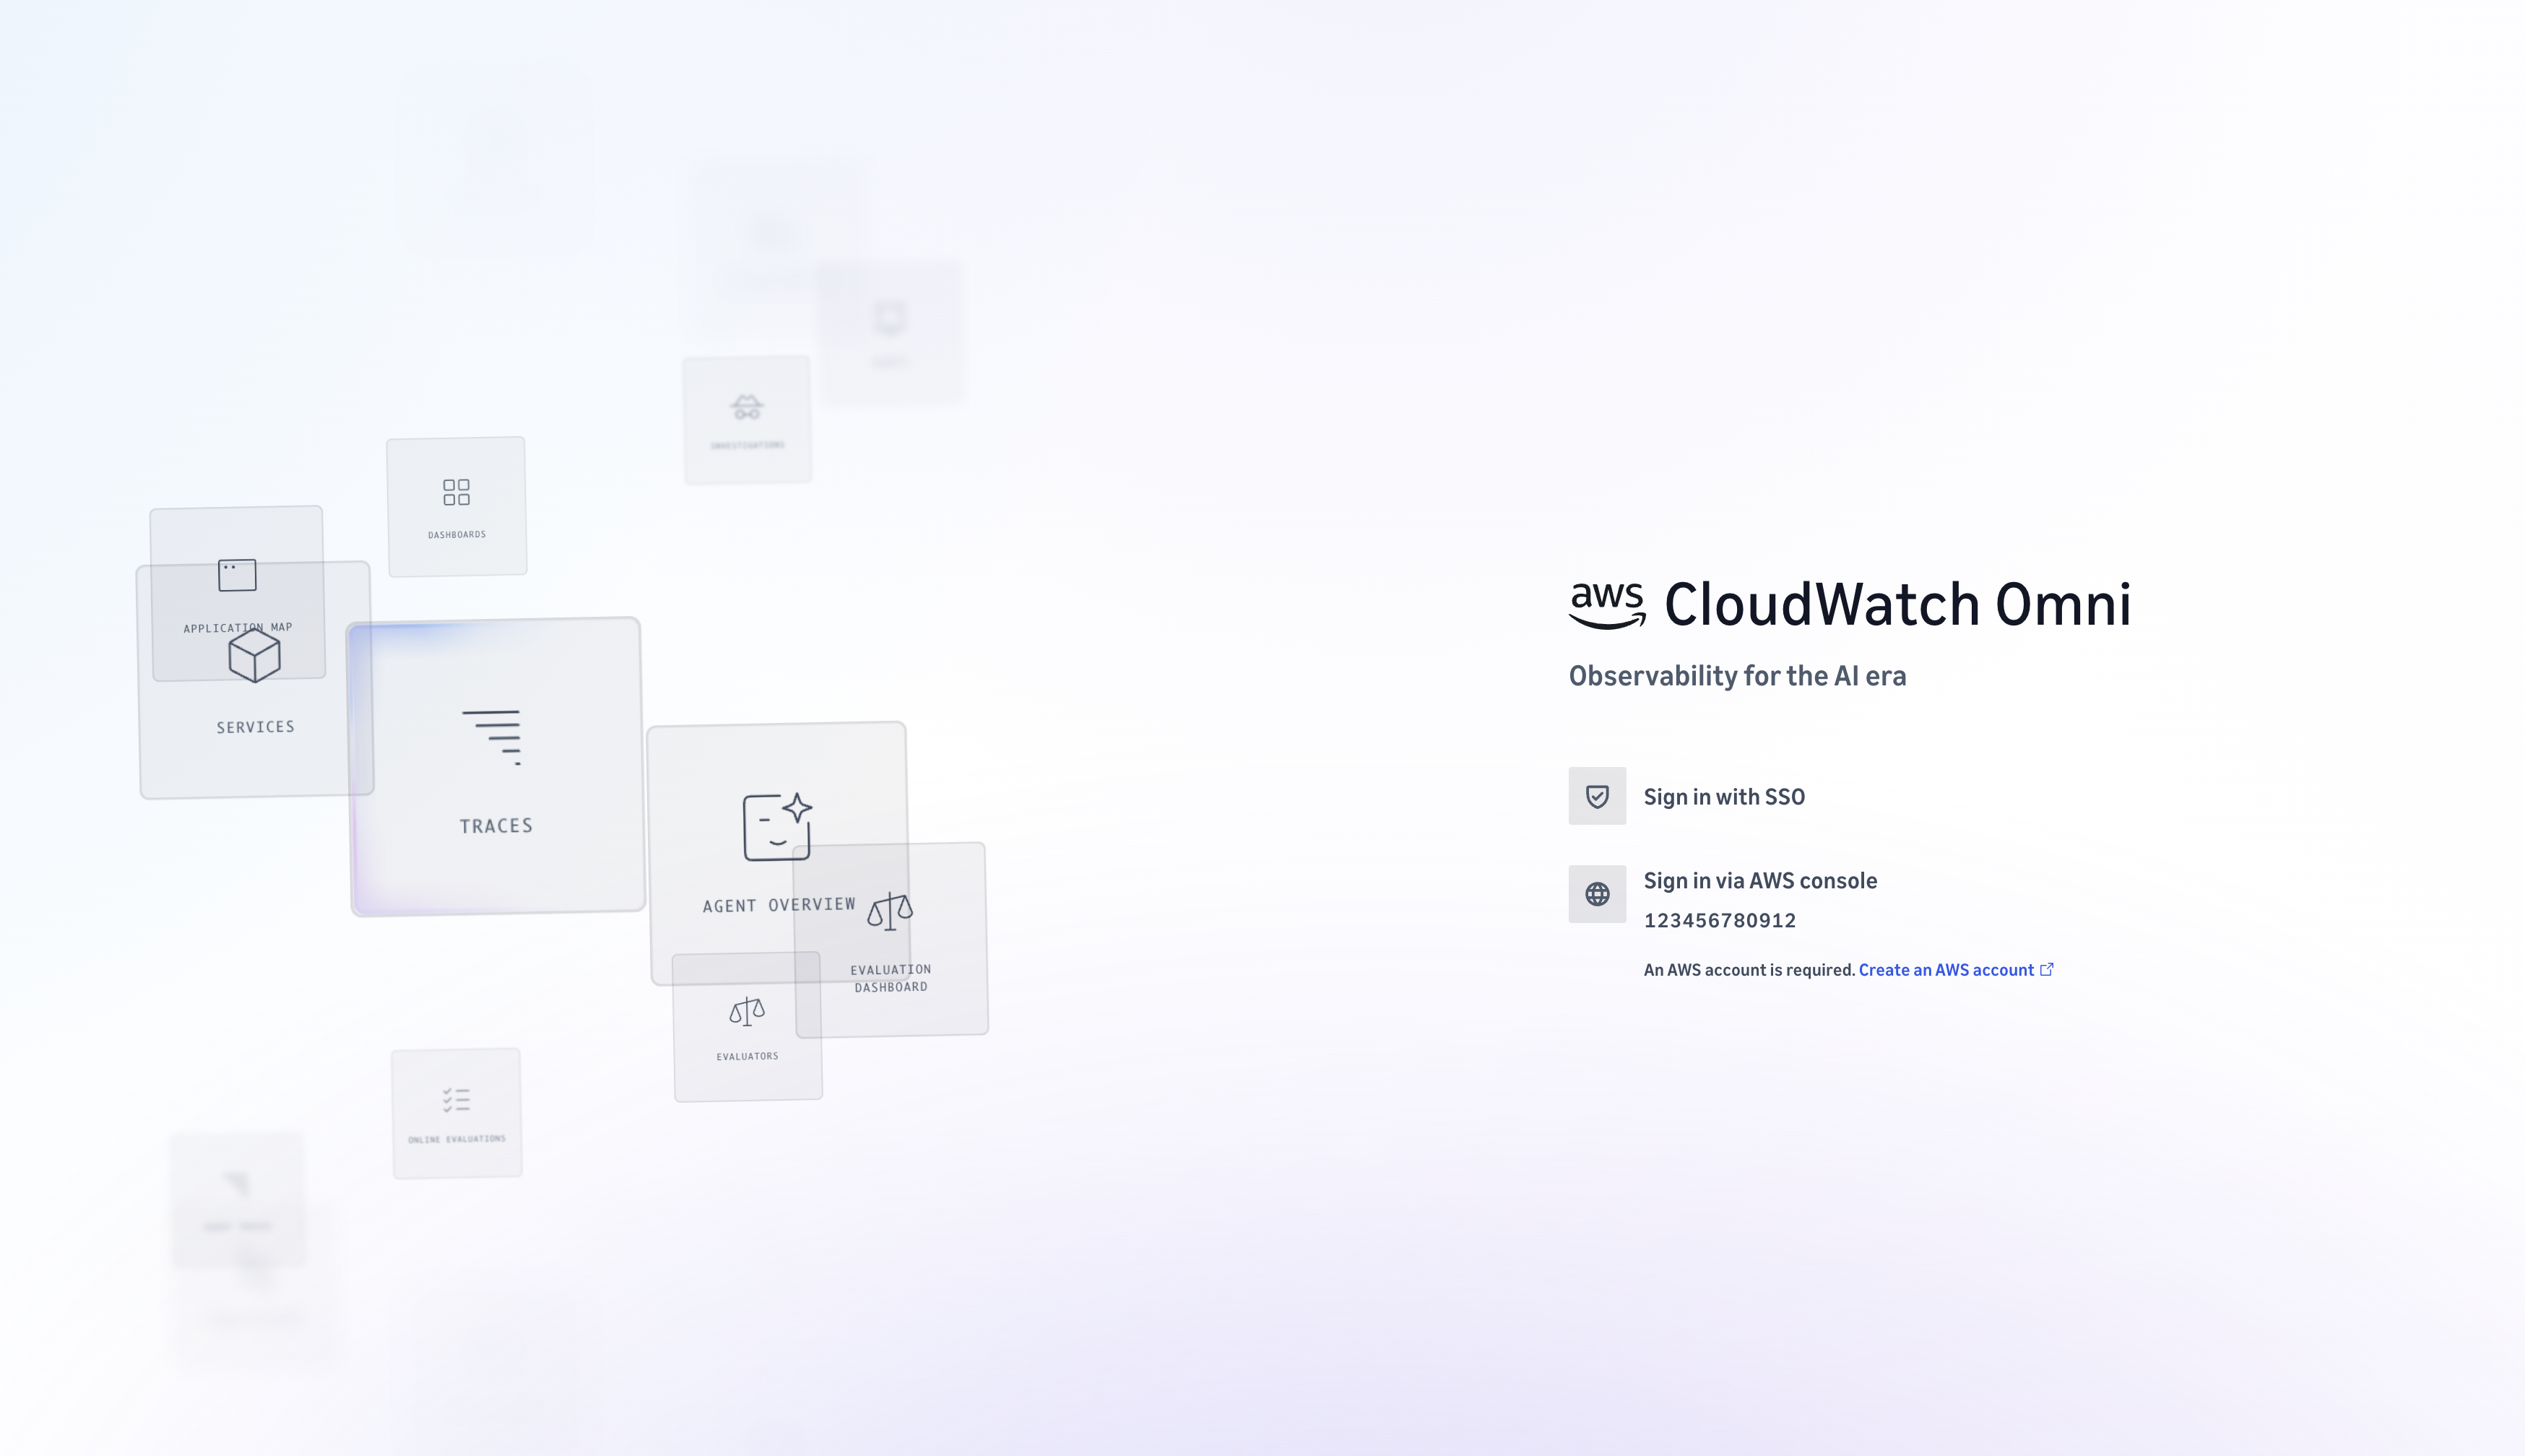
The CloudWatch Omni experience — AI agents, applications, and infrastructure in one off-console view.
Amazon CloudWatch Omni is the next generation of Amazon CloudWatch: a re-imagined observability experience that is AI-powered, built on open standards, and delivered outside the AWS Console. Purpose-built for the AI era, CloudWatch Omni unifies monitoring of AI agents, applications, and infrastructure in a single solution.
Omni is delivered both as a standalone web UI for operators and as native IDE extensions for developers, so agent traces show up the moment code runs locally. It is built on OpenTelemetry: the telemetry you already send to CloudWatch appears in Omni with nothing to reconfigure, and any other workload you instrument with OpenTelemetry sends its telemetry to an OpenTelemetry Protocol (OTLP) endpoint.
Because Omni sits on the CloudWatch unified data store, it connects agent behavior to application health to infrastructure — so you can find the real root cause, whether it is the agent's reasoning, a stale knowledge base, or a downstream latency spike.
When to use this
Select a scenario to see how CloudWatch Omni fits.
You need to know why your AI agent did something, not just whether it is running.
Omni brings eval-driven observability to agents — observe behavior, evaluate quality continuously, and validate fixes before they ship, across Strands, CrewAI, LangGraph, the OpenAI Agents SDK, and the Vercel AI SDK.
You want one place to observe AI agents, applications, and infrastructure.
Omni unifies all three in a single experience built on the CloudWatch unified data store, so you can move from agent behavior to application health to infrastructure without switching tools.
You already send telemetry to CloudWatch and want an AI-first experience on top of it.
The telemetry you already send to CloudWatch appears in Omni with nothing to reconfigure, and every investigation starts from a plain-language question rather than a dashboard you built and maintained.
You instrument workloads with OpenTelemetry and want a vendor-neutral ingestion path.
Omni is built on OpenTelemetry. Any workload you instrument sends its telemetry to an OpenTelemetry Protocol (OTLP) endpoint — no proprietary agent required.
You need to correlate signals across multiple accounts, regions, and clouds.
Omni ingests agent and application telemetry from multiple AWS accounts and regions, and from multi-cloud sources — starting with Azure today.
Your developers want observability inside the IDE, alongside a web experience for operators.
Operators get an off-console web experience; developers get native IDE extensions for VS Code, Kiro, and Cursor, so agent traces show up the moment code runs locally.
Guidance
Amazon CloudWatch Omni rests on five capabilities. Step through them to see what each delivers, why it matters, and the trade-off if you skip it.
Ship agents you can trust
Eval-driven observability, not just uptime
Omni observes agent behavior, evaluates quality continuously, and lets you validate fixes before they ship — across Strands, CrewAI, LangGraph, the OpenAI Agents SDK, and the Vercel AI SDK.
Agents are non-deterministic. "Is it running?" is not the same question as "is it doing the right thing?" Continuous evaluation catches quality regressions that uptime monitoring misses.
You find out about a bad agent from your customers rather than from your telemetry.
Choose the interface that fits the role
CloudWatch Omni meets operators and developers where they work.
- Operators (Web UI)
- Developers (IDE)
Access Omni through an off-console web experience built for operators: Omni spaces, application map, services, dashboards, alerts, evaluation dashboards, and guided investigations — all outside the AWS Console.
Use native IDE extensions for VS Code, Kiro, and Cursor. Agent traces show up the moment code runs locally, so developers can observe and evaluate agent behavior without leaving the editor.
Why it matters: the person debugging an agent locally and the person triaging a production incident need different surfaces over the same data. The trade-off with a single interface: one of those two audiences is always working against the grain.
Sample applications to get started
Two reference applications are useful for exploring Omni before pointing it at your own workloads.
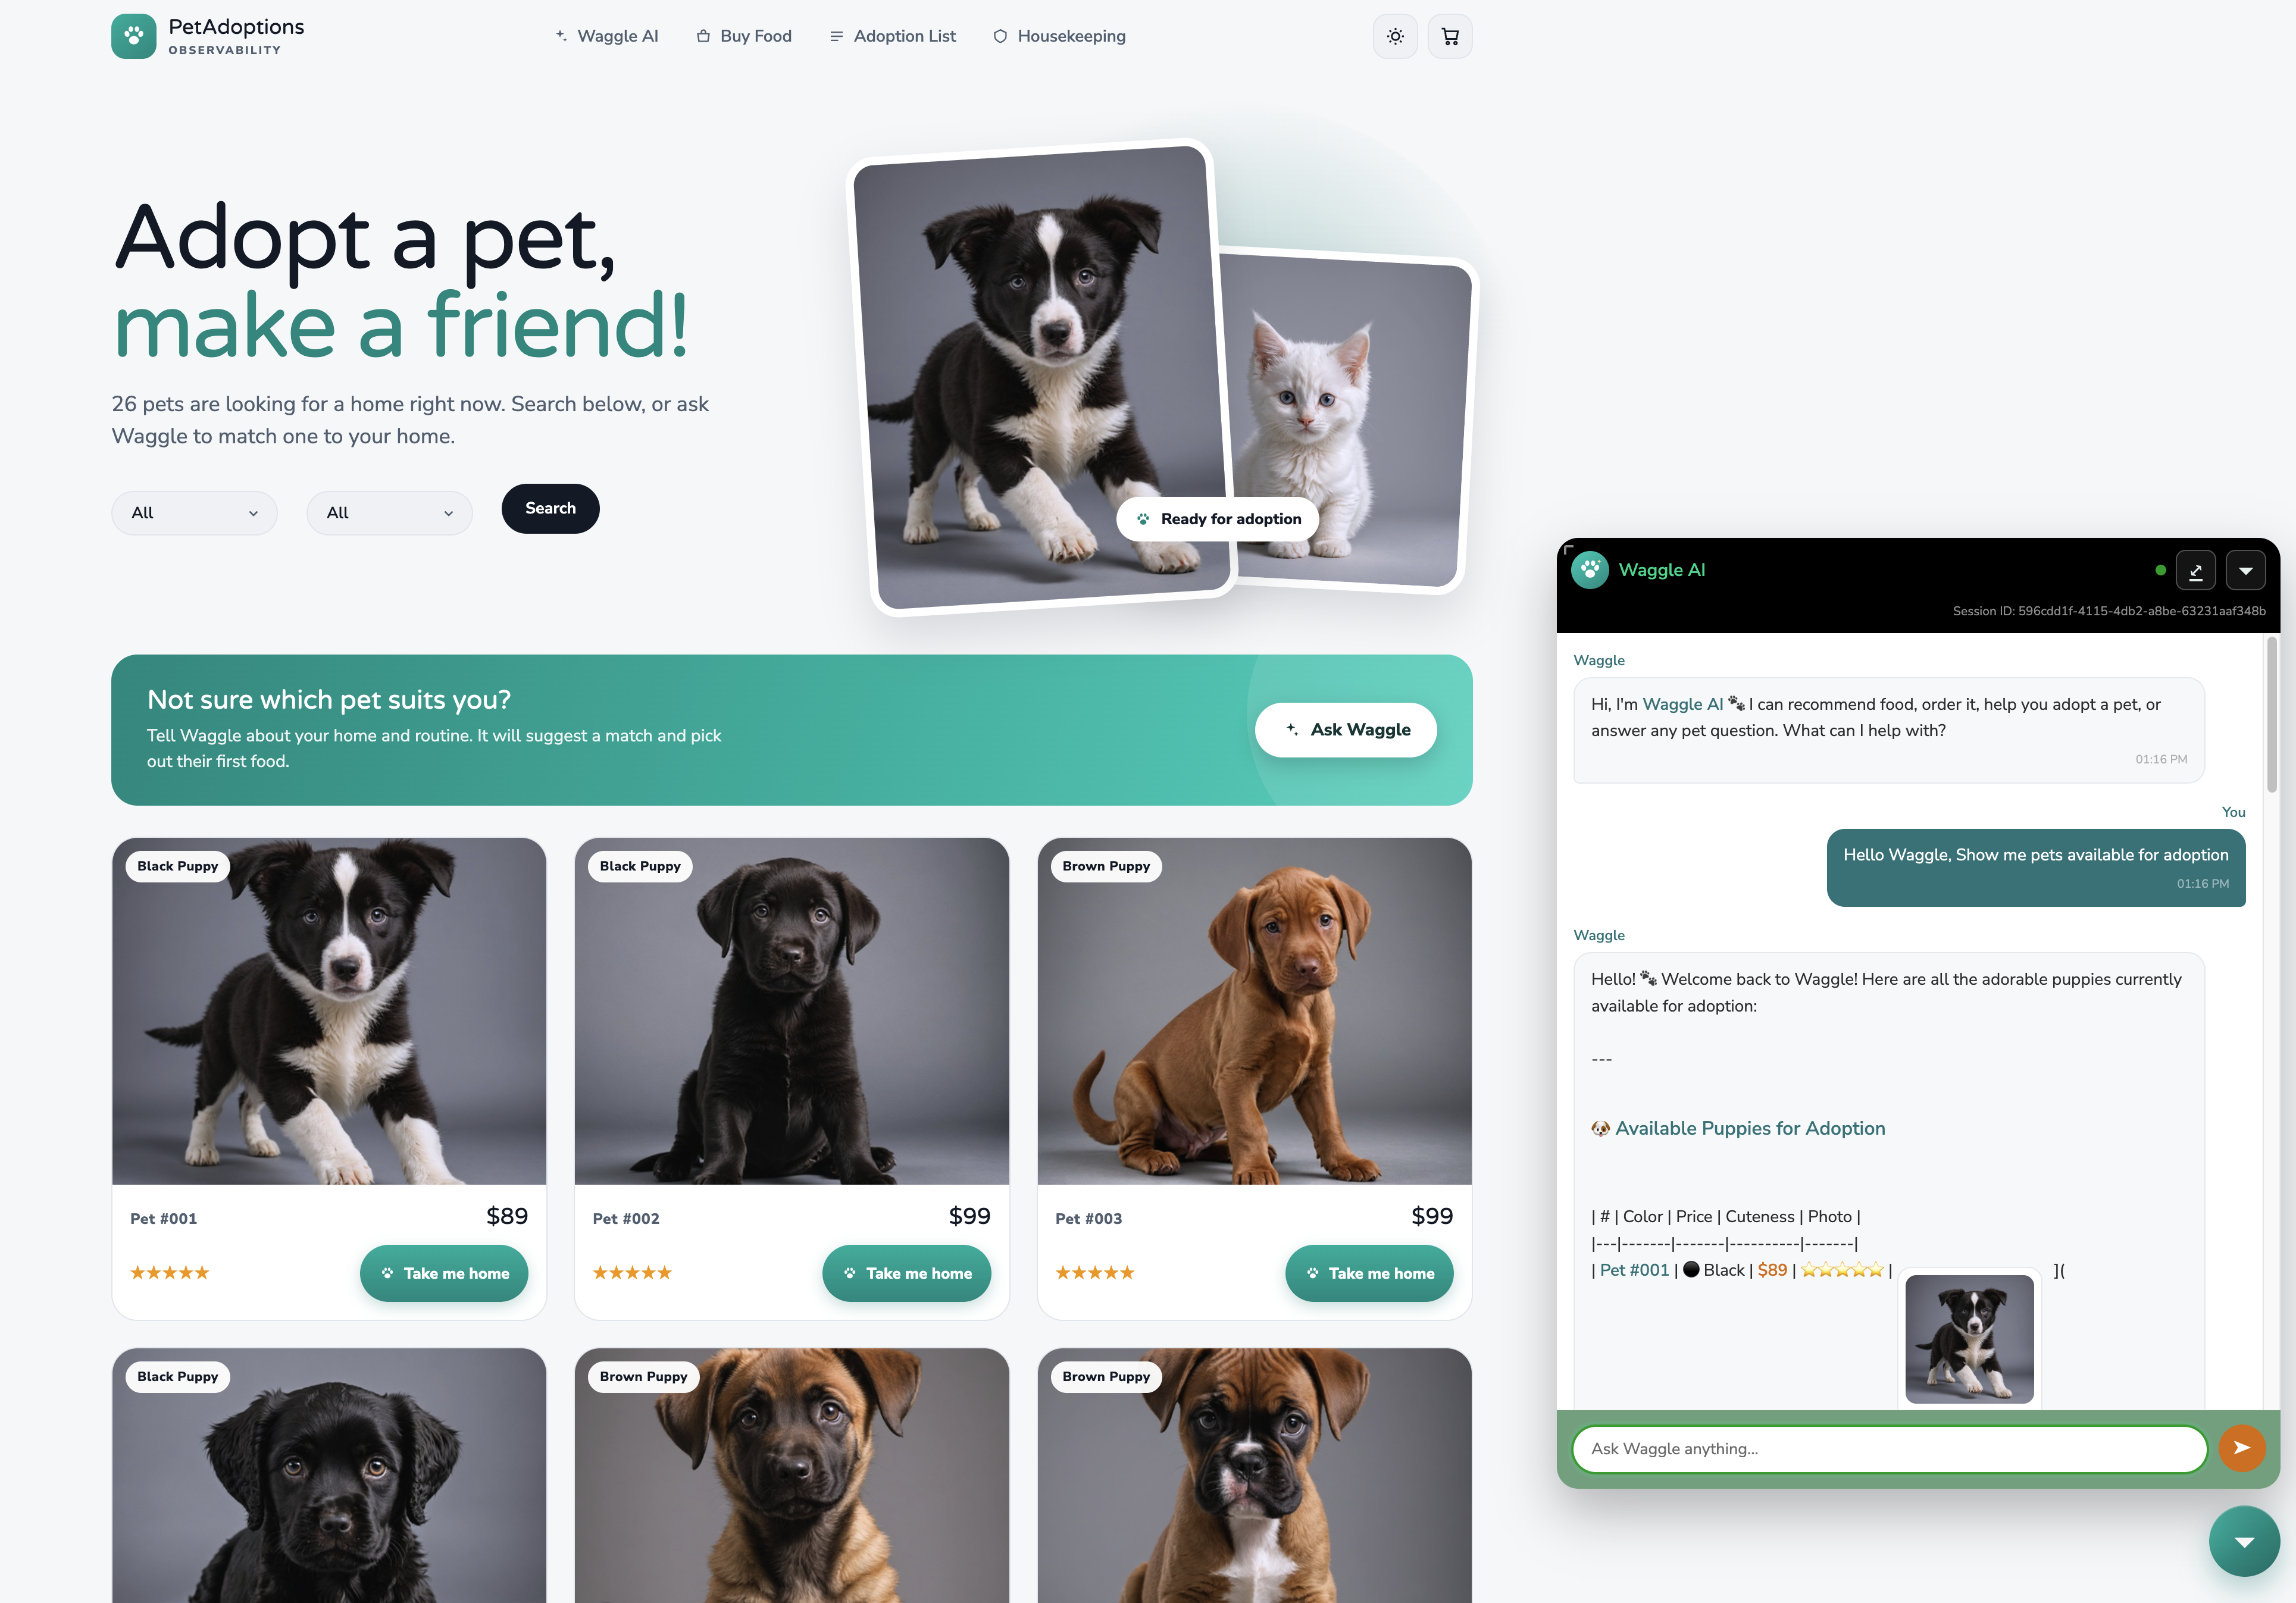
Pet Adoptions
Part of the AWS One Observability Workshop: a polyglot microservices pet adoption store running across EKS, ECS, and Lambda, fully instrumented with ADOT/OTel SDK.
Its Waggle AI assistant is a Strands orchestrator that delegates to four sub-agents, each built on a different framework (LangGraph, CrewAI, LlamaIndex, OpenAI SDK) and a different Bedrock model, and each deployed as its own AgentCore Runtime behind an AgentCore Gateway. Rounded out with AgentCore Memory, Guardrails, and a Knowledge Base, with responses streaming end to end.
View on GitHub
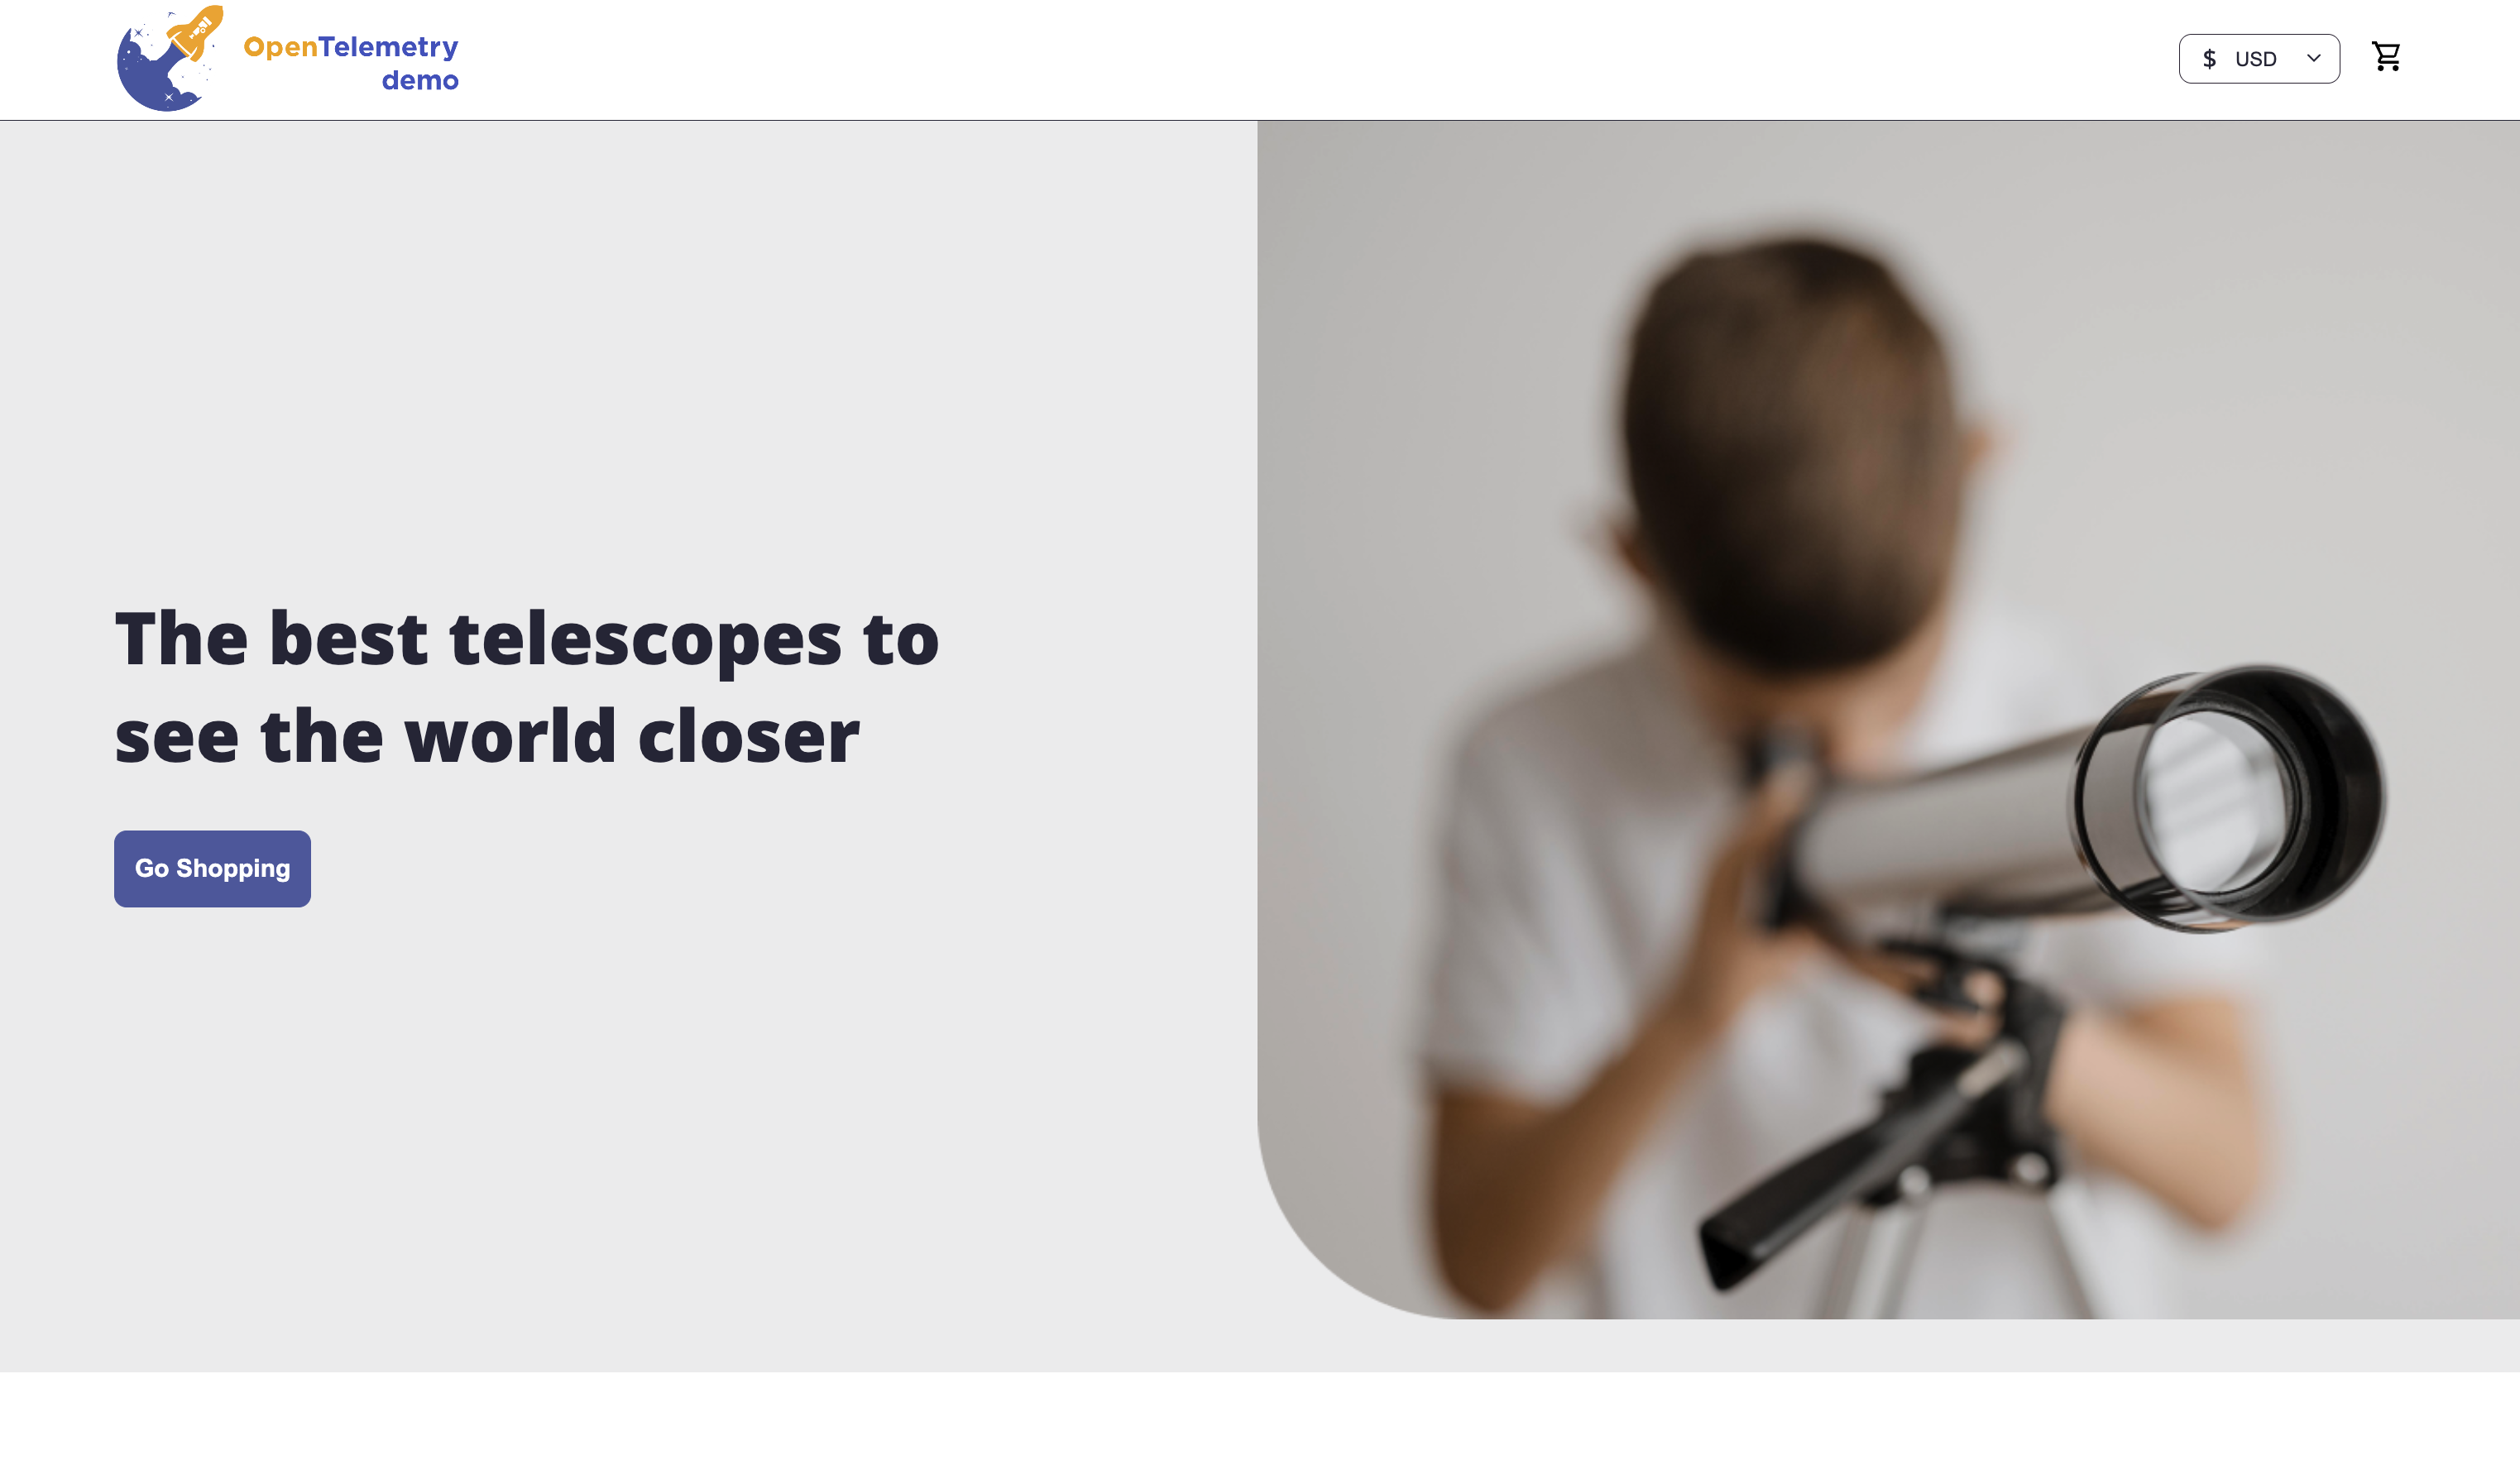
Open Telemetry Astronomy Shop Demo
The upstream CNCF OpenTelemetry reference app: a telescope e-commerce store built from ~20 microservices across 10+ languages, every one natively instrumented for traces, metrics, and logs.
Ships with Jaeger, Prometheus, Grafana, and OpenSearch, plus feature flags that inject realistic failures on demand. Best used to show vendor-neutral instrumentation patterns and how OTel data flows into CloudWatch Omni.
View on GitHub
Start with the Astronomy Shop to see how OpenTelemetry data flows into Omni with nothing to reconfigure, then move to Pet Adoptions to explore agent-level, eval-driven observability across multiple frameworks.
Related
- GenAI Workload Observability — Bedrock/SageMaker invocation monitoring, agent traces, and token/cost dashboards on CloudWatch
- Coding Agents Observability — OTel-based telemetry for Claude Code, Codex, and Copilot developer fleets
Resources
Curated resources for learning and adopting CloudWatch Omni, grouped by type. This list grows over time — new blogs, training, webinars, videos, and demos are added as they publish.