Lambda Monitoring
Overview
Monitor AWS Lambda functions using CloudWatch native integration, X-Ray distributed tracing, and Lambda Insights for enhanced performance visibility. This solution requires zero external agents — it leverages built-in AWS capabilities.
Key observability features:
- Invocation metrics (duration, errors, throttles, concurrency)
- X-Ray traces for downstream call visibility
- Lambda Insights for memory, CPU, and network metrics
- Structured logging with embedded metric format (EMF)
- Cost-per-invocation tracking
This entry leads with Lambda Insights and native CloudWatch metrics. It predates the current recommendation and does not cover:
- CloudWatch Application Signals for Lambda, which provides service-level latency, error rate, and dependency mapping
- The AWS-managed OpenTelemetry Lambda layers for OTLP export
- Transaction Search for trace-level analysis
The steps below still work and Lambda Insights remains useful for memory and cold-start analysis. Prefer Application Signals as the starting point for new functions.
Prerequisites
- AWS Lambda function(s) deployed
- IAM execution role with
AWSXRayDaemonWriteAccess(for tracing) - IAM execution role with
CloudWatchLambdaInsightsExecutionRolePolicy(for Lambda Insights — grants permissions to create log streams and callPutLogEvents) - Lambda Insights layer ARN for your region (account
580247275435, layer nameLambdaInsightsExtension) - CloudWatch Logs enabled (default)
- Runtime requirements: Python 3.9+, Node.js 18+, or Java 11+ (for Powertools and ADOT layer compatibility)
- Lambda Powertools (optional but recommended):
aws-lambda-powertoolsv2+ for Python,@aws-lambda-powertools/logger/@aws-lambda-powertools/metrics/@aws-lambda-powertools/tracerfor TypeScript/Node.js, orsoftware.amazon.lambda:powertools-tracing/powertools-logging/powertools-metricsfor Java - ADOT Lambda layer (optional, for OTel-based collection): ARN format
arn:aws:lambda:<region>:901920570463:layer:aws-otel-<runtime>-<arch>-ver-<version>:1— choose the layer matching your runtime, region, and architecture from the ADOT Lambda layer documentation
Architecture
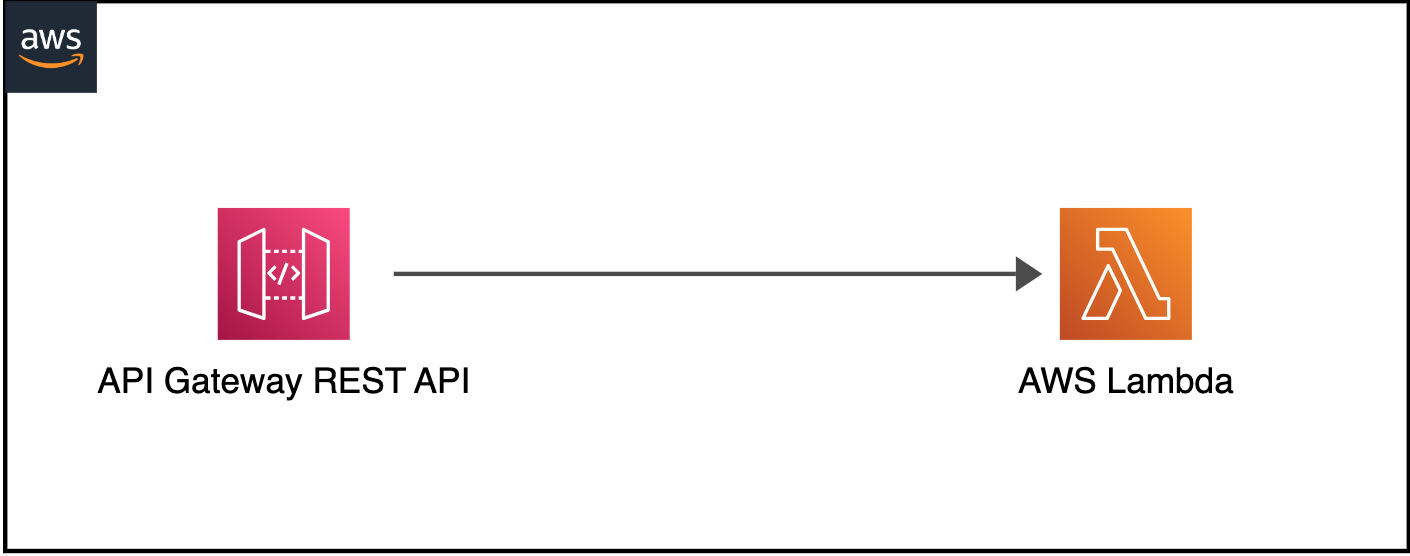
┌───────────────────────────────────────────────────┐
│                Lambda Function                     │
│                                                   │
│  ┌────────────────┐  ┌──────────────────────────┐│
│  │ Function Code  │  │ Lambda Insights Extension ││
│  │ + X-Ray SDK    │  │ (Lambda Layer)            ││
│  └───────┬────────┘  └────────────┬─────────────┘│
└──────────┼─────────────────────────┼──────────────┘
           │                         │
     ┌─────▼─────┐            ┌─────▼──────┐
     │  X-Ray    │            │ CloudWatch │
     │  Traces   │            │ Metrics +  │
     │           │            │ Logs       │
     └───────────┘            └────────────┘
Lambda observability collects four signal types through parallel paths:
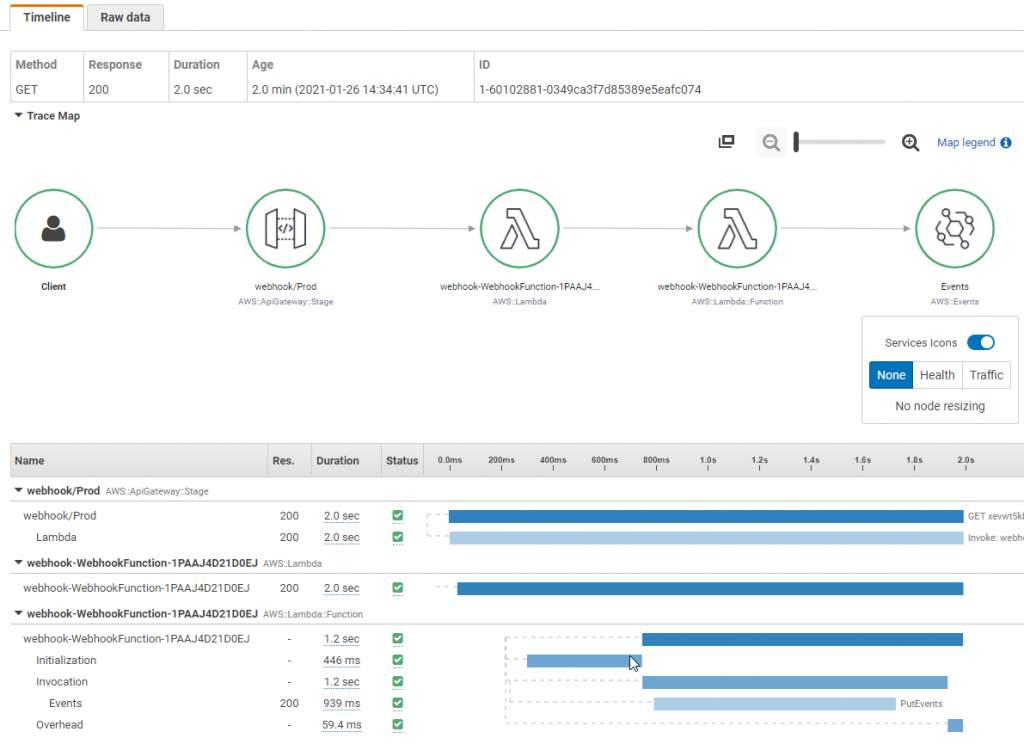
- Traces: The X-Ray daemon, built into the Lambda execution environment, captures trace segments and sends them to X-Ray. The X-Ray SDK (or Powertools
Tracer) adds custom subsegments for downstream calls to DynamoDB, S3, SQS, or external HTTP endpoints. - Structured logs: Lambda writes
stdoutto CloudWatch Logs. Lambda PowertoolsLoggeremits JSON-structured logs with correlation IDs, cold-start flags, and contextual metadata that CloudWatch Logs Insights automatically indexes. - Metrics (vended + custom): Lambda publishes vended metrics (invocations, duration, errors, throttles, concurrent executions) to CloudWatch under
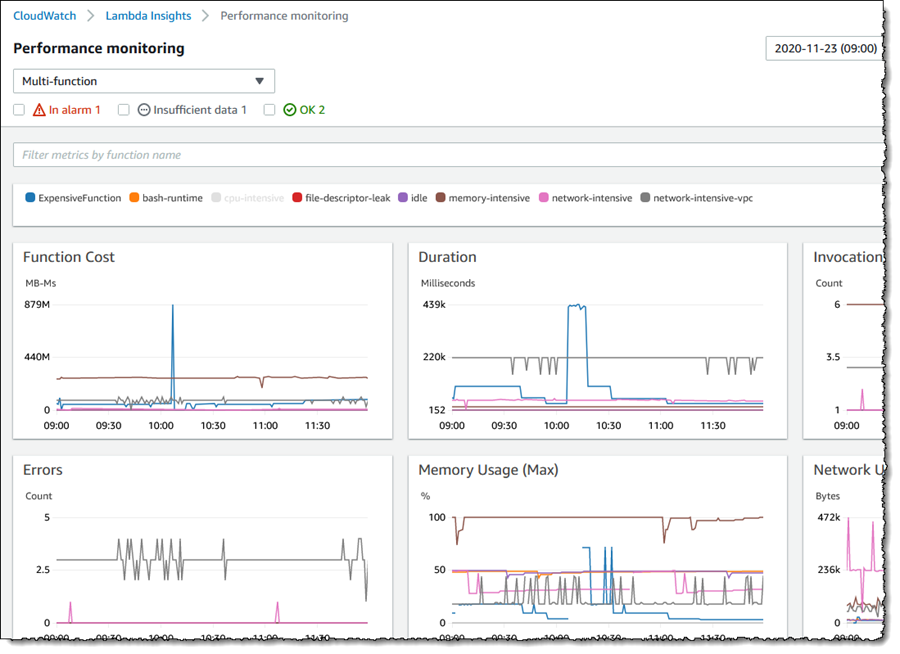
AWS/Lambda. For custom business metrics, Embedded Metric Format (EMF) emits metric data as structured log entries — CloudWatch extracts them asynchronously withoutPutMetricDataAPI calls. - System-level metrics: The Lambda Insights extension collects CPU time, memory utilization, disk/network I/O, and cold-start diagnostics via EMF. These appear under the
LambdaInsightsnamespace.
Alternative — ADOT Lambda layer: Instead of the X-Ray SDK, you can attach the AWS Distro for OpenTelemetry (ADOT) Lambda layer. It bundles the OTel SDK and a trimmed ADOT Collector that auto-instruments your function and exports traces to X-Ray (default) and optionally metrics to Amazon Managed Service for Prometheus or other OTLP backends. This gives vendor-neutral instrumentation at the cost of higher cold-start latency (see Troubleshoot).
Deploy
Step 1: Enable X-Ray tracing
aws lambda update-function-configuration \
  --function-name my-function \
  --tracing-config Mode=Active
Step 2: Add Lambda Insights layer
aws lambda update-function-configuration \
  --function-name my-function \
  --layers "arn:aws:lambda:us-west-2:580247275435:layer:LambdaInsightsExtension:52"
Step 3: Add IAM permissions
{
  "Version": "2012-10-17",
  "Statement": [
    {
      "Effect": "Allow",
      "Action": [
        "xray:PutTraceSegments",
        "xray:PutTelemetryRecords"
      ],
      "Resource": "*"
    }
  ]
}
Also attach the managed policy CloudWatchLambdaInsightsExecutionRolePolicy to your function's execution role so Lambda Insights can write to its log group.
Step 4: Add structured logging with Powertools
Lambda Powertools provides a Logger that outputs JSON-structured logs with built-in correlation ID extraction. Install the library for your runtime and decorate your handler:
from aws_lambda_powertools import Logger, Metrics, Tracer

logger = Logger()
metrics = Metrics(namespace="MyApp")
tracer = Tracer()

@logger.inject_lambda_context(correlation_id_path="requestContext.requestId")
@metrics.log_metrics
@tracer.capture_lambda_handler
def handler(event, context):
    logger.info("Processing order", extra={"order_id": event.get("order_id")})
    metrics.add_metric(name="OrderProcessed", unit="Count", value=1)
    # your logic here
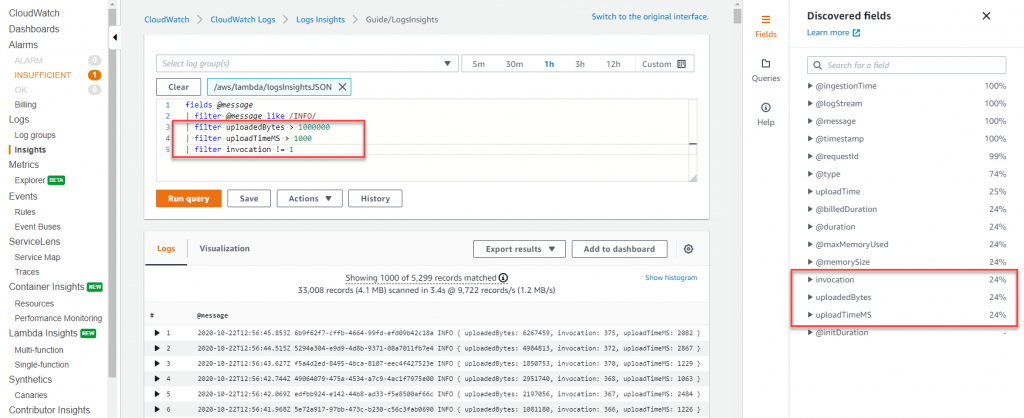
The @logger.inject_lambda_context decorator automatically adds the Lambda request ID, function name, memory size, and cold-start flag to every log line. The correlation_id_path parameter extracts a correlation ID from the event for end-to-end request tracing. Structured JSON logs are indexed by CloudWatch Logs Insights, enabling queries like:
filter @message like /ERROR/
| fields correlation_id, order_id, @timestamp
| sort @timestamp desc
Step 5: Emit custom metrics via Embedded Metric Format (EMF)
The @metrics.log_metrics decorator in Step 4 uses EMF under the hood — Powertools writes a JSON log entry conforming to the EMF specification, and CloudWatch extracts the metric without a synchronous API call. This is more performant and cheaper than calling PutMetricData.
For finer control over dimensions, namespaces, or high-resolution (1-second) metrics, use the lower-level EMF client libraries (aws-embedded-metrics for Node.js, Python, Java, or C#).
Step 6 (Alternative): ADOT Lambda layer for OTel-based collection
If you prefer vendor-neutral OpenTelemetry instrumentation, attach the ADOT Lambda layer instead of (or alongside) the X-Ray SDK:
-
Choose the layer ARN for your runtime and architecture from the ADOT Lambda layer documentation. For example, Java on x86_64:
arn:aws:lambda:us-east-1:901920570463:layer:aws-otel-java-agent-x86_64-ver-1-28-1:1 -
Set the wrapper environment variable so the layer instruments your handler:
aws lambda update-function-configuration \
  --function-name my-function \
  --environment "Variables={AWS_LAMBDA_EXEC_WRAPPER=/opt/otel-handler}"
Use
/opt/otel-handlerfor Java and Node.js, or/opt/otel-instrumentfor Python. -
By default the layer exports traces to X-Ray. To send metrics to Amazon Managed Service for Prometheus or another backend, add a custom
collector.yamlto your function's root directory and setOPENTELEMETRY_COLLECTOR_CONFIG_FILE=/var/task/collector.yaml. See the ADOT collector configuration documentation for exporter options. -
To reduce cold-start overhead, disable instrumentations you do not need:
OTEL_INSTRUMENTATION_COMMON_DEFAULT_ENABLED=false
OTEL_INSTRUMENTATION_AWS_LAMBDA_ENABLED=true
OTEL_INSTRUMENTATION_AWS_SDK_ENABLED=true
Step 7: Set CloudWatch Logs retention
By default, CloudWatch Logs retains Lambda log data indefinitely. Set a retention policy for your environment:
# CloudFormation / SAM example
Resources:
  MyFunctionLogGroup:
    Type: AWS::Logs::LogGroup
    Properties:
      LogGroupName: !Sub "/aws/lambda/${MyFunction}"
      RetentionInDays: 14
Validate
-
Invoke your function:
aws lambda invoke --function-name my-function output.json -
Check CloudWatch metrics: Navigate to CloudWatch > Metrics > AWS/Lambda.
-
Check X-Ray traces: Navigate to CloudWatch > X-Ray traces > Trace map.
-
Check Lambda Insights: Navigate to CloudWatch > Insights > Lambda Insights.
Troubleshoot
| Symptom | Likely Cause | Fix |
|---|---|---|
| No traces in X-Ray | Tracing not set to Active | Check function config: aws lambda get-function-configuration and verify TracingConfig.Mode is Active |
| Lambda Insights no data | Layer not attached or wrong IAM policy | Verify the LambdaInsightsExtension layer ARN matches your region, and CloudWatchLambdaInsightsExecutionRolePolicy is attached to the execution role |
| High duration reported | Cold starts | Enable provisioned concurrency or SnapStart (Java 11+) |
| Missing custom metrics | EMF format error | Validate the JSON structure in CloudWatch Logs — check the EMFValidationErrors and EMFParsingErrors metrics under the AWS/Logs namespace for format issues |
| ADOT layer adds 5–15 s to cold start | Java agent instruments all supported libraries by default | Set OTEL_INSTRUMENTATION_COMMON_DEFAULT_ENABLED=false and selectively enable only the instrumentations you need |
| ADOT layer not instrumenting function | OTel layer version incompatible with runtime | Ensure the ADOT layer ARN matches your runtime version and architecture (x86_64 vs arm64). Check ADOT Lambda releases for the latest compatible version |
| CloudWatch Logs costs unexpectedly high | Log retention set to indefinite (default) | Set RetentionInDays on each Lambda log group — 7–30 days is typical for non-production, 90 days for production. Use CloudWatch Logs subscription filters to archive older logs to S3 if needed |
Related Solutions
- EKS Application Signals — Application Signals across compute types including Lambda
- ADOT at Scale — ADOT collector architecture for multi-function deployments
- Rust Custom Metrics — Custom metrics on Lambda with Rust
- .NET Application Monitoring — .NET Lambda monitoring patterns