Collecting system metrics with Container Insights
System metrics pertain to low-level resources that include physical components on a server such as CPU, memory, disks and network interfaces. Use CloudWatch Container Insights to collect, aggregate, and summarize system metrics from containerized applications deployed to Amazon ECS. Container Insights also provides diagnostic information, such as container restart failures, to help isolate issues and resolve them quickly. It is available for Amazon ECS clusters deployed on EC2 and Fargate.
Container Insights collects data as performance log events using embedded metric format. These performance log events are entries that use a structured JSON schema that enables high-cardinality data to be ingested and stored at scale. From this data, CloudWatch creates aggregated metrics at the cluster, node, service and task level as CloudWatch metrics.
For Container Insights metrics to appear in CloudWatch, you must enable Container Insights on your Amazon ECS clusters. This can be done either at the account level or at the individual cluster level. To enable at the account level, use the following AWS CLI command:
aws ecs put-account-setting --name "containerInsights" --value "enabled
To enable at the individual cluster level, use the following AWS CLI command:
aws ecs update-cluster-settings --cluster $CLUSTER_NAME --settings name=containerInsights,value=enabled
Collecting cluster-level and service-level metrics
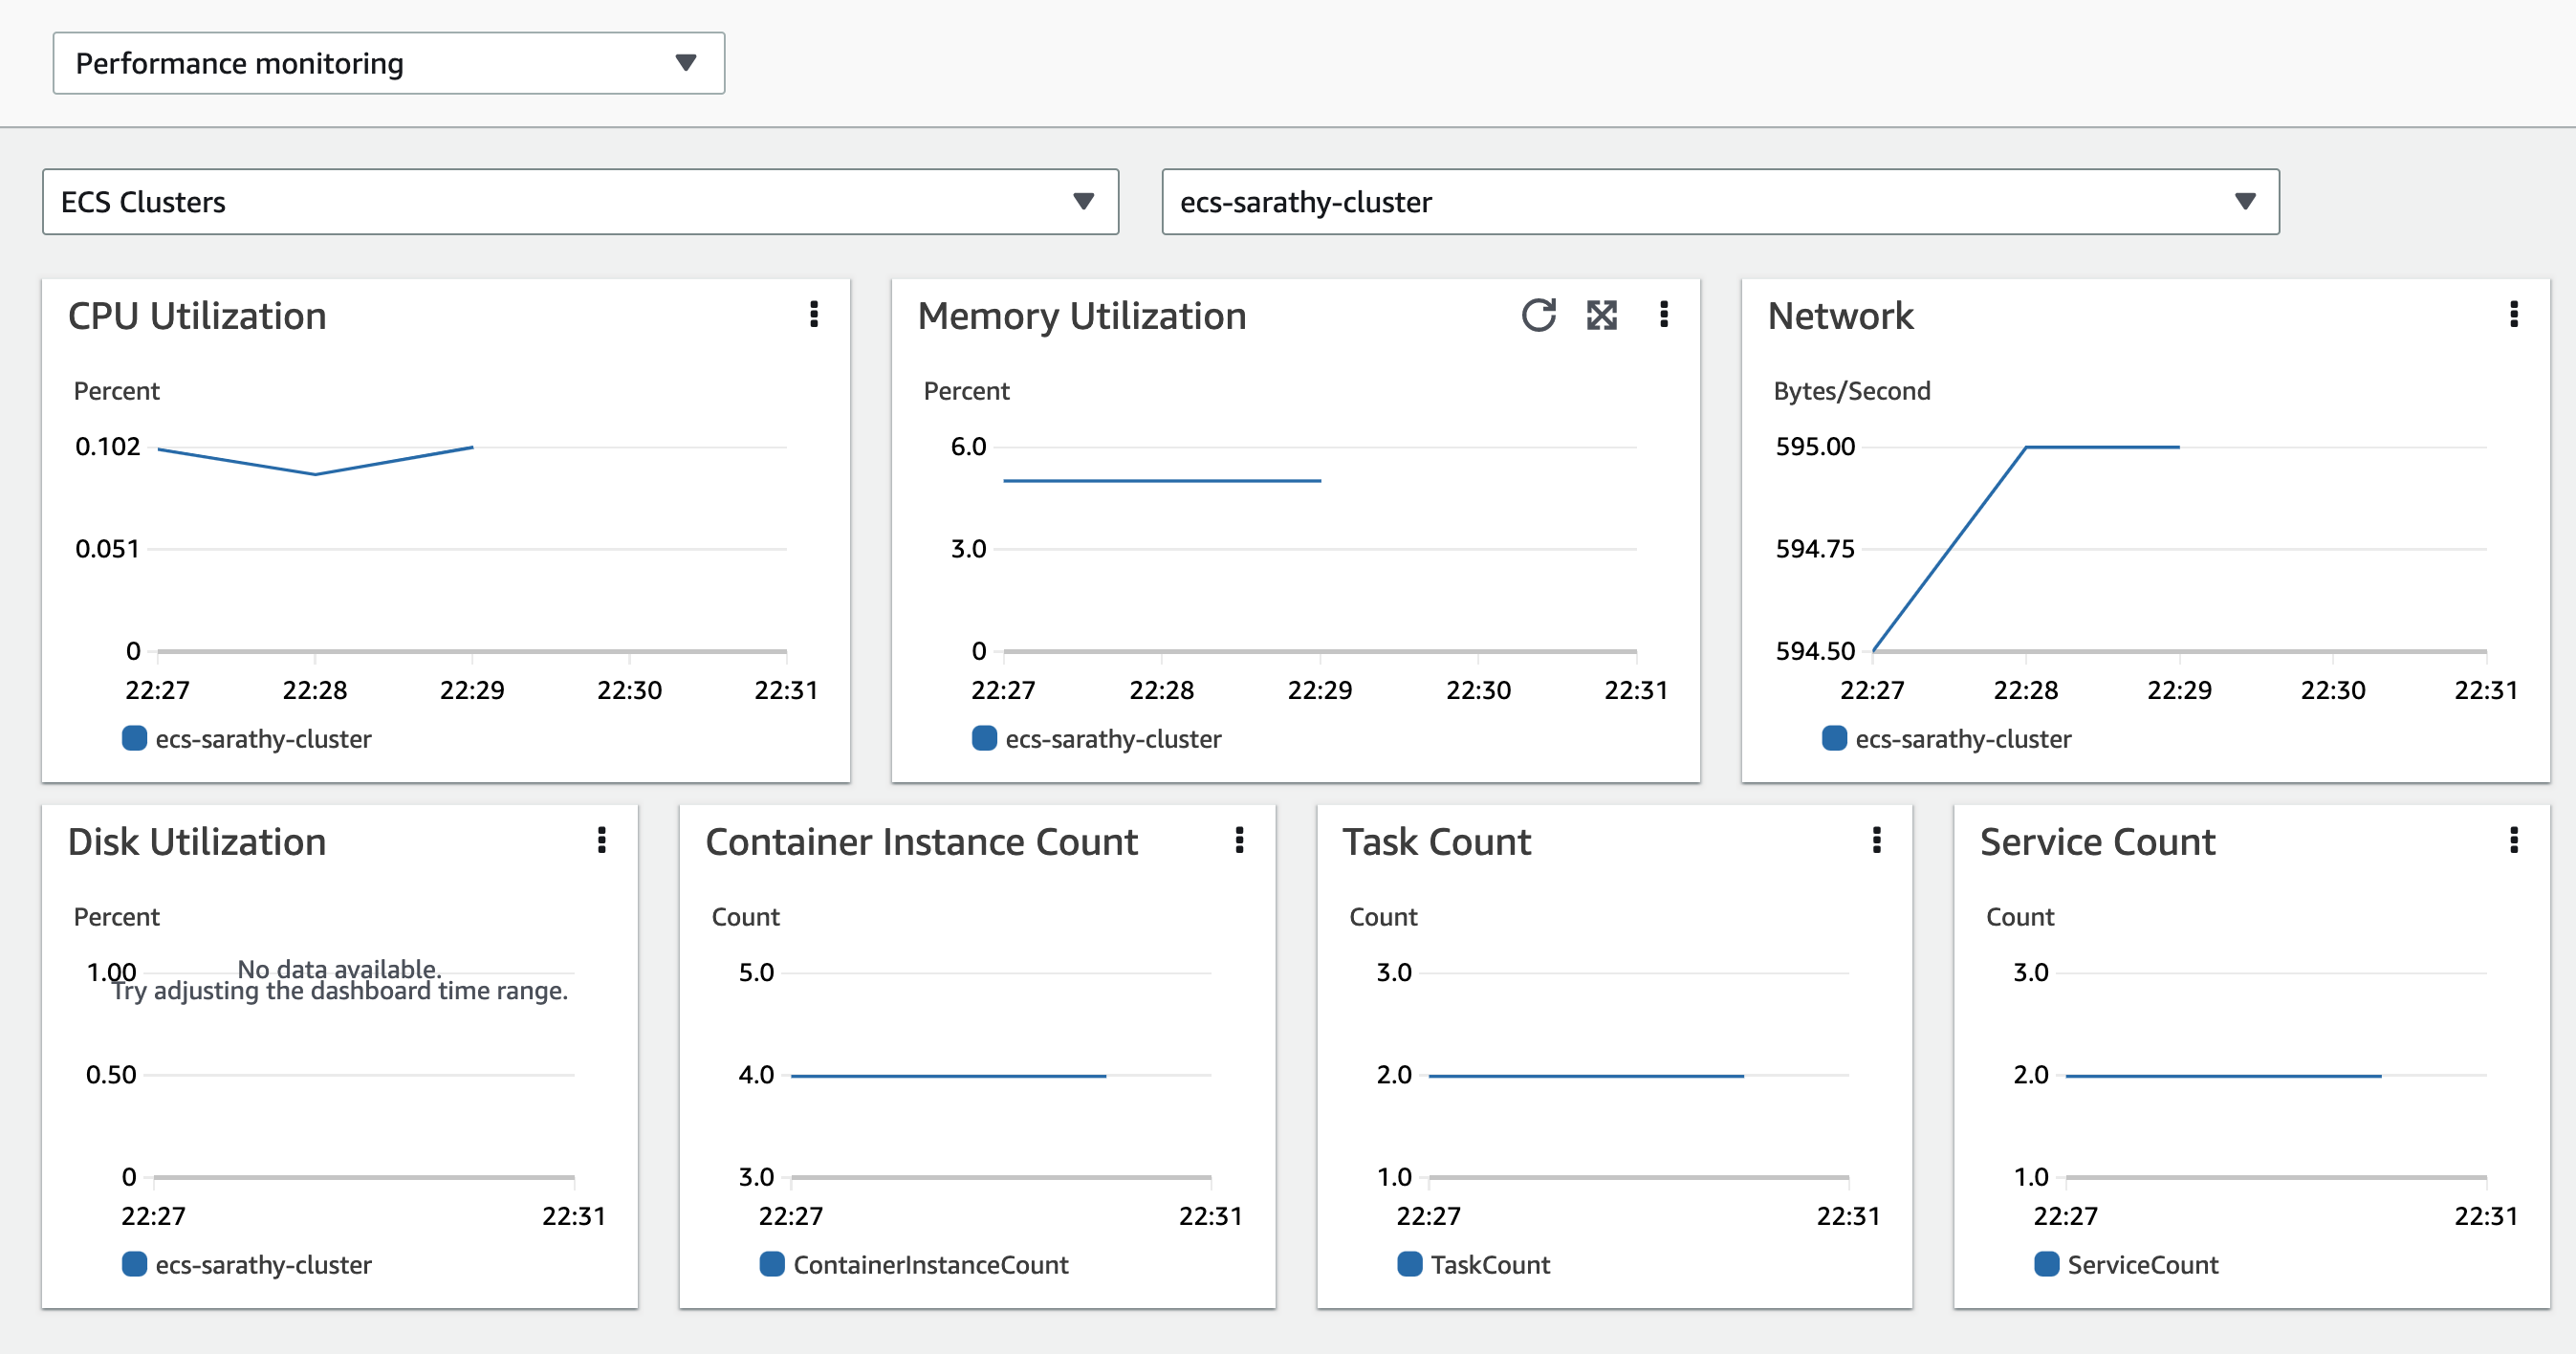
By default, CloudWatch Container Insights collects metrics at the task, service and cluster level. The Amazon ECS agent collects these metrics for each task on an EC2 container instance (for both ECS on EC2 and ECS on Fargate) and sends them to CloudWatch as performance log events. You don't need to deploy any agents to the cluster. These log events from which the metrics are extracted are collected under the CloudWatch log group named /aws/ecs/containerinsights/$CLUSTER_NAME/performance. The complete list of metrics extracted from these events are documented here. The metrics that Container Insights collects are readily viewable in pre-built dashboards available in the CloudWatch console by selcting Container Insights from the navigation page and then selecting performance monitoring from the dropdown list. They are also viewable in the Metrics section of the CloudWatch console.
If you're using Amazon ECS on an Amazon EC2 instance, and you want to collect network and storage metrics from Container Insights, launch that instance using an AMI that includes Amazon ECS agent version 1.29.
Metrics collected by Container Insights are charged as custom metrics. For more information about CloudWatch pricing, see Amazon CloudWatch Pricing
Collecting instance-level metrics
Deploying the CloudWatch agent to an Amazon ECS cluster hosted on EC2, allows you to collect instance-level metrics from the cluster. The agent is deployed as a daemon service and sends instance-level metrics as performance log events from each EC2 container instance in the cluster. The complete list of instance-level extracted from these events are documented here
Steps to deploy the CloudWatch agent to an Amazon ECS cluster to collect instance-level metrics are documented in the Amazon CloudWatch User Guide. Note that this option is not availavble for Amazon ECS clusters that are hosted on Fargate.
Analyzing performance log events with Logs Insights
Container Insights collects metrics by using performance log events with embedded metric format. Each log event may contain performance data observed on system resources such as CPU and memory or ECS resources such as tasks and services. Examples of performance log events that Container Insights collects from an Amazon ECS at the cluster, service, task and container level are listed here. CloudWatch generates metrics based only on some of the performance data in these log events. But you can use these log events to perform a deeper analysis of the performance data using CloudWatch Logs Insights queries.
The user interface to run Logs Insights queries is available in the CloudWatch console by selecting Logs Insights from the navigation page. When you select a log group, CloudWatch Logs Insights automatically detects fields in the performance log events in the log group and displays them in Discovered fields in the right pane. The results of a query execution are displayed as a bar graph of log events in this log group over time. This bar graph shows the distribution of events in the log group that matches your query and time range.
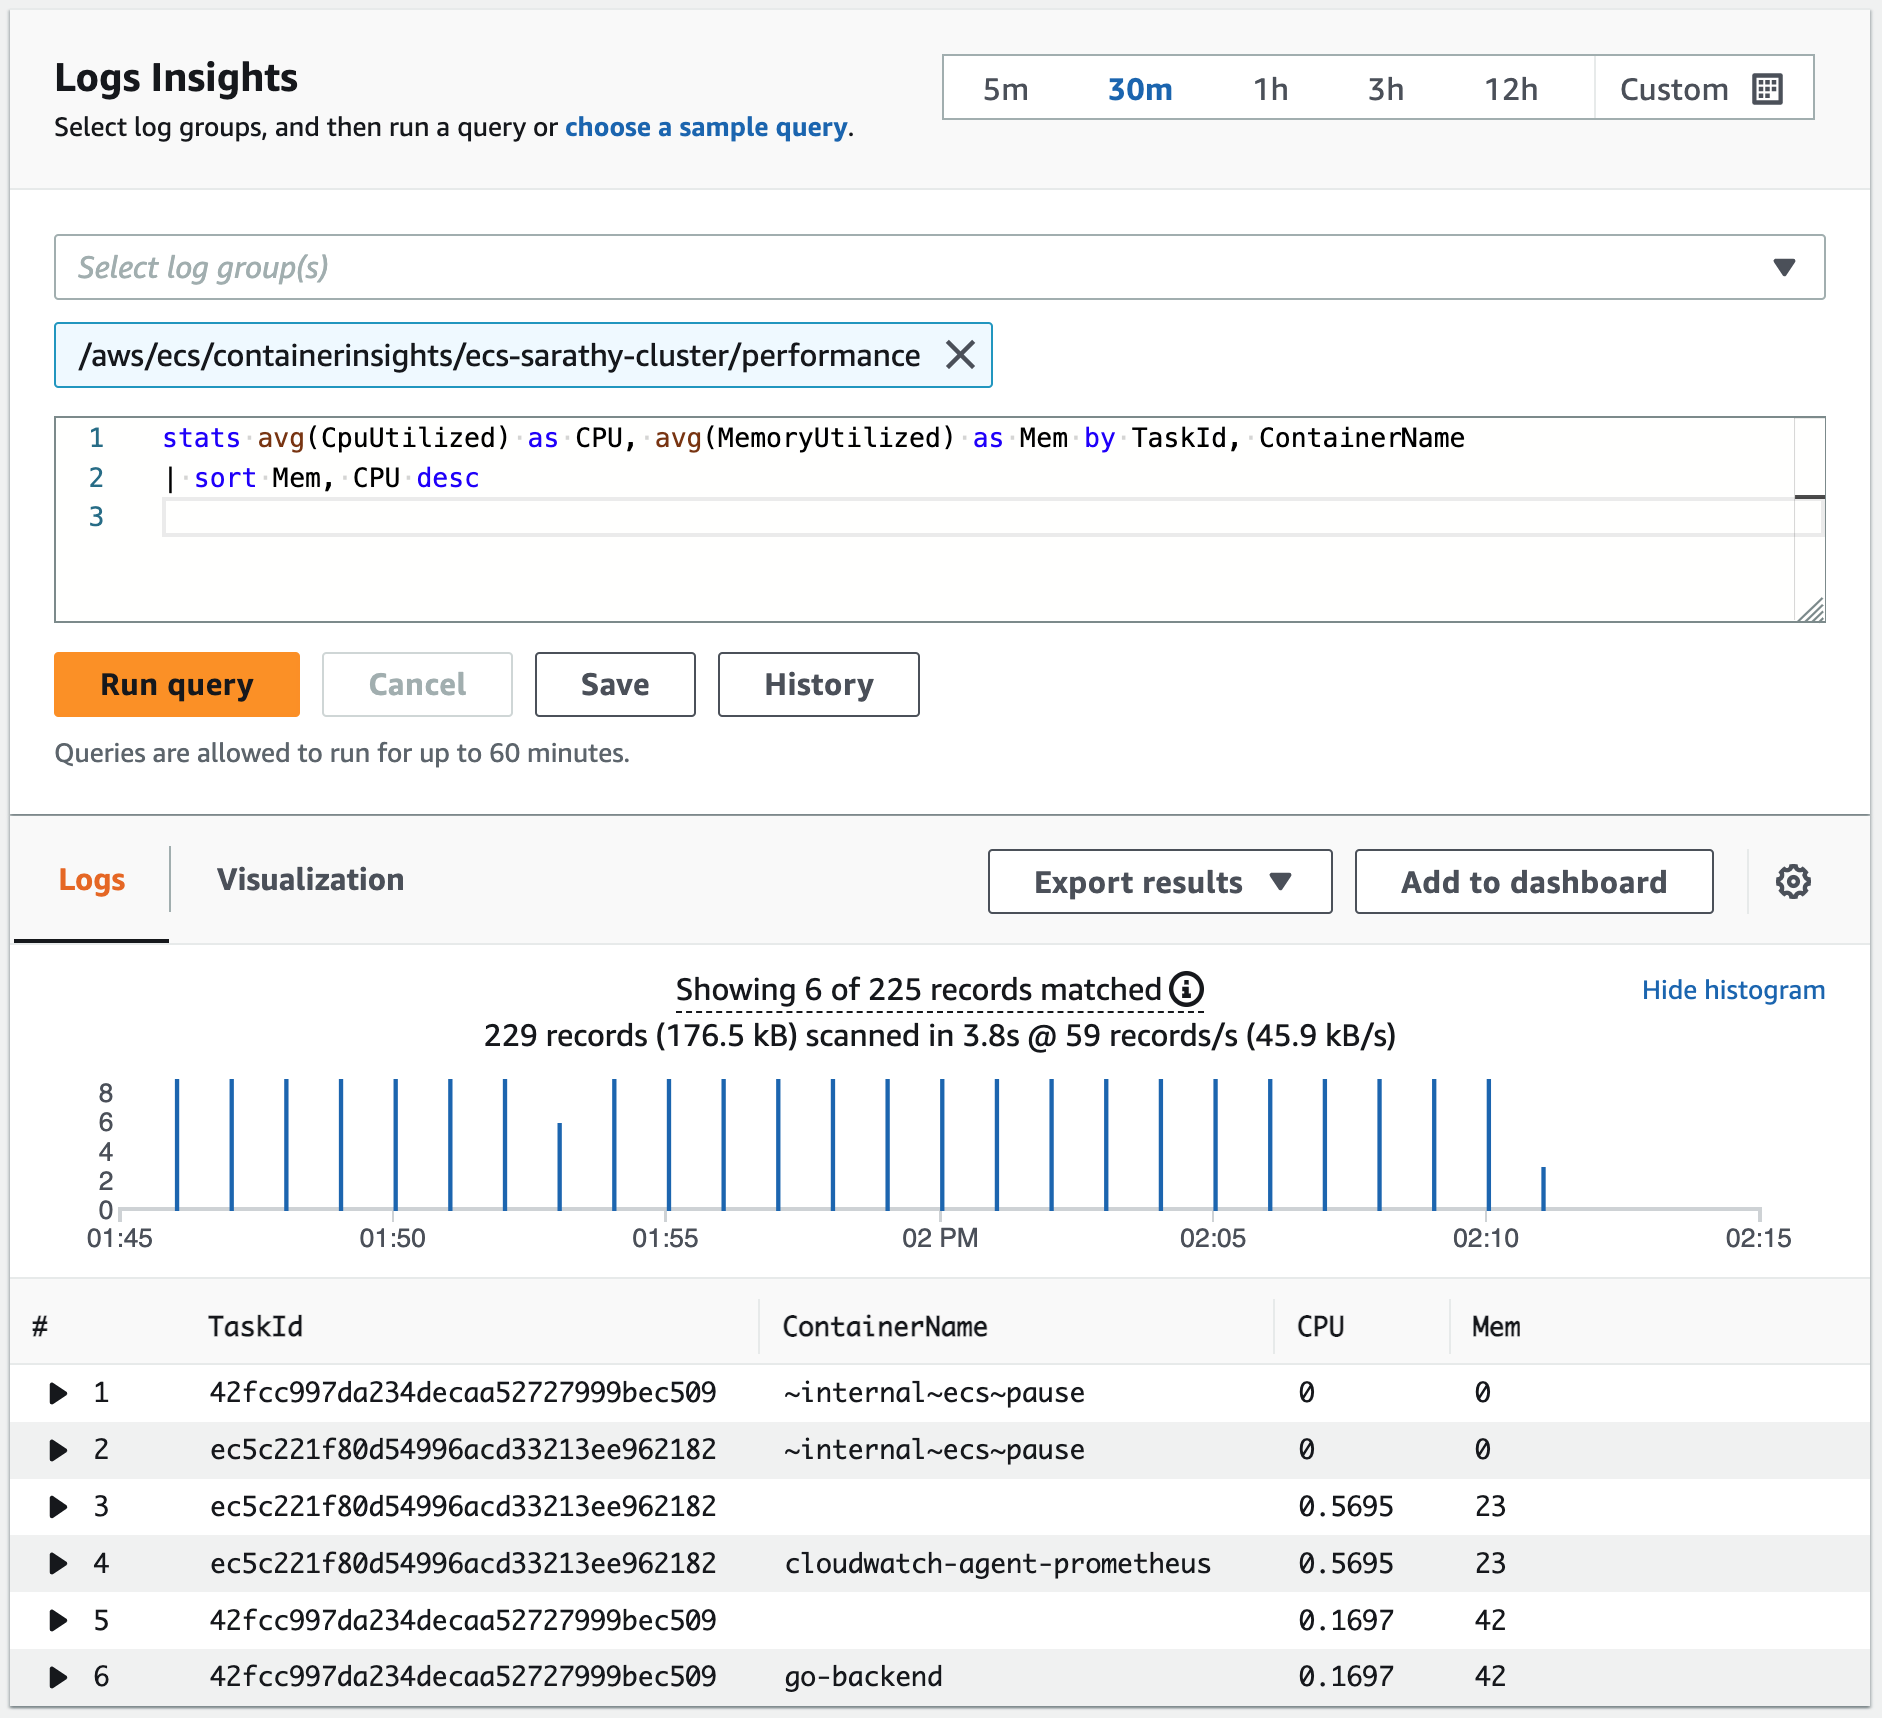
Here's a sample Logs Insights query to display container-level metrics for CPU and memory usage.
stats avg(CpuUtilized) as CPU, avg(MemoryUtilized) as Mem by TaskId, ContainerName | sort Mem, CPU desc