Resource Optimization best practices for Kubernetes workloads
Kubernetes adoption continues to accelerate, as many move to microservice based architectures. A lot of the initial focus was on designing and building new cloud native architectures to support the applications. As environments grow, we are starting to see the focus to optimize resource allocation from customers. Resource optimization is the second most important question operations team ask for after security. Let's talk about guidance on how to optimize resource allocation and right-size applications on Kubernetes environments. This includes applications running on Amazon EKS deployed with managed node groups, self-managed node groups, and AWS Fargate.
Reasons for Right-sizing applications on Kubernetes
In Kubernetes, resource right-sizing is done through setting resource specifications on applications. These settings directly impact:
- Performance — Kubernetes applications will arbitrarily compete for resources without proper resource specifications, This can adversely impact application performance.
- Cost Optimization — Applications deployed with oversized resource specifications will result in increased costs and under utilized infrastructure.
- Autoscaling — The Kubernetes Cluster Autoscaler and Horizontal Pod Autoscaling require resource specifications to function.
The most common resource specifications in Kubernetes are for CPU and memory requests and limits.
Requests and Limits
Containerized applications are deployed on Kubernetes as Pods. CPU and memory requests and limits are an optional part of the Pod definition. CPU is specified in units of Kubernetes CPUs while memory is specified in bytes, usually as mebibytes (Mi).
Request and limits each serve different functions in Kubernetes and impact scheduling and resource enforcement differently.
Recommendations
An application owner needs to choose the "right" values for their CPU and memory resource requests. An ideal way is to load test the application in a development environment and measure resource usage using observability tooling. While that might make sense for your organization’s most critical applications, it’s likely not feasible for every containerized application deployed in your cluster. Let's talk about the tools that can help us optimize and right-size the workloads:
Vertical Pod Autoscaler (VPA)
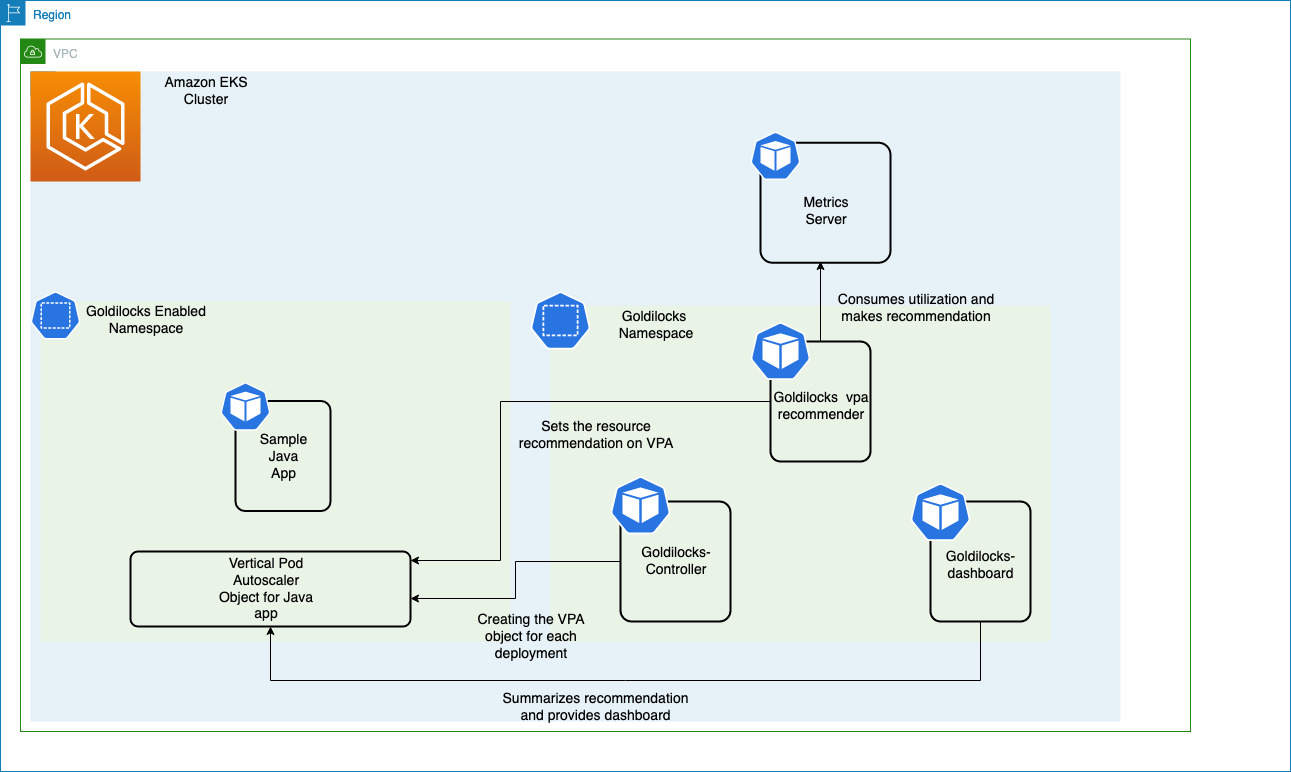
VPA is Kubernetes sub-project owned by the Autoscaling special interest group (SIG). It’s designed to automatically set Pod requests based on observed application performance. VPA collects resource usage using the Kubernetes Metric Server by default but can be optionally configured to use Prometheus as a data source. VPA has a recommendation engine that measures application performance and makes sizing recommendations. The VPA recommendation engine can be deployed stand-alone so VPA will not perform any autoscaling actions. It’s configured by creating a VerticalPodAutoscaler custom resource for each application and VPA updates the object’s status field with resource sizing recommendations. Creating VerticalPodAutoscaler objects for every application in your cluster and trying to read and interpret the JSON results is challenging at scale. Goldilocks is an open source project that makes this easy.
Goldilocks
Goldilocks is an open source project from Fairwinds that is designed to help organizations get their Kubernetes application resource requests “just right". The default configuration of Goldilocks is an opt-in model. You choose which workloads are monitored by adding the goldilocks.fairwinds.com/enabled: true label to a namespace.

The Metrics Server collects resource metrics from the Kubelet running on worker nodes and exposes them through Metrics API for use by the Vertical Pod Autoscaler. The Goldilocks controller watches for namespaces with the goldilocks.fairwinds.com/enabled: true label and creates VerticalPodAutoscaler objects for each workload in those namespaces.
To enable namespaces for resource recommendation, run the below command:
kubectl create ns javajmx-sample
kubectl label ns javajmx-sample goldilocks.fairwinds.com/enabled=true
To deploy goldilocks in the Amazon EKS Cluster, run the below command:
helm repo add fairwinds-stable https://charts.fairwinds.com/stable
helm upgrade --install goldilocks fairwinds-stable/goldilocks --namespace goldilocks --create-namespace --set vpa.enabled=true
Goldilocks-dashboard will expose the dashboard in the port 8080 and we can access it to get the resource recommendation. Let’s run the below command to access the dashboard:
kubectl -n goldilocks port-forward svc/goldilocks-dashboard 8080:80
Then open your browser to http://localhost:8080

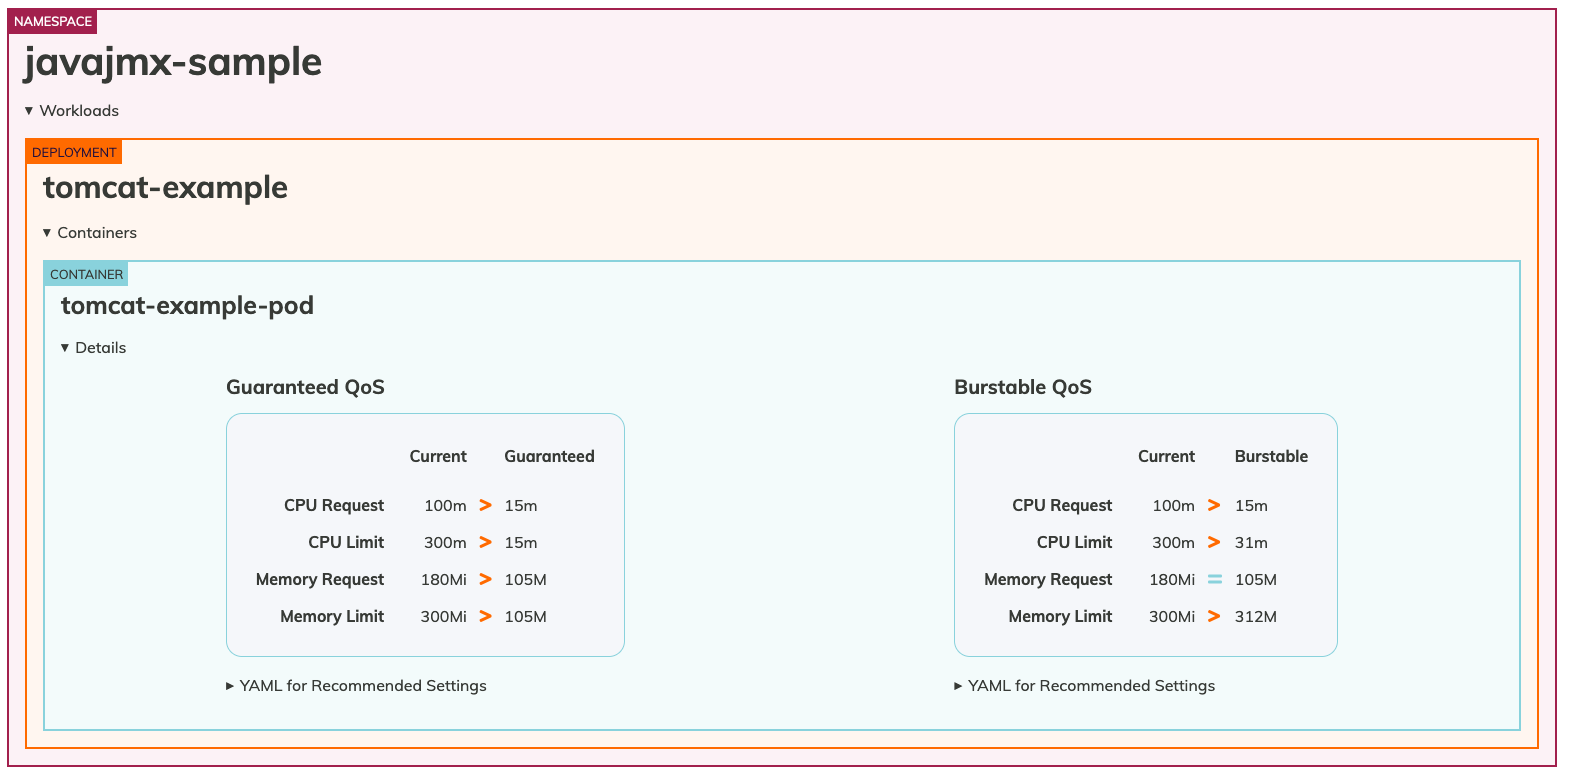
Let’s analyze the sample namespace to see the recommendations provided by Goldilocks. We should be able to see the recommendations for the deployment.

We could see the request & limit recommendations for the javajmx-sample workload. The Current column under each Quality of Service (Qos) indicates the currently configured CPU and Memory request and limits. The Guranteed and Burstable column indicates the recommended CPU and Memory request limits for the respective QoS.
We can clearly notice that we have over provisioned the resources and goldilocks has made the recommendations to optimize the CPU and Memory request. The CPU request and limits has been recommended to be 15m and 15m compared to 100m and 300m for Guranteed QoS and Memory request and limits to be 105M and 105M, compared to 180Mi and 300 Mi. You can simply copy the respective manifest file for the QoS class, they are interested in and deploy the workloads which is right-sized and optimized.
Understand throttling using cAdvisor metric and configuring the resource appropriately
When we configure limits, we are telling the Linux node how long a specific containerized application can run during a specific period of time. We do this to protect the rest of the workloads on a node from a wayward set of processes from taking an unreasonable amount of CPU cycles. We are not defining several physical “cores” sitting on a motherboard; however, we are configuring how much time a grouping of processes or threads in a single container can run before we want to temporarily pause the container to avoid overwhelming other applications.
There is a handy cAdvisor metrics called container_cpu_cfs_throttled_seconds_total which adds up all the throttled 5 ms slices and gives us an idea how far over the quota the process is. This metric is in seconds, so we divide the value by 10 to get 100 ms, which is the real period of time associated with the container.
PromQl query to understand the top three pods CPU usage over a 100 ms time.
topk(3, max by (pod, container)(rate(container_cpu_usage_seconds_total{image!="", instance="$instance"}[$__rate_interval]))) / 10
A value of 400 ms of vCPU usage is observed.

PromQL gives us a per second throttling, with 10 periods in a second. To get the per period throttling, we divide by 10. If we want to know how much to increase the limits setting, then we can multiple by 10 (e.g., 400 ms * 10 = 4000 m).
While the above tools provide ways to identify opportunities for resource optimization, applications team should spend time in identifying whether a given application is CPU / Memory intensive and allocate resources to prevent throttling / over-provisioning.