Amazon Managed Service for Prometheus Alert Manager
Introduction
Amazon Managed Service for Prometheus (AMP) supports two types of rules namely 'Recording rules' and 'Alerting rules', which can be imported from your existing Prometheus server and are evaluated at regular intervals.
Alerting rules allow customers to define alert conditions based on PromQL and a threshold. When the value of the alerting rule exceeds threshold, a notification is sent to Alert manager in Amazon Managed Service for Prometheus which provides similar functionality to alert manager in standalone Prometheus. An alert is the outcome of an alerting rule in Prometheus when it is active.
Alerting Rules File
An Alerting rule in Amazon Managed Service for Prometheus is defined by a rules file in YAML format, which follows the same format as a rules file in standalone Prometheus. Customers can have multiple rules files in an Amazon Managed Service for Prometheus workspace. A workspace is a logical space dedicated to the storage and querying of Prometheus metrics.
A rules file typically has the following fields:
groups:
  - name:
  rules:
  - alert:
  expr:
  for:
  labels:
  annotations:
Groups: A collection of rules that are run sequentially at a regular interval
Name: Name of the group
Rules: The rules in a group
Alert: Name of the alert
Expr: The expression for the alert to trigger
For: Minimum duration for an alert’s expression to be exceeding threshold before updating to a firing status
Labels: Any additional labels attached to the alert
Annotations: Contextual details such as a description or link
A sample rule file looks like below
groups:
  - name: test
    rules:
    - record: metric:recording_rule
      expr: avg(rate(container_cpu_usage_seconds_total[5m]))
  - name: alert-test
    rules:
    - alert: metric:alerting_rule
      expr: avg(rate(container_cpu_usage_seconds_total[5m])) > 0
      for: 2m
Alert Manager Configuration File
The Amazon Managed Service for Prometheus Alert Manager uses a configuration file in YAML format to set up the alerts (for the receiving service) that is in the same structure as an alert manager config file in standalone Prometheus. The configuration file consists of two key sections for alert manager and templating
-
template_files, contains the templates of annotations and labels in alerts exposed as the
$value,$labels,$externalLabels, and$externalURLvariables for convenience. The$labelsvariable holds the label key/value pairs of an alert instance. The configured external labels can be accessed via the$externalLabelsvariable. The$valuevariable holds the evaluated value of an alert instance..Value,.Labels,.ExternalLabels, and.ExternalURLcontain the alert value, the alert labels, the globally configured external labels, and the external URL (configured with--web.external-url) respectively. -
alertmanager_config, contains the alert manager configuration that uses the same structure as an alert manager config file in standalone Prometheus.
A sample alert manager configuration file having both template_files and alertmanager_config looks like below,
template_files:
  default_template: |
    {{ define "sns.default.subject" }}[{{ .Status | toUpper }}{{ if eq .Status "firing" }}:{{ .Alerts.Firing | len }}{{ end }}]{{ end }}
    {{ define "__alertmanager" }}AlertManager{{ end }}
    {{ define "__alertmanagerURL" }}{{ .ExternalURL }}/#/alerts?receiver={{ .Receiver | urlquery }}{{ end }}
alertmanager_config: |
  global:
  templates:
    - 'default_template'
  route:
    receiver: default
  receivers:
    - name: 'default'
      sns_configs:
      - topic_arn: arn:aws:sns:us-east-2:accountid:My-Topic
        sigv4:
          region: us-east-2
        attributes:
          key: severity
          value: SEV2
Key aspects of alerting
There are three important aspects to be aware of when creating Amazon Managed Service for Prometheus Alert Manager configuration file.
- Grouping: This helps collect similar alerts into a single notification, which is useful when the blast radius of failure or outage is large affecting many systems and several alerts fire simultaneously. This can also be used to group into categories (e.g., node alerts, pod alerts). The route block in the alert manager configuration file can be used to configure this grouping.
- Inhibition: This is a way to suppress certain notifications to avoid spamming similar alerts that are already active and fired. inhibit_rules block can be used to write inhibition rules.
- Silencing: Alerts can be muted for a specified duration, such as during a maintenance window or a planned outage. Incoming alerts are verified for matching all equality or regular expression before silencing the alert. PutAlertManagerSilences API can be used to create silencing.
Route alerts through Amazon Simple Notification Service (SNS)
Currently Amazon Managed Service for Prometheus Alert Manager supports Amazon SNS as the only receiver. The key section in the alertmanager_config block is the receivers, which lets customers configure Amazon SNS to receive alerts. The following section can be used as a template for the receivers block.
- name: name_of_receiver
  sns_configs:
    - sigv4:
        region: <AWS_Region>
    topic_arn: <ARN_of_SNS_topic>
    subject: somesubject
    attributes:
       key: <somekey>
       value: <somevalue>
The Amazon SNS configuration uses the following template as default unless its explicitly overridden.
{{ define "sns.default.message" }}{{ .CommonAnnotations.SortedPairs.Values | join " " }}
  {{ if gt (len .Alerts.Firing) 0 -}}
  Alerts Firing:
    {{ template "__text_alert_list" .Alerts.Firing }}
  {{- end }}
  {{ if gt (len .Alerts.Resolved) 0 -}}
  Alerts Resolved:
    {{ template "__text_alert_list" .Alerts.Resolved }}
  {{- end }}
{{- end }}
Additional Reference: Notification Template Examples
Routing alerts to other destinations beyond Amazon SNS
Amazon Managed Service for Prometheus Alert Manager can use Amazon SNS to connect to other destinations such as email, webhook (HTTP), Slack, PageDuty, and OpsGenie.
- Email A successful notification will result in an email received from Amazon Managed Service for Prometheus Alert Manager through Amazon SNS topic with the alert details as one of the targets.
- Amazon Managed Service for Prometheus Alert Manager can send alerts in JSON format, so that they can be processed downstream from Amazon SNS in AWS Lambda or in webhook-receiving endpoints.
- Webhook An existing Amazon SNS topic can be configured to output messages to a webhook endpoint. Webhooks are messages in serialized form-encoded JSON or XML formats, exchanged over HTTP between applications based on event driven triggers. This can be used to hook any existing SIEM or collaboration tools for alerting, ticketing or incident management systems.
- Slack Customers can integrate with Slack’s email-to-channel integration where Slack can accept an email and forward it to a Slack channel, or use a Lambda function to rewrite the SNS notification to Slack.
- PagerDuty The template used in
template_filesblock in thealertmanager_configdefinition can be customized to send the payload to PagerDuty as a destination of Amazon SNS.
Additional Reference: Custom Alert manager Templates
Alert status
Alerting rules define alert conditions based on expressions to send alerts to any notification service, whenever the set threshold is crossed. An example rule and its expression is shown below.
rules:
- alert: metric:alerting_rule
  expr: avg(rate(container_cpu_usage_seconds_total[5m])) > 0
  for: 2m
Whenever the alert expression results in one or more vector elements at a given point in time, the alert counts as active. The alerts take active (pending | firing) or resolved status.
- Pending: The time elapsed since threshold breach is less than the recording interval
- Firing: The time elapsed since threshold breach is more than the recording interval and Alert Manager is routing alerts.
- Resolved: The alert is no longer firing because the threshold is no longer breached.
This can be manually verified by querying the Amazon Managed Service for Prometheus Alert Manager endpoint with ListAlerts API using awscurl command. A sample request is shown below.
awscurl https://aps-workspaces.us-east-1.amazonaws.com/workspaces/$WORKSPACE_ID/alertmanager/api/v2/alerts --service="aps" -H "Content-Type: application/json"
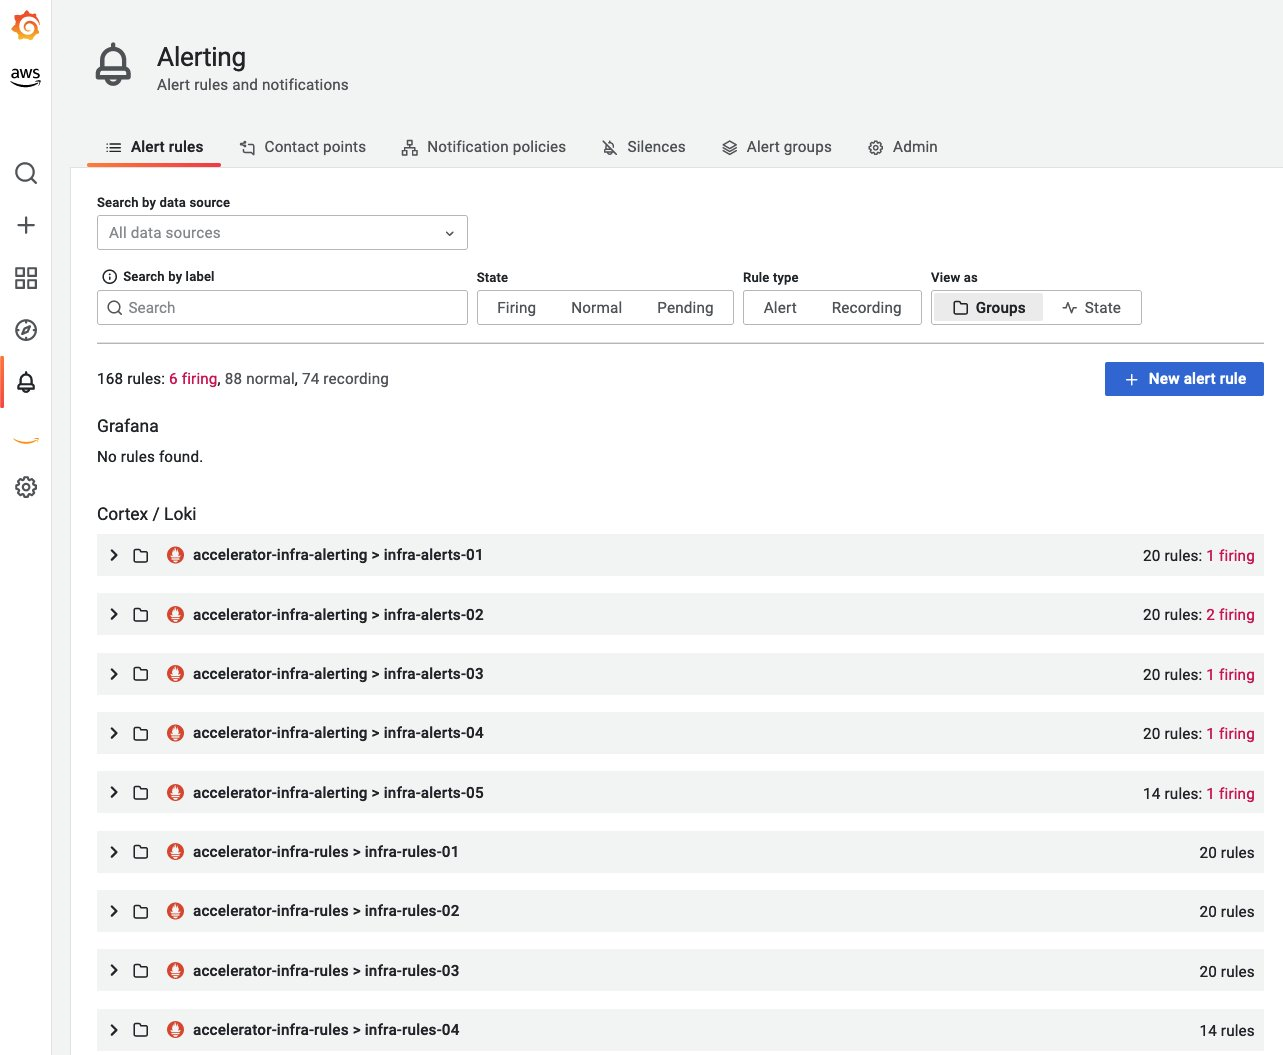
Amazon Managed Service for Prometheus Alert Manager rules in Amazon Managed Grafana
Amazon Managed Grafana (AMG) alerting feature allows customers to gain visibility into Amazon Managed Service for Prometheus Alert Manager alerts from their Amazon Managed Grafana workspace. Customers using the Amazon Managed Service for Prometheus workspaces to collect Prometheus metrics utilize the fully managed Alert Manager and Ruler features in the service to configure alerting and recording rules. With this feature, they can visualize all their alert and recording rules configured in their Amazon Managed Service for Prometheus workspace. Prometheus alerts view can be in Amazon Managed Grafana (AMG) console by checking the Grafana alerting checkbox in the Workspace configuration options tab. Once enabled, this will also migrate native Grafana alerts that were previously created in Grafana dashboards into a new Alerting page in the Grafana workspace.
Reference: Announcing Prometheus Alert manager rules in Amazon Managed Grafana
Recommended alerts for a baseline monitoring
Alerting is a key aspect of robust monitoring and observability best practices. The alerting mechanism should strike a balance between alert fatigue and missing critical alerts. Here are some of the alerts that are recommended to improve the overall reliability of the workloads. Various teams in the organization look at monitoring their infrastructure and workloads from different perspectives and hence this could be expanded or changed based on the requirement and scenario & certainly this is not a comprehensive list.
- Container Node is using more than certain (ex. 80%) allocated memory limit.
- Container Node is using more than certain (ex. 80%) allocated CPU limit.
- Container Node is using more than certain (ex. 90%) allocated disk space.
- Container in pod in namespace is using more than certain (ex. 80%) allocated CPU limit.
- Container in pod in namespace is using more than certain (ex. 80%) of memory limit.
- Container in pod in namespace had too many restarts.
- Persistent Volume in a namespace is using more than certain (max 75%) disk space.
- Deployment is currently having no active pods running
- Horizontal Pod Autoscaler (HPA) in namespace is running at max capacity
The essential thing in setting up alerts for the above or any similar scenario will require the expression to be changed as needed. For example,
expr: |
        ((sum(irate(container_cpu_usage_seconds_total{image!="",container!="POD", namespace!="kube-sys"}[30s])) by (namespace,container,pod) /
sum(container_spec_cpu_quota{image!="",container!="POD", namespace!="kube-sys"} /
container_spec_cpu_period{image!="",container!="POD", namespace!="kube-sys"}) by (namespace,container,pod) ) * 100)  > 80
      for: 5m
ACK Controller for Amazon Managed Service for Prometheus
Amazon Managed Service for Prometheus AWS Controller for Kubernetes (ACK) controller is available for Workspace, Alert Manager and Ruler resources which lets customers take advantage of Prometheus using custom resource definitions (CRDs) and native objects or services that provide supporting capabilities without having to define any resources outside of Kubernetes cluster. The ACK controller for Amazon Managed Service for Prometheus can be used to manage all resources directly from the Kubernetes cluster that you’re monitoring, allowing Kubernetes to act as your ‘source of truth’ for your workload’s desired state. ACK is a collection of Kubernetes CRDs and custom controllers working together to extend the Kubernetes API and manage AWS resources.
A snippet of alerting rules configured using ACK is shown below:
apiVersion: prometheusservice.services.k8s.aws/v1alpha1
kind: RuleGroupsNamespace
metadata:
  name: default-rule
spec:
  workspaceID: WORKSPACE-ID
  name: default-rule
  configuration: |
    groups:
    - name: example
      rules:
      - alert: HostHighCpuLoad
        expr: 100 - (avg(rate(node_cpu_seconds_total{mode="idle"}[2m])) * 100) > 60
        for: 5m
        labels:
          severity: warning
          event_type: scale_up
        annotations:
          summary: Host high CPU load (instance {{ $labels.instance }})
          description: "CPU load is > 60%\n  VALUE = {{ $value }}\n  LABELS = {{ $labels }}"
      - alert: HostLowCpuLoad
        expr: 100 - (avg(rate(node_cpu_seconds_total{mode="idle"}[2m])) * 100) < 30
        for: 5m
        labels:
          severity: warning
          event_type: scale_down
        annotations:
          summary: Host low CPU load (instance {{ $labels.instance }})
          description: "CPU load is < 30%\n  VALUE = {{ $value }}\n  LABELS = {{ $labels }}"
Restricting access to rules using IAM policy
Organizations require various teams to have their own rules to be created & administered for their recording and alerting requirements. Rules management in Amazon Managed Service for Prometheus allows rules to be access controlled using AWS Identity and Access Management (IAM) policy so that each team can control their own set of rules & alerts grouped by rulegroupnamespaces.
The below image shows two example rulegroupnamespaces called devops and engg added into Rules management of Amazon Managed Service for Prometheus.
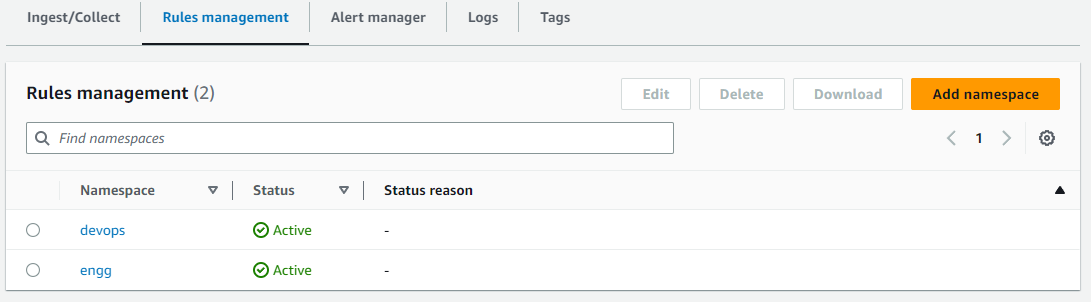
The below JSON is a sample IAM policy which restricts access to the devops rulegroupnamespace (shown above) with the Resource ARN specified. The notable actions in the below IAM policy are PutRuleGroupsNamespace and DeleteRuleGroupsNamespace which are restricted to the specified Resource ARN of the rulegroupsnamespace of AMP workspace. Once the policy is created, it can be assigned to any required user, group or role for desired access control requirement. The Action in the IAM policy can be modified/restricted as required based on IAM permissions for required & allowable actions.
{
  "Version": "2012-10-17",
  "Statement": [
    {
      "Sid": "VisualEditor0",
      "Effect": "Allow",
      "Action": [
        "aps:RemoteWrite",
        "aps:DescribeRuleGroupsNamespace",
        "aps:PutRuleGroupsNamespace",
        "aps:DeleteRuleGroupsNamespace"
      ],
      "Resource": [
        "arn:aws:aps:us-west-2:XXXXXXXXXXXX:workspace/ws-8da31ad6-f09d-44ff-93a3-xxxxxxxxxx",
        "arn:aws:aps:us-west-2:XXXXXXXXXXXX:rulegroupsnamespace/ws-8da31ad6-f09d-44ff-93a3-xxxxxxxxxx/devops"
      ]
    }
  ]
}
The below awscli interaction shows an example of an IAM user having restricted access to a rulegroupsnamespace specified through Resource ARN (i.e. devops rulegroupnamespace) in IAM policy and how the same user is denied access to other resources (i.e. engg rulegroupnamespace) not having access.
$ aws amp describe-rule-groups-namespace --workspace-id ws-8da31ad6-f09d-44ff-93a3-xxxxxxxxxx --name devops
{
    "ruleGroupsNamespace": {
        "arn": "arn:aws:aps:us-west-2:XXXXXXXXXXXX:rulegroupsnamespace/ws-8da31ad6-f09d-44ff-93a3-xxxxxxxxxx/devops",
        "createdAt": "2023-04-28T01:50:15.408000+00:00",
        "data": "Z3JvdXBzOgogIC0gbmFtZTogZGV2b3BzX3VwZGF0ZWQKICAgIHJ1bGVzOgogICAgLSByZWNvcmQ6IG1ldHJpYzpob3N0X2NwdV91dGlsCiAgICAgIGV4cHI6IGF2ZyhyYXRlKGNvbnRhaW5lcl9jcHVfdXNhZ2Vfc2Vjb25kc190b3RhbFsybV0pKQogICAgLSBhbGVydDogaGlnaF9ob3N0X2NwdV91c2FnZQogICAgICBleHByOiBhdmcocmF0ZShjb250YWluZXJfY3B1X3VzYWdlX3NlY29uZHNfdG90YWxbNW1dKSkKICAgICAgZm9yOiA1bQogICAgICBsYWJlbHM6CiAgICAgICAgICAgIHNldmVyaXR5OiBjcml0aWNhbAogIC0gbmFtZTogZGV2b3BzCiAgICBydWxlczoKICAgIC0gcmVjb3JkOiBjb250YWluZXJfbWVtX3V0aWwKICAgICAgZXhwcjogYXZnKHJhdGUoY29udGFpbmVyX21lbV91c2FnZV9ieXRlc190b3RhbFs1bV0pKQogICAgLSBhbGVydDogY29udGFpbmVyX2hvc3RfbWVtX3VzYWdlCiAgICAgIGV4cHI6IGF2ZyhyYXRlKGNvbnRhaW5lcl9tZW1fdXNhZ2VfYnl0ZXNfdG90YWxbNW1dKSkKICAgICAgZm9yOiA1bQogICAgICBsYWJlbHM6CiAgICAgICAgc2V2ZXJpdHk6IGNyaXRpY2FsCg==",
        "modifiedAt": "2023-05-01T17:47:06.409000+00:00",
        "name": "devops",
        "status": {
            "statusCode": "ACTIVE",
            "statusReason": ""
        },
        "tags": {}
    }
}


$ cat > devops.yaml <<EOF
> groups:
>  - name: devops_new
>    rules:
>   - record: metric:host_cpu_util
>     expr: avg(rate(container_cpu_usage_seconds_total[2m]))
>   - alert: high_host_cpu_usage
>     expr: avg(rate(container_cpu_usage_seconds_total[5m]))
>     for: 5m
>     labels:
>            severity: critical
>  - name: devops
>    rules:
>    - record: container_mem_util
>      expr: avg(rate(container_mem_usage_bytes_total[5m]))
>    - alert: container_host_mem_usage
>      expr: avg(rate(container_mem_usage_bytes_total[5m]))
>      for: 5m
>      labels:
>        severity: critical
> EOF


$ base64 devops.yaml > devops_b64.yaml


$ aws amp put-rule-groups-namespace --workspace-id ws-8da31ad6-f09d-44ff-93a3-xxxxxxxxxx --name devops --data file://devops_b64.yaml
{
    "arn": "arn:aws:aps:us-west-2:XXXXXXXXXXXX:rulegroupsnamespace/ws-8da31ad6-f09d-44ff-93a3-xxxxxxxxxx/devops",
    "name": "devops",
    "status": {
        "statusCode": "UPDATING"
    },
    "tags": {}
}
$ aws amp describe-rule-groups-namespace --workspace-id ws-8da31ad6-f09d-44ff-93a3-xxxxxxxxxx --name engg An error occurred (AccessDeniedException) when calling the DescribeRuleGroupsNamespace operation: User: arn:aws:iam::XXXXXXXXXXXX:user/amp_ws_user is not authorized to perform: aps:DescribeRuleGroupsNamespace on resource: arn:aws:aps:us-west-2:XXXXXXXXXXXX:rulegroupsnamespace/ws-8da31ad6-f09d-44ff-93a3-xxxxxxxxxx/engg
$ aws amp put-rule-groups-namespace --workspace-id ws-8da31ad6-f09d-44ff-93a3-xxxxxxxxxx --name engg --data file://devops_b64.yaml An error occurred (AccessDeniedException) when calling the PutRuleGroupsNamespace operation: User: arn:aws:iam::XXXXXXXXXXXX:user/amp_ws_user is not authorized to perform: aps:PutRuleGroupsNamespace on resource: arn:aws:aps:us-west-2:XXXXXXXXXXXX:rulegroupsnamespace/ws-8da31ad6-f09d-44ff-93a3-xxxxxxxxxx/engg
$ aws amp delete-rule-groups-namespace --workspace-id ws-8da31ad6-f09d-44ff-93a3-xxxxxxxxxx --name engg An error occurred (AccessDeniedException) when calling the DeleteRuleGroupsNamespace operation: User: arn:aws:iam::XXXXXXXXXXXX:user/amp_ws_user is not authorized to perform: aps:DeleteRuleGroupsNamespace on resource: arn:aws:aps:us-west-2:XXXXXXXXXXXX:rulegroupsnamespace/ws-8da31ad6-f09d-44ff-93a3-xxxxxxxxxx/engg
The user permissions to use rules can also be restricted using an IAM policy (documentation sample).
For more information customers can read the AWS Documentation, go through the AWS Observability Workshop on Amazon Managed Service for Prometheus Alert Manager.
Additional Reference: Amazon Managed Service for Prometheus Is Now Generally Available with Alert Manager and Ruler