key-performance-indicators
1.0 Understanding KPIs ("Golden Signals")
Organizations utilize key performance indicators (KPIs) a.k.a 'Golden Signals' that provide insight into the health or risk of the business and operations. Different parts of an organization would have unique KPIs that cater to measurement of their respective outcomes. For example, the product team of an eCommerce application would track the ability to process cart orders successfully as its KPI. An on-call operations team would measure their KPI as mean-time to detect (MTTD) an incident. For the financial team a KPI for cost of resources under budget is important.
Service Level Indicators (SLIs), Service Level Objectives (SLOs), and Service Level Agreements (SLAs) are essential components of service reliability management. This guide outlines best practices for using Amazon CloudWatch and its features to calculate and monitor SLIs, SLOs, and SLAs, with clear and concise examples.
- SLI (Service Level Indicator): A quantitative measure of a service's performance.
- SLO (Service Level Objective): The target value for an SLI, representing the desired performance level.
- SLA (Service Level Agreement): A contract between a service provider and its users specifying the expected level of service.
Examples of common SLIs:
- Availability: Percentage of time a service is operational
- Latency: Time taken to fulfill a request
- Error rate: Percentage of failed requests
2.0 Discover customer and stakeholder requirements (using template as suggested below)
- Start with the top question: “What is the business value or business problem in scope for the given workload (ex. Payment portal, eCommerce order placement, User registration, Data reports, Support portal etc)
- Break down the business value into categories such as User-Experience (UX); Business-Experience (BX); Operational-Experience (OpsX); Security-Experience(SecX); Developer-Experience (DevX)
- Derive core signals aka “Golden Signals” for each category; the top signals around UX & BX will typically construe the business metrics
| ID | Initials | Customer | Business Needs | Measurements | Information Sources | What does good look like? | Alerts | Dashboards | Reports |
|---|---|---|---|---|---|---|---|---|---|
| M1 | Example | External End User | User Experience | Response time (Page latency) | Logs / Traces | < 5s for 99.9% | No | Yes | No |
| M2 | Example | Business | Availability | Successful RPS (Requests per second) | Health Check | >85% in 5 min window | Yes | Yes | Yes |
| M3 | Example | Security | Compliance | Critical non-compliant resources | Config data | <10 under 15 days | No | Yes | Yes |
| M4 | Example | Developers | Agility | Deployment time | Deployment logs | Always < 10 min | Yes | No | Yes |
| M5 | Example | Operators | Capacity | Queue Depth | App logs/metrics | Always < 10 | Yes | Yes | Yes |
2.1 Golden Signals
| Category | Signal | Notes | References |
|---|---|---|---|
| UX | Performance (Latency) | See M1 in template | Whitepaper: Availability and Beyond (Measuring latency) |
| BX | Availability | See M2 in template | Whitepaper: Avaiability and Beyond (Measuring availability) |
| BX | Business Continuity Plan (BCP) | Amazon Resilience Hub (ARH) resilience score against defined RTO/RPO | Docs: ARH user guide (Understanding resilience scores) |
| SecX | (Non)-Compliance | See M3 in template | Docs: AWS Control Tower user guide (Compliance status in the console) |
| DevX | Agility | See M4 in template | Docs: DevOps Monitoring Dashboard on AWS (DevOps metrics list) |
| OpsX | Capacity (Quotas) | See M5 in template | Docs: Amazon CloudWatch user guide (Visualizing your service quotas and setting alarms) |
| OpsX | Budget Anomalies | Docs: 1. AWS Billing and Cost Management (AWS Cost Anomaly Detection) 2. AWS Budgets |
3.0 Top Level Guidance ‘TLG’
3.1 TLG General
-
Work with business, architecture and security teams to help refine the business, compliance and governance requirements and ensure they accurately reflect the business needs. This includes establishing recovery-time and recovery-point targets (RTOs, RPOs). Formulate methods to measure requirements such as measuring availability and latency (ex. Uptime could allow a small percentage of faults over a 5 min window).
-
Build an effective tagging strategy with purpose built schema that aligns to various business functional outcomes. This should especially cover operational observability and incident management.
-
Where possible leverage dynamic thresholds for alarms (esp. for metrics that do not have baseline KPIs) using CloudWatch anomaly detection which provides machine learning algorithms to establish the baselines. When utilizing AWS available services that publish CW metrics (or other sources like prometheus metrics) to configure alarms consider creating composite alarms to reduce alarm noise. Example: a composite alarm that comprises of a business metric indicative of availability (tracked by successful requests) and latency when configured to alarm when both drop below a critical threshold during deployments could be deterministic indicator of deployment bug.
-
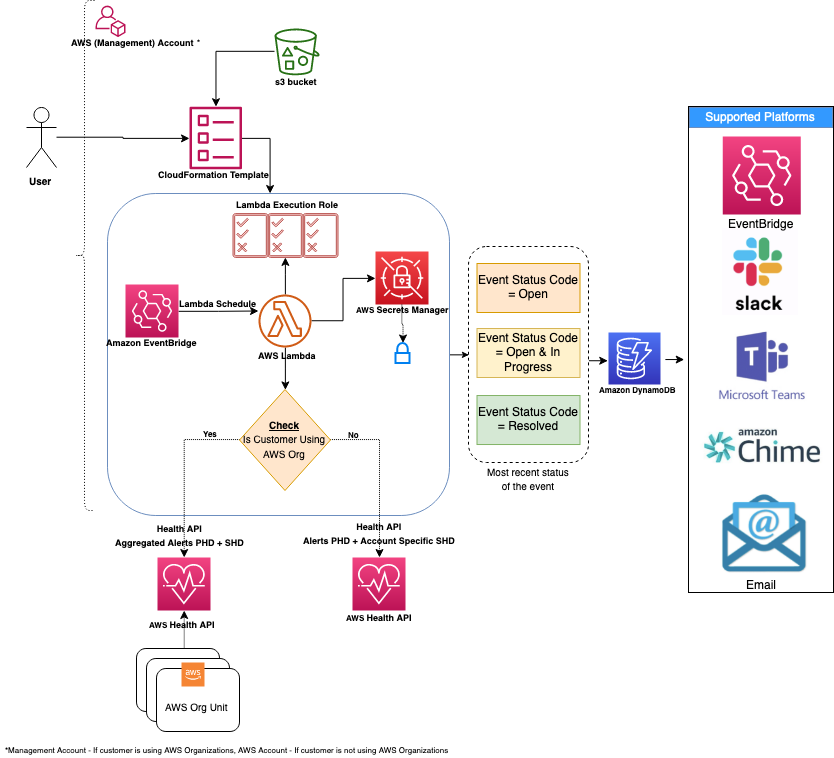
(NOTE: Requires AWS Business support or higher) AWS publishes events of interest using AWS Health service related to your resources in Personal Health Dashboard. Leverage AWS Health Aware (AHA) framework (that uses AWS Health) to ingest proactive and real-time alerts aggregated across your AWS Organization from a central account (such as a management account). These alerts can be sent to preferred communication platforms such as Slack and integrates with ITSM tools like ServiceNow and Jira.
-
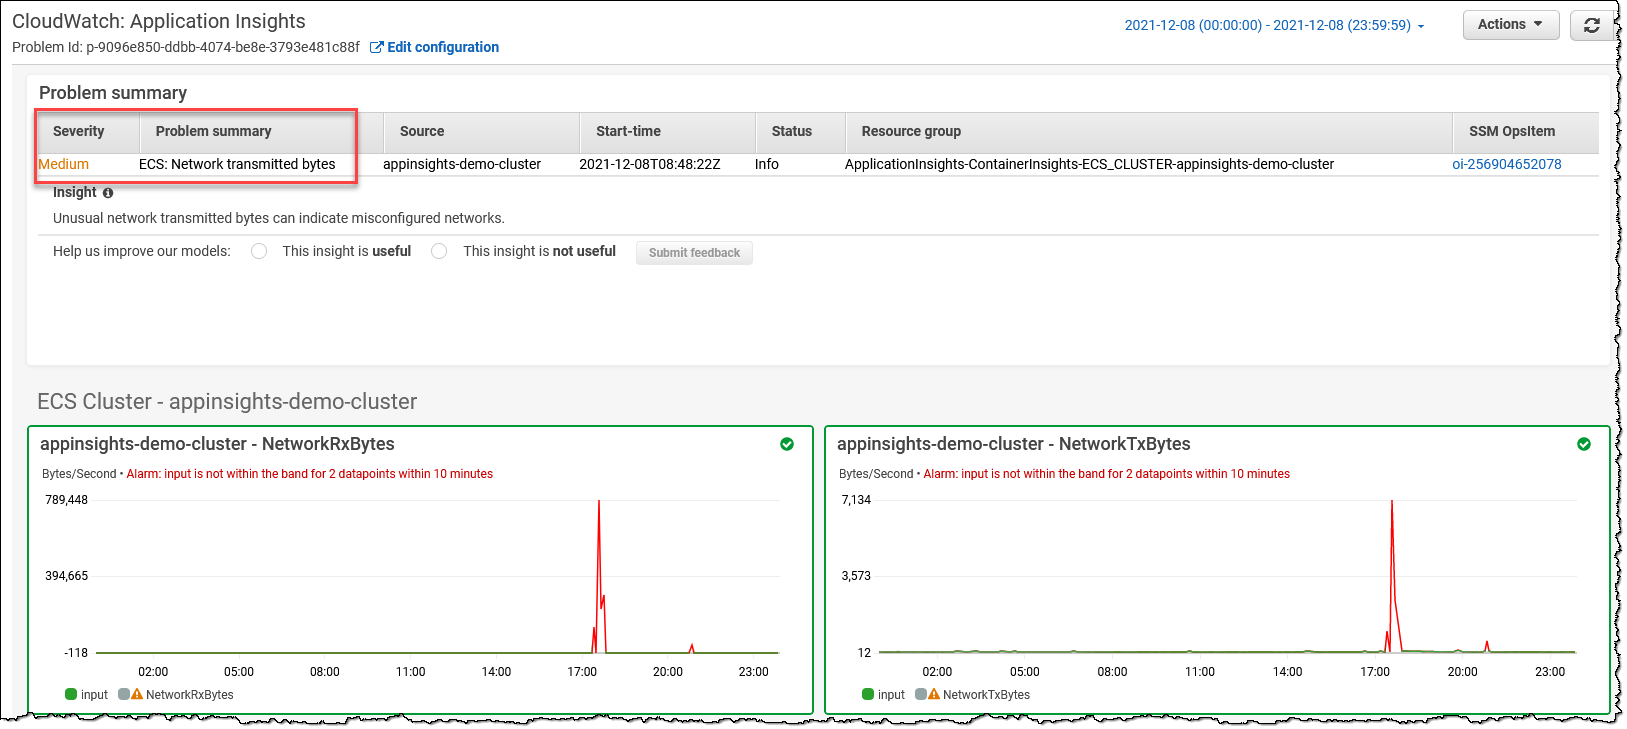
Leverage Amazon CloudWatch Application Insights to setup best monitors for resources and continuously analyze data for signs of problems with your applications. It also provides automated dashboards that show potential problems with monitored applications to quickly isolate/troubleshoot application/infrastructure issues. Leverage Container Insights to aggregate metrics and logs from containers and can be integrated seamlessly with CloudWatch Application Insights.
-
Leverage AWS Resilience Hub to analyze applications against defined RTOs and RPOs. Validate if the availability, latency and business continuity requirements are met by using controlled experiments using tools like AWS Fault Injection Simulator. Conduct additional Well-Architected reviews and service specific deep-dives to ensure workloads are designed to meet business requirements following AWS best practices.
-
For further details refer to other sections of AWS Observability Best Practices guidance, AWS Cloud Adoption Framework: Operations Perspective whitepaper and AWS Well-Architected Framework Operational Excellence Pillar whitepaper content on 'Understading workload health'.
3.2 TLG by Domain (emphasis on business metrics i.e. UX, BX)
Suitable examples are provided below using services such as CloudWatch (CW) (Ref: AWS Services that publish CloudWatch metrics documentation)
3.2.1 Canaries (aka Synthetic transactions) and Real-User Monitoring (RUM)
- TLG: One of the easiest and most effective ways to understand client/customer experience is to simulate customer traffic with Canaries (Synthetic transactions) which regularly probes your services and records metrics.
| AWS Service | Feature | Measurement | Metric | Example | Notes |
|---|---|---|---|---|---|
| CW | Synthetics | Availability | SuccessPercent | (Ex. SuccessPercent > 90 or CW Anomaly Detection for 1min Period) **[Metric Math where m1 is SuccessPercent if Canaries run each weekday 7a-8a (CloudWatchSynthetics): ** IF(((DAY(m1)<6) AND (HOUR(m1)>7 AND HOUR(m1)<8)),m1)] | |
| CW | Synthetics | Availability | VisualMonitoringSuccessPercent | (Ex. VisualMonitoringSuccessPercent > 90 for 5 min Period for UI screenshot comparisons) **[Metric Math where m1 is SuccessPercent if Canaries run each weekday 7a-8a (CloudWatchSynthetics): ** IF(((DAY(m1)<6) AND (HOUR(m1)>7 AND HOUR(m1)<8)),m1) | If customer expects canary to match predetermined UI screenshot |
| CW | RUM | Response Time | Apdex Score | (Ex. Apdex score: NavigationFrustratedCount < ‘N’ expected value) | |
3.2.2 API Frontend
| AWS Service | Feature | Measurement | Metric | Example | Notes |
|---|---|---|---|---|---|
| CloudFront | Availability | Total error rate | (Ex. [Total error rate] < 10 or CW Anomaly Detection for 1min Period) | Availability as a measure of error rate | |
| CloudFront | (Requires turning on additional metrics) | Peformance | Cache hit rate | (Ex.Cache hit rate < 10 CW Anomaly Detection for 1min Period) | |
| Route53 | Health checks | (Cross region) Availability | HealthCheckPercentageHealthy | (Ex. [Minimum of HealthCheckPercentageHealthy] > 90 or CW Anomaly Detection for 1min Period) | |
| Route53 | Health checks | Latency | TimeToFirstByte | (Ex. [p99 TimeToFirstByte] < 100 ms or CW Anomaly Detection for 1min Period) | |
| API Gateway | Availability | Count | (Ex. [(4XXError + 5XXError) / Count) * 100] < 10 or CW Anomaly Detection for 1min Period) | Availability as a measure of "abandoned" requests | |
| API Gateway | Latency | Latency (or IntegrationLatency i.e. backend latency) | (Ex. p99 Latency < 1 sec or CW Anomaly Detection for 1min Period) | p99 will have greater tolerance than lower percentile like p90. (p50 is same as average) | |
| API Gateway | Performance | CacheHitCount (and Misses) | (Ex. [CacheMissCount / (CacheHitCount + CacheMissCount) * 100] < 10 or CW Anomaly Detection for 1min Period) | Performance as a measure of Cache (Misses) | |
| Application Load Balancer (ALB) | Availability | RejectedConnectionCount | (Ex.[RejectedConnectionCount/(RejectedConnectionCount + RequestCount) * 100] < 10 CW Anomaly Detection for 1min Period) | Availability as a measure of rejected requests due to max connections breached | |
| Application Load Balancer (ALB) | Latency | TargetResponseTime | (Ex. p99 TargetResponseTime < 1 sec or CW Anomaly Detection for 1min Period) | p99 will have greater tolerance than lower percentile like p90. (p50 is same as average) | |
3.2.3 Serverless
| AWS Service | Feature | Measurement | Metric | Example | Notes |
|---|---|---|---|---|---|
| S3 | Request metrics | Availability | AllRequests | (Ex. [(4XXErrors + 5XXErrors) / AllRequests) * 100] < 10 or CW Anomaly Detection for 1min Period) | Availability as a measure of "abandoned" requests |
| S3 | Request metrics | (Overall) Latency | TotalRequestLatency | (Ex. [p99 TotalRequestLatency] < 100 ms or CW Anomaly Detection for 1min Period) | |
| DynamoDB (DDB) | Availability | ThrottledRequests | (Ex. [ThrottledRequests] < 100 or CW Anomaly Detection for 1min Period) | Availability as a measure of "throttled" requests | |
| DynamoDB (DDB) | Latency | SuccessfulRequestLatency | (Ex. [p99 SuccessfulRequestLatency] < 100 ms or CW Anomaly Detection for 1min Period) | ||
| Step Functions | Availability | ExecutionsFailed | (Ex. ExecutionsFailed = 0) **[ex. Metric Math where m1 is ExecutionsFailed (Step function Execution) UTC time: IF(((DAY(m1)<6 OR ** ** DAY(m1)==7) AND (HOUR(m1)>21 AND HOUR(m1)<7)),m1)] | Assuming business flow that requests completion of step functions as a daily operation 9p-7a during weekdays (start of day business operations) | |
3.2.4 Compute and Containers
| AWS Service | Feature | Measurement | Metric | Example | Notes |
|---|---|---|---|---|---|
| EKS | Prometheus metrics | Availability | APIServer Request Success Ratio | (ex. Prometheus metric like APIServer Request Success Ratio) | See best practices for monitoring EKS control plane metrics and EKS observability for details. |
| EKS | Prometheus metrics | Performance | apiserver_request_duration_seconds, etcd_request_duration_seconds | apiserver_request_duration_seconds, etcd_request_duration_seconds | |
| ECS | Availability | Service RUNNING task count | Service RUNNING task count | See ECS CW metrics documentation | |
| ECS | Performance | TargetResponseTime | (ex. [p99 TargetResponseTime] < 100 ms or CW Anomaly Detection for 1min Period) | See ECS CW metrics documentation | |
| EC2 (.NET Core) | CW Agent Performance Counters | Availability | (ex. ASP.NET Application Errors Total/Sec < 'N') | (ex. ASP.NET Application Errors Total/Sec < 'N') | See EC2 CW Application Insights documentation |
3.2.5 Databases (RDS)
| AWS Service | Feature | Measurement | Metric | Example | Notes |
|---|---|---|---|---|---|
| RDS Aurora | Performance Insights (PI) | Availability | Average active sessions | (Ex. Average active serssions with CW Anomaly Detection for 1min Period) | See RDS Aurora CW PI documentation |
| RDS Aurora | Disaster Recovery (DR) | AuroraGlobalDBRPOLag | (Ex. AuroraGlobalDBRPOLag < 30000 ms for 1min Period) | See RDS Aurora CW documentation | |
| RDS Aurora | Performance | Commit Latency, Buffer Cache Hit Ratio, DDL Latency, DML Latency | (Ex. Commit Latency with CW Anomaly Detection for 1min Period) | See RDS Aurora CW PI documentation | |
| RDS (MSSQL) | PI | Performance | SQL Compilations | (Ex. SQL Compliations > 'M' for 5 min Period) | See RDS CW PI documentation |
4.0 Using Amazon CloudWatch and Metric Math for Calculating SLIs, SLOs, and SLAs
4.1 Amazon CloudWatch and Metric Math
Amazon CloudWatch provides monitoring and observability services for AWS resources. Metric Math allows you to perform calculations using CloudWatch metric data, making it an ideal tool for calculating SLIs, SLOs, and SLAs.
4.1.1 Enabling Detailed Monitoring
Enable Detailed Monitoring for your AWS resources to get 1-minute data granularity, allowing for more accurate SLI calculations.
4.1.2 Organizing Metrics with Namespaces and Dimensions
Use Namespaces and Dimensions to categorize and filter metrics for easier analysis. For example, use Namespaces to group metrics related to a specific service, and Dimensions to differentiate between various instances of that service.
4.2 Calculating SLIs with Metric Math
4.2.1 Availability
To calculate availability, divide the number of successful requests by the total number of requests:
availability = 100 * (successful_requests / total_requests)
Example:
Suppose you have an API Gateway with the following metrics:
4XXError: Number of 4xx client errors5XXError: Number of 5xx server errorsCount: Total number of requests
Use Metric Math to calculate the availability:
availability = 100 * ((Count - 4XXError - 5XXError) / Count)
4.2.2 Latency
To calculate average latency, use the SampleCount and Sum statistics provided by CloudWatch:
average_latency = Sum / SampleCount
Example:
Suppose you have a Lambda function with the following metric:
Duration: Time taken to execute the function
Use Metric Math to calculate the average latency:
average_latency = Duration.Sum / Duration.SampleCount
4.2.3 Error Rate
To calculate the error rate, divide the number of failed requests by the total number of requests:
error_rate = 100 * (failed_requests / total_requests)
Example:
Using the API Gateway example from before:
error_rate = 100 * ((4XXError + 5XXError) / Count)
4.4 Defining and Monitoring SLOs
4.4.1 Setting Realistic Targets
Define SLO targets based on user expectations and historical performance data. Set achievable targets to ensure a balance between service reliability and resource utilization.
4.4.2 Monitoring SLOs with CloudWatch
Create CloudWatch Alarms to monitor your SLIs and notify you when they approach or breach SLO targets. This enables you to proactively address issues and maintain service reliability.
4.4.3 Reviewing and Adjusting SLOs
Periodically review your SLOs to ensure they remain relevant as your service evolves. Adjust targets if necessary and communicate any changes to stakeholders.
4.5 Defining and Measuring SLAs
4.5.1 Setting Realistic Targets
Define SLA targets based on historical performance data and user expectations. Set achievable targets to ensure a balance between service reliability and resource utilization.
4.5.2 Monitoring and Alerting
Set up CloudWatch Alarms to monitor SLIs and notify you when they approach or breach SLA targets. This enables you to proactively address issues and maintain service reliability.
4.5.3 Regularly Reviewing SLAs
Periodically review SLAs to ensure they remain relevant as your service evolves. Adjust targets if necessary and communicate any changes to stakeholders.
4.6 Measuring SLA or SLO Performance Over a Set Period
To measure SLA or SLO performance over a set period, such as a calendar month, use CloudWatch metric data with custom time ranges.
Example:
Suppose you have an API Gateway with an SLO target of 99.9% availability. To measure the availability for the month of April, use the following Metric Math expression:
availability = 100 * ((Count - 4XXError - 5XXError) / Count)
Then, configure the CloudWatch metric data query with a custom time range:
- Start Time:
2023-04-01T00:00:00Z - End Time:
2023-04-30T23:59:59Z - Period:
2592000(30 days in seconds)
Finally, use the AVG statistic to calculate the average availability over the month. If the average availability is equal to or greater than the SLO target, you have met your objective.
5.0 Summary
Key Performance Indicators (KPIs) a.k.a 'Golden Signals' must align to business and stake-holder requirements. Calculating SLIs, SLOs, and SLAs using Amazon CloudWatch and Metric Math is crucial for managing service reliability. Follow the best practices outlined in this guide to effectively monitor and maintain the performance of your AWS resources. Remember to enable Detailed Monitoring, organize metrics with Namespaces and Dimensions, use Metric Math for SLI calculations, set realistic SLO and SLA targets, and establish monitoring and alerting systems with CloudWatch Alarms. By applying these best practices, you can ensure optimal service reliability, better resource utilization, and improved customer satisfaction.