Databricks Monitoring and Observability Best Practices in AWS
Databricks is a platform for managing data analytics and AI/ML workloads. This guide aim at supporting customers running Databricks on AWS with monitoring these workloads using AWS Native services for observability or OpenSource Managed Services.
Why monitor Databricks
Operation teams managing Databricks clusters benefit from having an integrated, customized dashboard to track workload status, errors, performance bottlenecks; alerting on unwanted behaviour, such as total resource usage over time, or percentual amount of errors; and centralized logging, for root cause analysis, as well as extracting additional customized metrics.
What to monitor
Databricks run Apache Spark in its cluster instances, which has native features to expose metrics. These metrics will give information regarding drivers, workers, and the workloads being executed in the cluster.
The instances running Spark will have additional useful information about storage, CPU, memory, and networking. It´s important to understand what external factors could be affecting the performance of a Databricks cluster. In the case of clusters with numerous instances, understanding bottlenecks and general health is important as well.
How to monitor
To install collectors and it's dependencies, Databricks init scripts will be needed. These are scripts that are runned in each instance of a Databricks cluster at boot time.
Databricks cluster permissions will also need permission to send metrics and logs using instance profiles.
Finally, it's a best practice to configure metrics namespace in Databricks cluster Spark configuration, replacing testApp with a proper reference to the cluster.
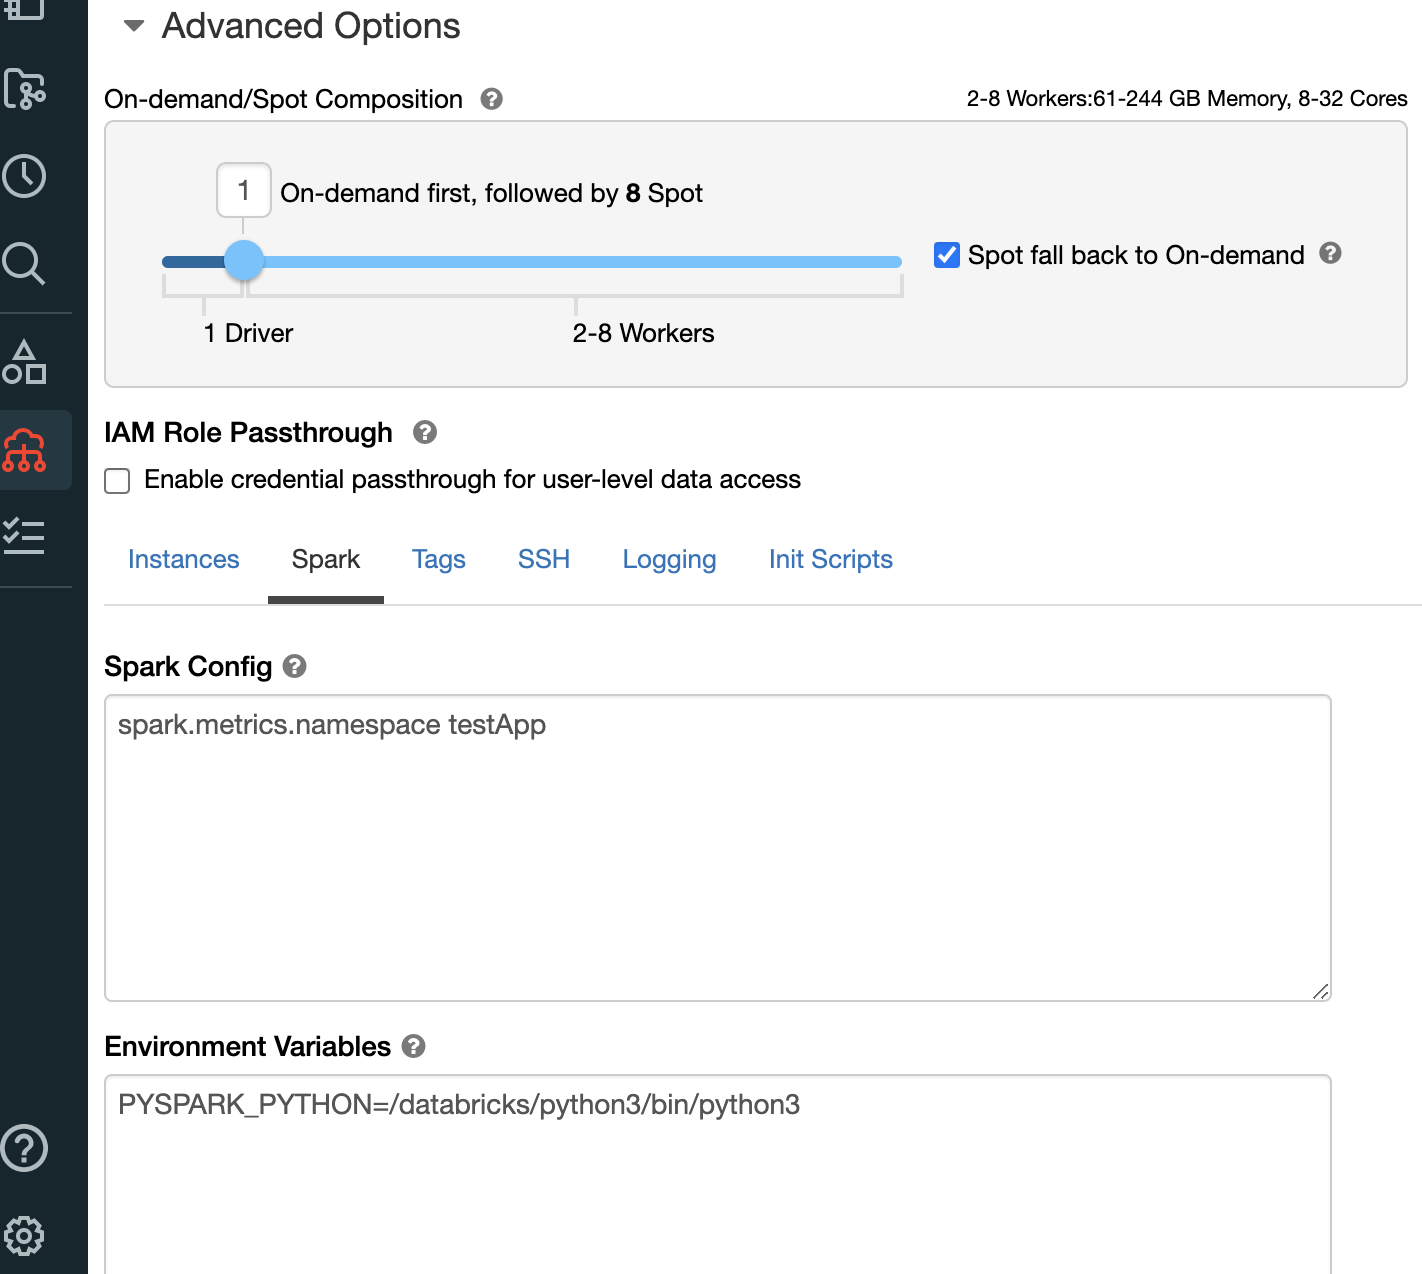 Figure 1: example of metrics namespace Spark configuration
Key parts of a good Observability solution for DataBricks
1) Metrics: Metrics are numbers that describe activity or a particular process measured over a period of time. Here are different types of metrics on Databricks:
System resource-level metrics, such as CPU, memory, disk, and network. Application Metrics using Custom Metrics Source, StreamingQueryListener, and QueryExecutionListener, Spark Metrics exposed by MetricsSystem.
2) Logs: Logs are a representation of serial events that have happened, and they tell a linear story about them. Here are different types of logs on Databricks:
- Event logs
- Audit logs
- Driver logs: stdout, stderr, log4j custom logs (enable structured logging)
- Executor logs: stdout, stderr, log4j custom logs (enable structured logging)
3) Traces: Stack traces provide end-to-end visibility, and they show the entire flow through stages. This is useful when you must debug to identify which stages/codes cause errors/performance issues.
4) Dashboards: Dashboards provide a great summary view of an application/service’s golden metrics.
5) Alerts: Alerts notify engineers about conditions that require attention.
AWS Native Observability options
Native solutions, such as Ganglia UI and Log Delivery, are great solutions for collecting system metrics and querying Apache Spark™ metrics. However, some areas can be improved:
- Ganglia doesn’t support alerts.
- Ganglia doesn’t support creating metrics derived from logs (e.g., ERROR log growth rate).
- You can’t use custom dashboards to track SLO (Service Level Objectives) and SLI (Service Level Indicators) related to data-correctness, data-freshness, or end-to-end latency, and then visualize them with ganglia.
Amazon CloudWatch is a critical tool for monitoring and managing your Databricks clusters on AWS. It provides valuable insights into cluster performance and helps you identify and resolve issues quickly. Integrating Databricks with CloudWatch and enabling structured logging can help improve those areas. CloudWatch Application Insights can help you automatically discover the fields contained in the logs, and CloudWatch Logs Insights provides a purpose-built query language for faster debugging and analysis.
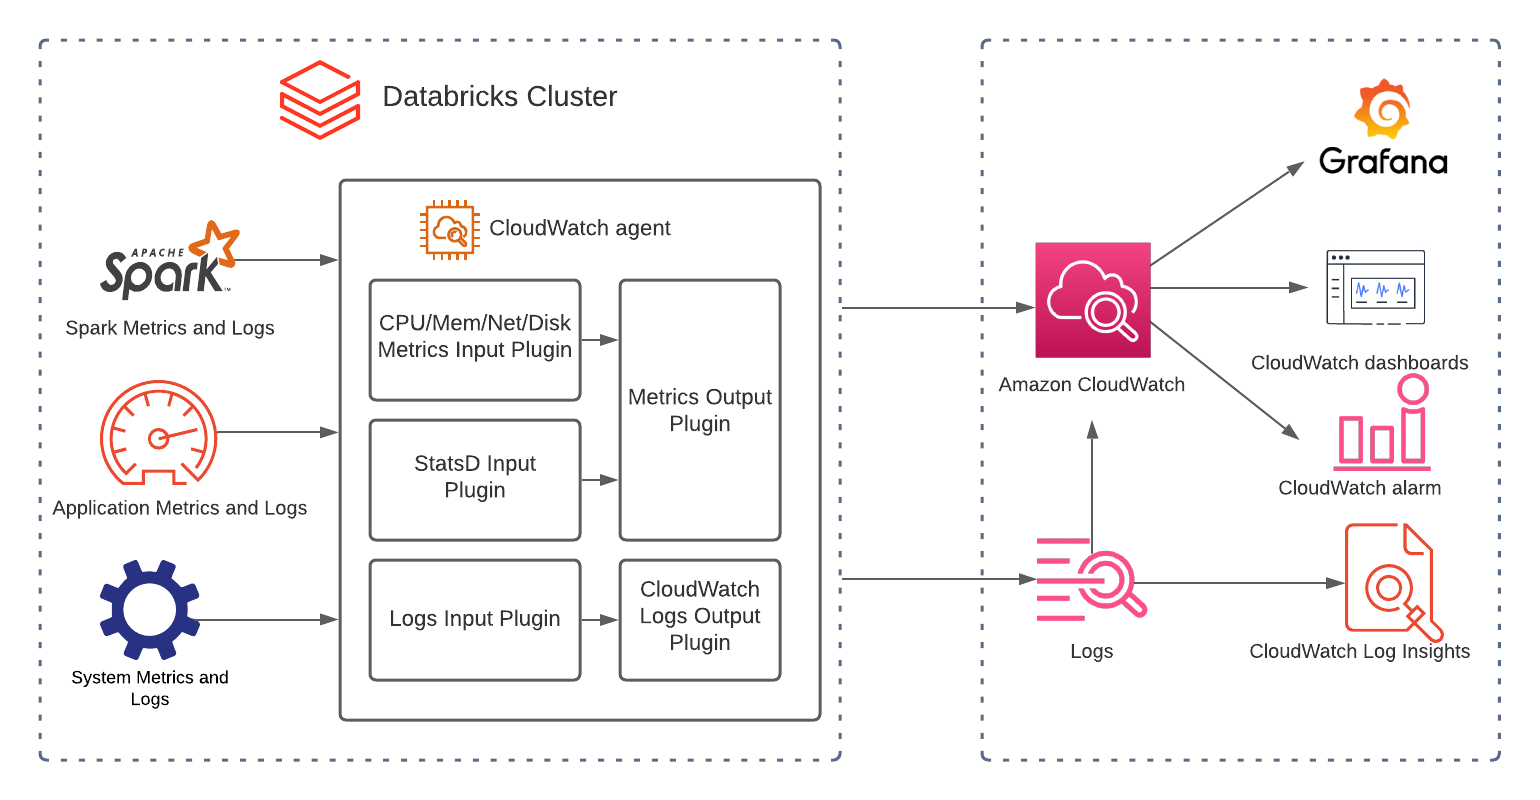 Figure 2: Databricks CloudWatch Architecture
For more informaton on how to use CloudWatch to monitor Databricks, see: How to Monitor Databricks with Amazon CloudWatch
Open-source software observability options
Amazon Managed Service for Prometheus is a Prometheus-compatible monitoring managed, serverless service, that will be responsible for storing metrics, and managing alerts created on top of these metrics. Prometheus is a popular open source monitoring technology, being the second project belonging to the Cloud Native Computing Foundation, right after Kubernetes.
Amazon Managed Grafana is a managed service for Grafana. Grafana is an open source technology for time-series data visualization, commonly used for observability. We can use Grafana to visualize data from several sources, such as Amazon Managed Service for Prometheus, Amazon CloudWatch, and many others. It will be used to visualize Databricks metrics and alerts.
AWS Distro for OpenTelemetry is the AWS-supported distribution of OpenTelemetry project, which provides open source standards, libraries, and services for collecting traces and metrics. Through OpenTelemetry, we can collect several different observability data formats, such as Prometheus or StatsD, enrich this data, and send it to several destinations, such as CloudWatch or Amazon Managed Service for Prometheus.
Use cases
While AWS Native services will deliver the observability needed to manage Databricks clusters, there are some scenarios where using Open Source managed services is the best choice.
Both Prometheus and Grafana are very popular technologies, and are already being used in many companies. AWS Open Source services for observability will allow operations teams to use the same existing infrastructure, the same query language, and existing dashboards and alerts to monitor Databricks workloads, without the heavy lifting of managing these services infrastructure, scalability, and performance.
ADOT is the best alternative for teams that need to send metrics and traces to different destinations, such as CloudWatch and Prometheus, or work with different types of data sources, such as OTLP and StatsD.
Finally, Amazon Managed Grafana supports many different Data Sources, including CloudWatch and Prometheus, and help correlate data for teams that decide on using more than one tool, allowing for the creation of templates that will enable observability for all Databricks Clusters, and a powerful API that allow its provisioning and configuration through Infrastructure as Code.
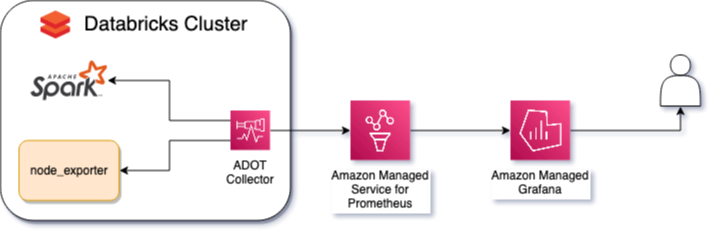 Figure 3: Databricks Open Source Observability Architecture
To observe metrics from a Databricks cluster using AWS Managed Open Source Services for Observability, you will need an Amazon Managed Grafana workspace for visualizing both metrics and alerts, and an Amazon Managed Service for Prometheus workspace, configured as a datasource in the Amazon Managed Grafana workspace.
There are two important kind of metrics that must be collected: Spark and node metrics.
Spark metrics will bring information such as current number of workers in the cluster, or executors; shuffles, that happen when nodes exchenge data during processing; or spills, when data go from RAM to disk and from disk to RAM. To expose these metrics, Spark native Prometheus - available since version 3.0 - must be enabled through Databricks management console, and configured through a init_script.
To keep track of node metrics, such as disk usage, CPU time, memory, storage performance, we use the node_exporter, that can be used without any further configuration, but should only expose important metrics.
An ADOT Collector must be installed in each node of the cluster, scraping the metrics exposed by both Spark and the node_exporter, filtering these metrics, injecting metadata such as cluster_name, and sending these metrics to the Prometheus workspace.
Both the ADOT Collector and the node _exporter must be installed and configured through a init_script.
The Databricks cluster must be configured with an IAM Role with permission to write metrics in the Prometheus workspace.
Best Practices
Prioritize valuable metrics
Spark and node_exporter both expose several metrics, and several formats for the same metrics. Without filtering which metrics are useful for monitoring and incident response, the mean time to detect problems increase, costs with storing samples increase, valuable information will be harder to be found and understood. Using OpenTelemetry processors, it is possible to filter and keep only valuable metrics, or filter out metrics that doesn't make sense; aggregate and calculate metrics before sending them to AMP.
Avoid alerting fatigue
Once valuable metrics are being ingested into AMP, it's essential to configure alerts. However, alerting on every resource usage burst may cause alerting fatigue, that is when too much noise will decrease the confidence in alerts severity, and leave important events undetected. AMP alerting rules group feature should be use to avoid ambiqguity, i.e., several connected alerts generating separated notifications. Also, alerts should receive the proper severity, and it should reflect business priorities.
Reuse Amazon Managed Grafana dashboards
Amazon Managed Grafana leverages Grafana native templating feature, which allow the creation for dashboards for all existing and new Databricks clusters. It removes the need of manually creating and keeping visualizations for each cluster. To use this feature, its important to have the correct labels in the metrics to group these metrics per cluster. Once again, it's possible with OpenTelemetry processors.