AWS पर GenAI ऑब्ज़र्वेबिलिटी
अवलोकन
Generative AI वर्कलोड पारंपरिक एप्लिकेशन से ऐसे तरीकों से भिन्न होते हैं जो पहले दिन से ही ऑब्ज़र्वेबिलिटी को आवश्यक बनाते हैं। प्रतिक्रियाएं non-deterministic होती हैं, latency प्रॉम्प्ट जटिलता के साथ नाटकीय रूप से भिन्न होती है, लागत सीधे token उपयोग से जुड़ी होती है, और एक एक agent invocation कुछ ही सेकंड में Bedrock, S3, Lambda, और KMS में दर्जनों API calls chain कर सकती है।
उचित ऑब्ज़र्वेबिलिटी के बिना, टीमों को अनुमानित समस्याओं का सामना करना पड़ता है:
- लागत अधिकता -- बिना ट्रैक किया गया token उपयोग अप्रत्याशित बिल की ओर ले जाता है। एक एक runaway agent loop कुछ ही मिनटों में सैकड़ों डॉलर खर्च कर सकता है।
- प्रदर्शन गिरावट -- धीमी प्रतिक्रियाएं उपयोगकर्ता अनुभव को प्रभावित करती हैं, और जो दिखाई नहीं देता उसे ठीक नहीं किया जा सकता। Agent workflows orchestration layer पर चुपचाप विफल हो सकते हैं जबकि model calls सफल होती हैं।
- गुणवत्ता अंतराल -- errors, hallucinations, और अप्रत्याशित outputs तब तक पता नहीं चलते जब तक उपयोगकर्ता शिकायत नहीं करते।
- अनुपालन और ऑडिट जोखिम -- model ने क्या कहा, किन parameters का उपयोग किया, या किस IAM role ने पूछा इसका कोई रिकॉर्ड नहीं।
यह गाइड AWS पर GenAI वर्कलोड की निगरानी के लिए नीति, AWS कार्यान्वयन, enablement patterns, और dashboard design के बारे में बताता है। यह साथी गाइड GenAI टेलीमेट्री के लिए कस्टम डैशबोर्ड बनाना के साथ जोड़ा गया है, जो दिखाता है कि उसी टेलीमेट्री को DevOps, FinOps, और अन्य stakeholders के लिए persona-based डैशबोर्ड में कैसे बदलें।
GenAI ऑब्ज़र्वेबिलिटी क्यों अलग है
अनूठी चुनौतियां
Non-deterministic व्यवहार -- एक ही input अलग-अलग outputs उत्पन्न कर सकता है। पारंपरिक "क्या इसने सही मान लौटाया" परीक्षण लागू नहीं होता। आपको केवल success/failure नहीं, बल्कि quality मेट्रिक्स चाहिए।
परिवर्तनशील latency -- प्रतिक्रिया समय प्रॉम्प्ट जटिलता, output लंबाई, model load, और cross-region routing पर निर्भर करता है। P50 और P95 पारंपरिक APIs की तुलना में कहीं अधिक भिन्न होते हैं।
Token-आधारित मूल्य निर्धारण -- लागत केवल request count से नहीं, बल्कि usage patterns के साथ बढ़ती है। औसत प्रॉम्प्ट लंबाई में एक छोटी वृद्धि आपके मासिक बिल को 2x कर सकती है।
Multi-service जटिलता -- agents कई AWS services में API calls chain करते हैं। कोई भी एक log source पूरी कहानी नहीं बताता।
तेज़ iteration -- models और prompts बार-बार बदलते हैं। आपकी ऑब्ज़र्वेबिलिटी को समय के साथ model versions, prompt templates, और configuration changes को ट्रैक करना चाहिए।
व्यावसायिक प्रभाव
जो ऑर्गनाइज़ेशन ऑब्ज़र्वेबिलिटी को बाद की बात मानते हैं, वे आमतौर पर ये patterns बाद में खोजते हैं:
- एक एक untuned prompt मासिक Bedrock बजट का 80% खपत करता है
- Agent workflows tool layer पर विफल होते हैं जबकि model मेट्रिक्स स्वस्थ दिखते हैं
- PII लॉग में लीक होता है क्योंकि redaction पहले से configure नहीं किया गया था
- Cost attribution असंभव है क्योंकि कोई team tags लागू नहीं किए गए
ऑब्ज़र्वेबिलिटी को जल्दी सही करना बाद में महंगे retrofits को रोकता है।
GenAI के लिए मूल स्तंभ
मेट्रिक्स
"मेरा AI कैसा प्रदर्शन कर रहा है?" का उत्तर देने वाली operational टेलीमेट्री
ट्रैक करने योग्य आवश्यक मेट्रिक्स:
- Token usage -- प्रति request input tokens, प्रति request output tokens, model और user-wise कुल tokens, token cost गणना
- Latency -- पहले token तक समय (TTFT), कुल response time, P50/P95/P99 percentiles, model और region-wise latency
- Request volume -- प्रति सेकंड/मिनट/घंटा requests, success बनाम error rates, concurrent requests
- Cost -- प्रति request cost, model/user/team-wise cost, दैनिक/मासिक trends, cost efficiency (प्रति डॉलर output tokens)
लॉग्स
"मेरे AI ने क्या कहा, और किसे?" का उत्तर देने वाला content और context
क्या लॉग करें:
- Request/response pairs (PII redaction के साथ)
- Prompt templates और variables
- Model parameters (temperature, max_tokens, top_p)
- Error messages और stack traces
- User context और session IDs
- A/B test variants
Log levels:
DEBUG-- विस्तृत prompt engineering iterationsINFO-- metadata के साथ सफल requestsWARN-- retries, fallbacks, rate limitsERROR-- failures, timeouts, invalid responses
ट्रेस
"request मेरे system से कैसे गुज़रा?" का उत्तर देने वाला distributed flow
क्या capture करें:
- End-to-end request flow
- Prompt preprocessing steps
- Model invocation spans
- Tool और function call spans
- Post-processing और validation
- Downstream services के साथ integration
- Multi-hop agent workflows
नीतिक बेस्ट प्रैक्टिसेज़
- जल्दी instrument करें -- ship करने के बाद नहीं, build करते समय ऑब्ज़र्वेबिलिटी जोड़ें। OpenTelemetry का उपयोग करें ताकि आपकी instrumentation vendor-neutral और portable रहे।
- Multi-dimensional tagging -- हर metric को
model,environment,application,team, औरregiondimensions के साथ tag करें ताकि बाद में costs और performance slice कर सकें। - Alarms से पहले baselines सेट करें -- alarm thresholds सेट करने से पहले सामान्य व्यवहार स्थापित करने के लिए कम से कम एक सप्ताह production में चलाएं। Baselines के बिना alarms noise fatigue पैदा करते हैं।
- केवल तकनीकी नहीं, व्यावसायिक मेट्रिक्स भी देखें -- latency और error rates के साथ output quality, user satisfaction (thumbs up/down), और cost-per-feature ट्रैक करें।
- पहले दिन से PII की योजना बनाएं -- sensitive data को लॉग में land होने से पहले redact करें। Automated masking के लिए CloudWatch Logs data protection policies का उपयोग करें।
- Retention policies सेट करें -- log volume तेज़ी से बढ़ता है। उद्देश्य के अनुसार retention अलग-अलग रखें:
- Operational logs: 7 दिन
- Model invocations: 30-90 दिन
- Audit/compliance: नियामक आवश्यकता के अनुसार (अक्सर 7 वर्ष)
- Model version और prompt template ट्रैक करें -- जब कुछ बदलता है, तो आपको यह correlate करना होगा कि उस समय production में क्या था।
AWS पर दो Data Pipelines
Amazon CloudWatch दो पूरक data pipelines के माध्यम से GenAI के लिए end-to-end ऑब्ज़र्वेबिलिटी प्रदान करता है। ये अलग-अलग उद्देश्यों की पूर्ति करती हैं, अलग-अलग data capture करती हैं, और अलग-अलग तरीके से enable की जाती हैं। अधिकांश production setups को दोनों की आवश्यकता होती है।
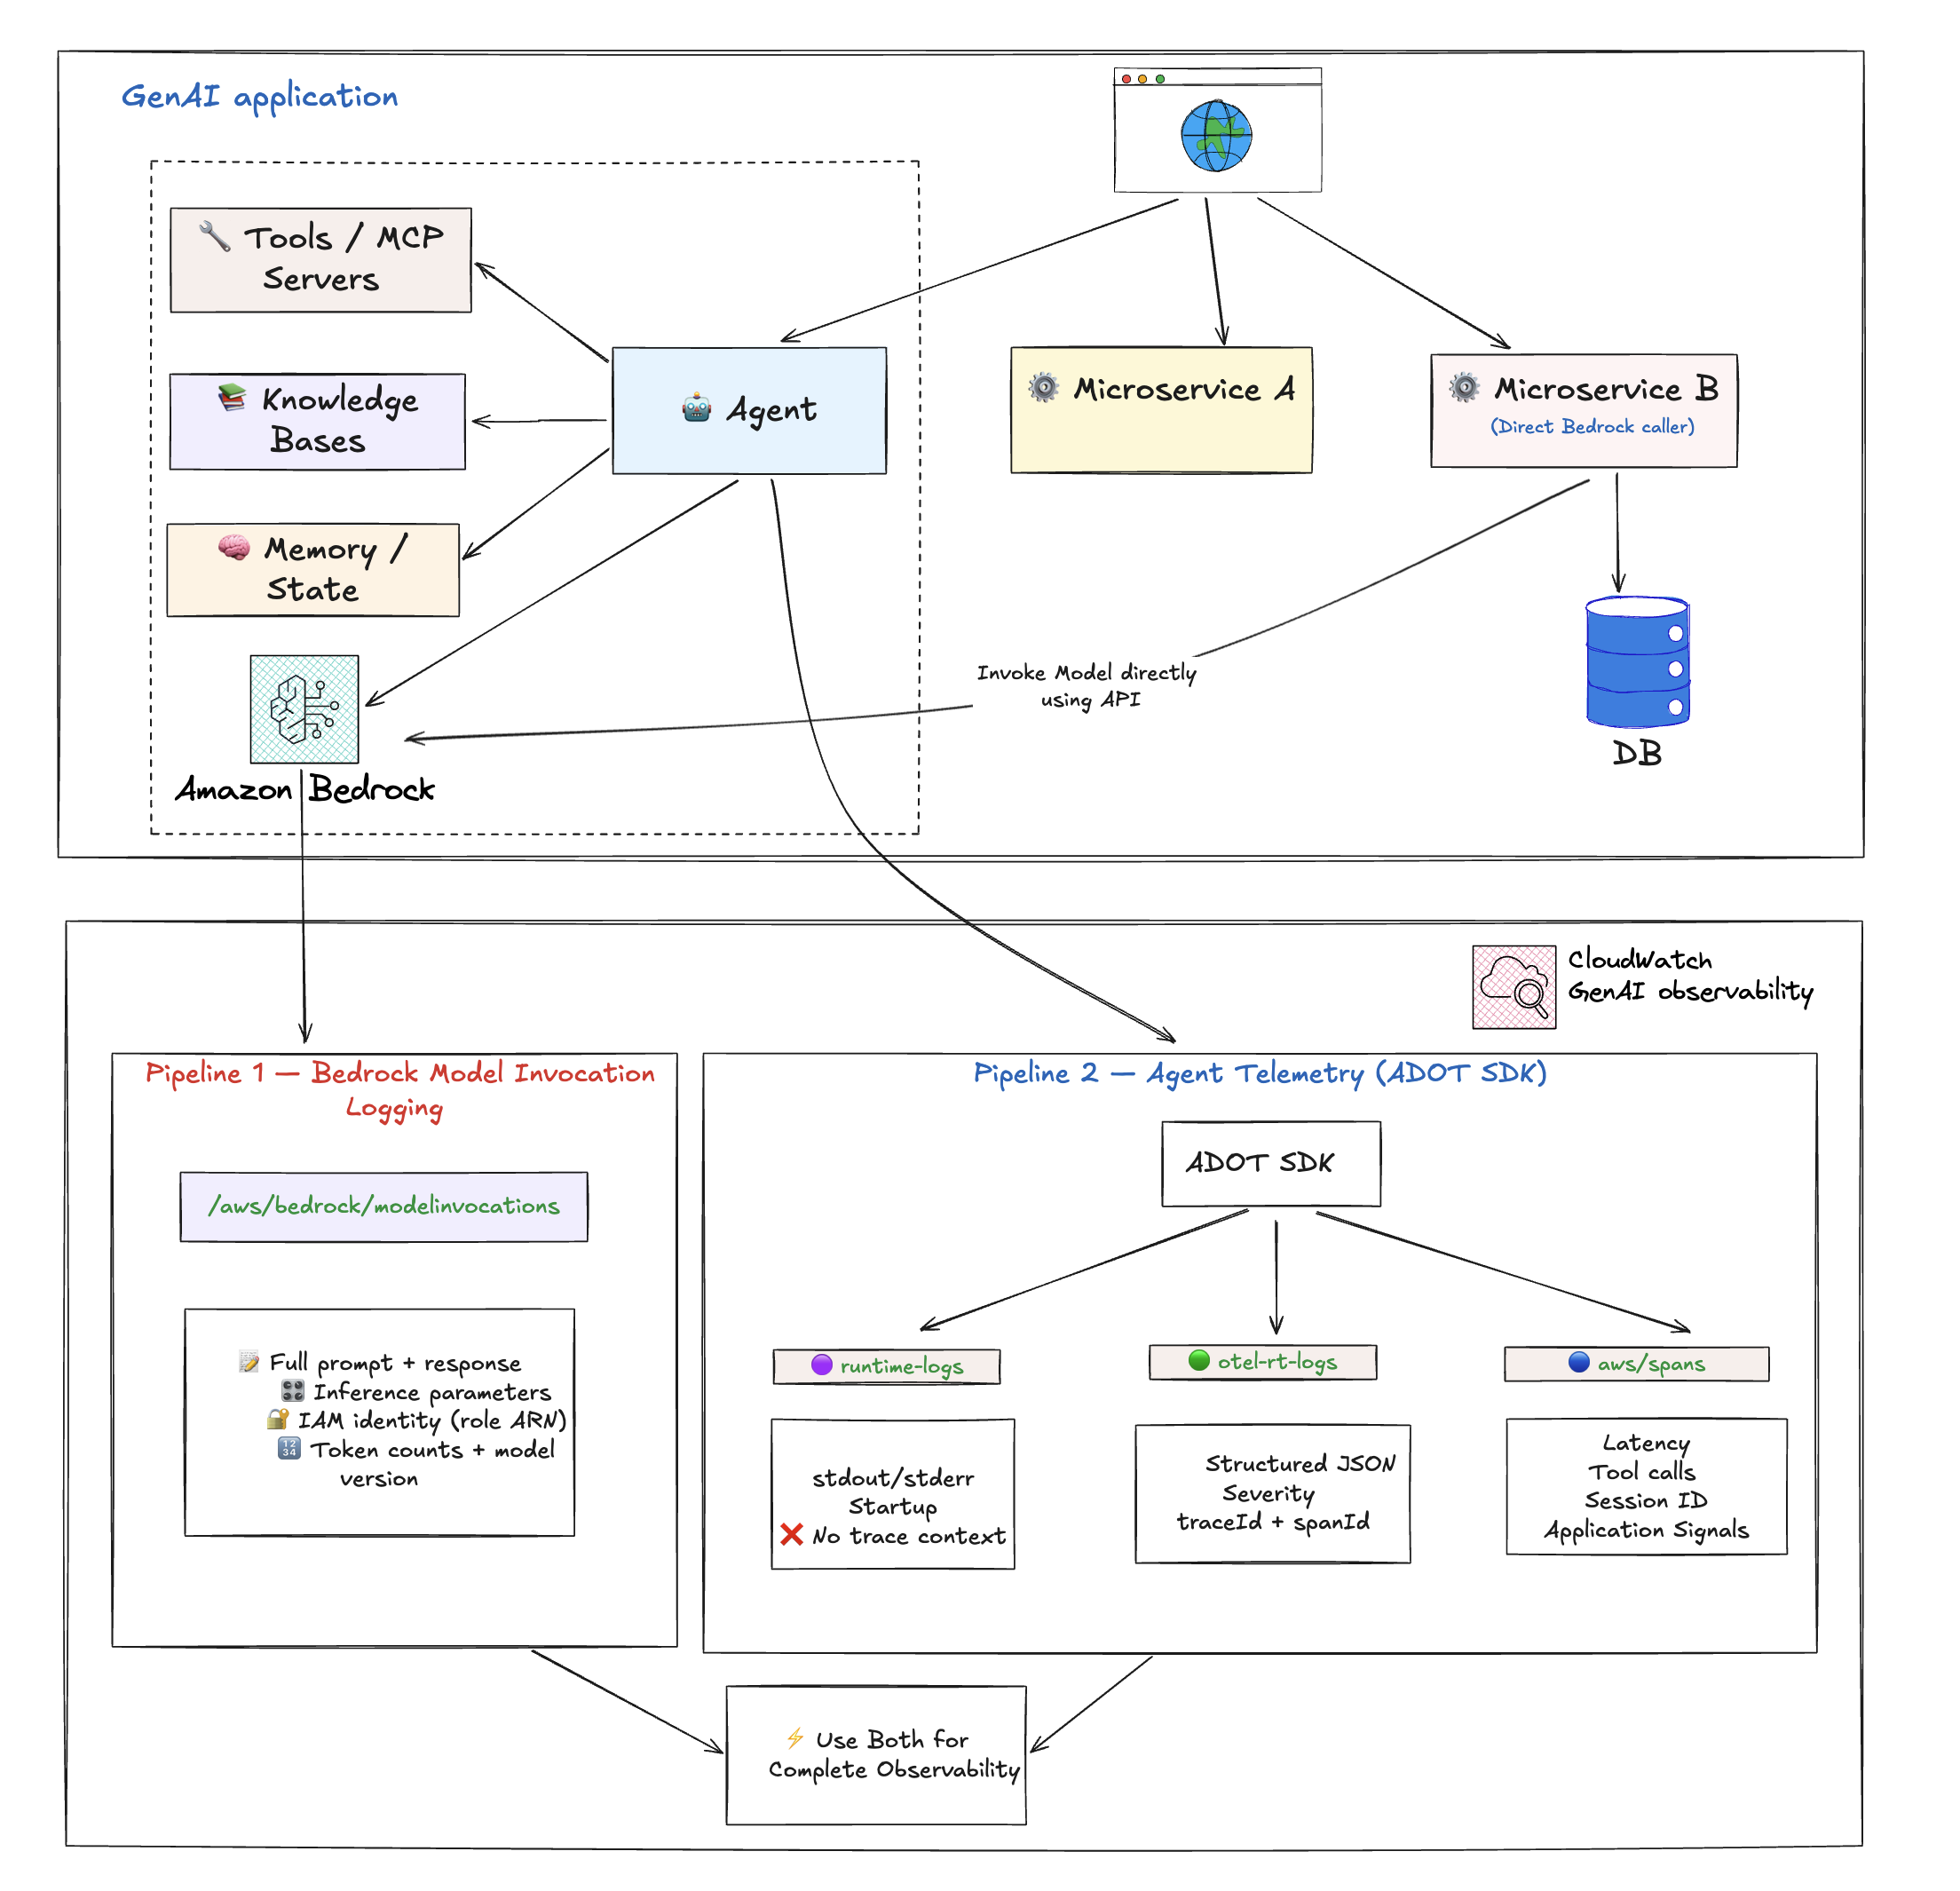
Pipeline 1: Bedrock Model Invocation Logging
एक Bedrock-level logging feature जो हर model invocation के लिए raw request और response capture करता है। यह केवल Bedrock के लिए है -- यह केवल Amazon Bedrock foundation models को की गई calls को cover करता है। यदि आप non-Bedrock models (SageMaker पर self-hosted, external providers) उपयोग कर रहे हैं, तो यह pipeline लागू नहीं होती।
यह क्या capture करता है:
| फ़ील्ड | यह क्यों महत्वपूर्ण है |
|---|---|
| पूर्ण request payload | system prompt और message history सहित model को भेजी गई सामग्री देखें |
| पूर्ण response payload | model ने जो लौटाया वह हूबहू देखें |
Inference parameters (temperature, max_tokens, top_p) | अप्रत्याशित model व्यवहार debug करें -- क्या यह temp 0.7 से call हुआ या 0.0 से? |
| Caller IAM identity (role ARN) | Security audit, team/role-wise cost attribution |
| Bedrock operation type | InvokeModel, Converse, ConverseStream |
| Model version | suffix सहित exact model ID (जैसे cohere.command-r-plus-v1:0) |
| Token counts | Content से सीधे जुड़े input और output token counts |
यह क्या capture नहीं करता:
- Agent orchestration flow (कौन से tools call हुए, agent loop behavior)
- Client-side latency
- Distributed trace correlation (कोई traceId/spanId नहीं -- केवल requestId)
- Tool call details
- Infrastructure context
- Non-Bedrock model calls
Sample log entry:
{
  "timestamp": "2026-04-17T14:21:50Z",
  "accountId": "123456789012",
  "region": "us-east-1",
  "requestId": "a1b2c3d4-e5f6-7890-abcd-ef1234567890",
  "operation": "InvokeModel",
  "modelId": "cohere.command-r-plus-v1:0",
  "input": {
    "inputBodyJson": {
      "message": "Write a short joke about software engineers.",
      "max_tokens": 256,
      "temperature": 0.7
    },
    "inputTokenCount": 8
  },
  "output": {
    "outputBodyJson": {
      "text": "Why did the engineer break up? Because they couldn't commit.",
      "finish_reason": "COMPLETE"
    },
    "outputTokenCount": 20
  },
  "identity": {
    "arn": "arn:aws:sts::123456789012:assumed-role/my-bedrock-role/my-session"
  },
  "schemaType": "ModelInvocationLog"
}
कैसे enable करें:
Amazon Bedrock console (या API) के माध्यम से manual opt-in। यह वही step है चाहे model किसी agent, direct API call, SDK, या किसी और चीज़ से invoke हो। एक बार चालू होने पर यह सभी Bedrock model invocations पर account-wide लागू होता है।
- Amazon Bedrock console खोलें
- Settings चुनें
- Model invocation logging के अंतर्गत, Model invocation logging चुनें
- लॉग में शामिल करने के लिए आवश्यक data types चुनें। लॉग केवल CloudWatch Logs को भेजें, या Amazon S3 और CloudWatch Logs दोनों को भेजें।
- CloudWatch Logs configurations के अंतर्गत, एक log group name बनाएं और उपयुक्त service roles चुनें
- Save settings चुनें
अधिक जानकारी के लिए, Model Invocations और Set up a CloudWatch Logs destination देखें।
पूर्व-configured dashboards:
Model Invocation Logging enable करने के बाद, CloudWatch स्वचालित रूप से निम्नलिखित दिखाने वाले dashboards प्रदान करता है:
- Invocation count -- Converse, ConverseStream, InvokeModel, और InvokeModelWithResponseStream APIs को सफल requests की संख्या
- Invocation latency -- Invocations की latency
- Model-wise Token Counts -- Model-wise input और output token counts
- ModelID-wise Daily Token Counts -- Model ID-wise दैनिक कुल token counts
- Input tokens-wise grouped Requests -- Token ranges में grouped requests की संख्या
- Invocation Throttles -- Throttled invocations की संख्या
- Invocation Error Count -- Error वाली invocations की count
Pipeline 2: Agent Telemetry (ADOT SDK के माध्यम से)
AWS Distro for OpenTelemetry (ADOT) SDK द्वारा captured OpenTelemetry-based traces, spans, और logs। Model Invocation Logging के विपरीत, Agent Telemetry केवल Bedrock नहीं बल्कि किसी भी model provider (Bedrock, SageMaker, external) के साथ काम करती है।
यह क्या capture करता है:
- Agent orchestration flow -- कौन से tools call हुए, किस क्रम में, agent loop iterations
- Model call metadata -- model ID, token counts (input/output), latency, status codes, finish reasons
- Tool execution details -- हर tool call का tool name, duration, success/failure
- Distributed trace correlation -- पूर्ण end-to-end request tracing के लिए traceId, spanId, parentSpanId
- Session tracking -- session.id कई invocations को एक user session से जोड़ता है
- Platform और environment context -- cloud.platform, deployment.environment, service metadata
यह क्या capture नहीं करता:
- Inference parameters (temperature, max_tokens, top_p)
- Caller IAM identity
- डिफ़ॉल्ट रूप से पूर्ण prompt/response content (framework-dependent -- Strands, LangChain, CrewAI आदि supported हैं; अन्य भिन्न हो सकते हैं)
Sample model call span (aws/spans):
{
  "resource": {
    "attributes": {
      "deployment.environment.name": "bedrock-agentcore:default",
      "service.name": "MyAgent.DEFAULT",
      "cloud.platform": "aws_bedrock_agentcore",
      "telemetry.sdk.version": "1.40.0"
    }
  },
  "traceId": "a1b2c3d4e5f6a7b8c9d0e1f2a3b4c5d6",
  "spanId": "1a2b3c4d5e6f7a8b",
  "parentSpanId": "9c8d7e6f5a4b3c2d",
  "name": "chat us.anthropic.claude-sonnet-4-6",
  "durationNano": 2644916837,
  "attributes": {
    "gen_ai.request.model": "us.anthropic.claude-sonnet-4-6",
    "gen_ai.usage.input_tokens": 1980,
    "gen_ai.usage.output_tokens": 119,
    "gen_ai.response.finish_reasons": ["tool_use"],
    "http.response.status_code": 200,
    "session.id": "session-a1b2c3d4-e5f6-7890"
  }
}
Sample tool execution span (aws/spans):
{
  "traceId": "a1b2c3d4e5f6a7b8c9d0e1f2a3b4c5d6",
  "spanId": "2b3c4d5e6f7a8b9c",
  "parentSpanId": "d4e5f6a7b8c9d0e1",
  "name": "execute_tool http_request",
  "durationNano": 37505594,
  "attributes": {
    "gen_ai.tool.name": "http_request",
    "gen_ai.tool.status": "success",
    "gen_ai.system": "strands-agents"
  }
}
Data कहां land होता है:
| Log Group | इसमें क्या है |
|---|---|
aws/spans | OTel trace spans -- model calls, tool executions, agent loop iterations |
/aws/bedrock-agentcore/runtimes/<agent> (runtime-logs) | Application stdout/stderr -- startup logs, errors, custom app logging |
/aws/bedrock-agentcore/runtimes/<agent> (otel-rt-logs) | Agent framework के OTel log records (supported frameworks के लिए prompt/response content) |
CloudWatch में यह क्या power करता है:
- Application Signals dashboards -- latency percentiles, error rates, throughput
- Application Maps -- agent → model → tool call chains visualize करें
- Distributed Tracing -- services में end-to-end request tracing
- SLO monitoring
- Trace analytics -- individual requests को end-to-end drill करें
- Infrastructure metrics के साथ correlation
कैसे enable करें:
| Deployment Model | आप क्या करें |
|---|---|
| Bedrock AgentCore | कुछ नहीं -- ADOT SDK runtime में built-in है। Telemetry स्वचालित रूप से flow होती है। |
| Non-AgentCore (EKS/ECS/self-hosted) | ADOT ऑटो-इंस्ट्रुमेंटेशन agent attach करें। कोई code changes आवश्यक नहीं। |
Side-by-Side तुलना
| आप क्या जानना चाहते हैं | Model Invocation Logging (केवल Bedrock) | Agent Telemetry (ADOT) |
|---|---|---|
| कौन सा model call हुआ? | ✅ | ✅ |
| Latency / duration? | ❌ | ✅ (client-side) |
| Token counts? | ✅ | ✅ |
| Error rates / status? | ✅ | ✅ |
| Agent orchestration flow? | ❌ | ✅ |
| Tool call details? | ❌ | ✅ |
| पूर्ण prompt text? | ✅ | Framework-dependent |
| पूर्ण model response? | ✅ | Framework-dependent |
| Inference parameters? | ✅ | ❌ |
| Caller IAM identity? | ✅ | ❌ |
| Distributed trace correlation? | ❌ | ✅ |
| Non-agent Bedrock calls के लिए काम करता है? | ✅ | ❌ |
| Non-Bedrock models के लिए काम करता है? | ❌ (केवल Bedrock) | ✅ |
| Application Signals / Application Maps? | ❌ | ✅ |
Pipeline 2 में Prompt/response content capture agent framework की OTel instrumentation पर निर्भर करता है। Strands, LangChain, और CrewAI supported हैं; अन्य frameworks भिन्न हो सकते हैं।
सारांश: Agent Telemetry आपको बताती है आपका agent कैसा प्रदर्शन कर रहा है। Model Invocation Logging आपको बताता है आपका model क्या कह रहा है और कौन पूछ रहा है। पूर्ण ऑब्ज़र्वेबिलिटी के लिए, दोनों enable करें।
Agentic Workloads के लिए ऑब्ज़र्वेबिलिटी Enable करना
शुरू करने से पहले, पूर्ण GenAI ऑब्ज़र्वेबिलिटी अनुभव unlock करने के लिए CloudWatch Transaction Search enable करें।
AgentCore Runtime hosted agents
AgentCore Runtime एक सुरक्षित, serverless runtime है जो dynamic AI agents और tools को deploy और scale करने के लिए purpose-built है। यह LangGraph, CrewAI, Strands Agents सहित किसी भी open-source framework, किसी भी protocol, और किसी भी model को support करता है।
ऑब्ज़र्वेबिलिटी built-in है -- ADOT SDK AgentCore runtime में baked है। Metrics स्वचालित रूप से generate होती हैं, और traces बिना किसी code changes के flow होते हैं।
- Custom ऑब्ज़र्वेबिलिटी configure करें
- Step-by-step tutorial: AgentCore Runtime hosted agents के लिए ऑब्ज़र्वेबिलिटी enable करना
Non-AgentCore hosted agents (EKS, ECS, self-hosted)
आप AgentCore के बाहर अपने agents host कर सकते हैं और end-to-end monitoring के लिए अपना ऑब्ज़र्वेबिलिटी data CloudWatch में ला सकते हैं। अपने workload में ADOT ऑटो-इंस्ट्रुमेंटेशन agent attach करें -- कोई code changes आवश्यक नहीं।
- Third-party ऑब्ज़र्वेबिलिटी configure करें
- Step-by-step tutorial: Non-AgentCore hosted agents के लिए ऑब्ज़र्वेबिलिटी enable करना
AgentCore memory, gateway, और built-in tool resources
AgentCore modular services की metrics और traces में visibility प्राप्त करें। CloudWatch ऑब्ज़र्वेबिलिटी configure करें देखें।
AgentCore Evaluations
AgentCore Evaluations आपके AI agents के performance, quality, और reliability को monitor और assess करने की क्षमताएं प्रदान करता है। AgentCore evaluations देखें।
Enablement सारांश
| Component | AgentCore | Non-AgentCore (EKS/ECS) |
|---|---|---|
| Metrics | स्वचालित | ADOT ऑटो-इंस्ट्रुमेंटेशन agent |
| Agent traces और spans | स्वचालित (ADOT built-in) | ADOT ऑटो-इंस्ट्रुमेंटेशन agent |
| Model Invocation Logging | Bedrock console से manual opt-in | Bedrock console से manual opt-in |
दोनों paths में वास्तव में manual opt-in की आवश्यकता केवल Model Invocation Logging के लिए है। बाकी सब या तो automatic है या ADOT ऑटो-इंस्ट्रुमेंटेशन agent attach करके handle होता है।
Sensitive Data की सुरक्षा
Model invocations लॉग करते समय, prompts और responses में PII या sensitive information हो सकती है। Amazon CloudWatch Logs sensitive data की पहचान और masking के लिए machine learning और pattern matching का उपयोग करने वाली data protection policies प्रदान करता है।
आप दो levels पर data protection configure कर सकते हैं:
Account-level data protection
- Amazon CloudWatch console खोलें
- Navigation pane में, Settings चुनें
- Logs tab चुनें
- Configure the Data protection account policy चुनें
- अपने data से relevant data identifiers specify करें (managed या custom)
- (वैकल्पिक) Audit findings के लिए destination चुनें (CloudWatch Logs, Firehose, या S3)
- Activate data protection चुनें
Log-group-level data protection
- Amazon CloudWatch console खोलें
- Navigation panel में, Logs, Log Management चुनें
- Log groups tab चुनें, log group (जैसे
aws/bedrock/modelinvocations) select करें, और Create data protection policy चुनें - अपने data से relevant data identifiers specify करें
- (वैकल्पिक) Audit findings के लिए destination चुनें
- Activate data protection चुनें
अधिक जानकारी के लिए, Protecting sensitive log data with masking और Protect sensitive data देखें।
कब क्या Enable करें
| परिदृश्य | Model Invocation Logging | Agent Telemetry (ADOT) |
|---|---|---|
| Agents के बिना Bedrock उपयोग (direct API) | ✅ एकमात्र विकल्प | ❌ लागू नहीं |
| सभी LLM interactions का compliance/audit trail | ✅ आवश्यक | अच्छा हो तो |
| Prompt quality या अप्रत्याशित model outputs debug करना | ✅ आवश्यक (inference params + content) | Context के लिए सहायक |
| Team/role-wise cost attribution | ✅ आवश्यक (IAM identity) | ❌ यह नहीं कर सकता |
| Evaluation/fine-tuning pipelines बनाना | ✅ आवश्यक (structured content) | Framework-dependent |
| Agents चला रहे हैं, operational dashboards चाहिए | अच्छा हो तो | ✅ आवश्यक |
| केवल Latency/error monitoring | आवश्यक नहीं | ✅ पर्याप्त |
Dashboards बनाना
एक बार दोनों pipelines flow हो रही हों, तो आप विभिन्न audiences के लिए dashboards बना सकते हैं। तैयार queries के लिए, GenAI टेलीमेट्री के लिए कस्टम डैशबोर्ड बनाना गाइड देखें।
Audience-wise Dashboard Tiers
Executive dashboard -- उच्च-स्तरीय KPIs:
- कुल दैनिक cost
- Request volume trends
- Error rate
- Usage-wise top models
DevOps dashboard -- real-time monitoring:
- Stop reason breakdown (end_turn vs tool_use vs max_tokens)
- Completion rate बनाम truncation trend
- Agent traces बनाम errors (hourly)
- Span error drill-down
- Component performance breakdown (P50/P95/P99)
- Cross-region inference latency
FinOps dashboard -- cost management:
- कुल spend (hourly, daily, monthly)
- Model-wise cost distribution
- Role/user-wise top 10 spenders
- Input बनाम output cost split
- Prompt caching opportunities
- एनोमली डिटेक्शन के साथ daily cost trend
Developer dashboard -- debugging और optimization:
- Request traces
- Feature-wise token usage
- Latency breakdown
- Stack traces के साथ error details
- Token efficiency (high input, low output waste detection)
Sample DevOps Query: Completion Rate
सफल completions बनाम truncated responses का hourly ratio ट्रैक करता है। 95%+ completion rate target करें।
fields @timestamp, modelId,
       output.outputBodyJson.stopReason as stop_reason
| filter schemaType = "ModelInvocationLog"
| filter ispresent(output.outputBodyJson.stopReason)
| stats sum(stop_reason = "end_turn" or stop_reason = "tool_use") as ok,
        sum(stop_reason = "max_tokens") as truncated
  by bin(@timestamp, 1h) as hour
| sort hour desc
Sample FinOps Query: Role-wise Top Spenders
SOURCE "bedrock-model-invocation-logging"
| filter @logStream = 'aws/bedrock/modelinvocations'
| fields replace(`identity.arn`, "arn:aws:sts::ACCOUNT_ID:assumed-role/", "") as userRole
| stats sum(totalCostUSD) as spend, count(*) as invocations
  by userRole
| sort spend desc
| limit 10
पूर्ण cost calculation और अधिक उदाहरणों के लिए dashboard queries guide देखें।
Alerting Strategy
Urgency और impact के अनुसार tiers में alerts सेट करें।
Critical Alerts (तुरंत page करें)
- Error rate 5% से अधिक
- P95 latency 10 सेकंड से अधिक
- Daily cost baseline का 150% से अधिक
- Model unavailability
- Agent error rate 15 मिनट के लिए 10% से अधिक
Warning Alerts (business hours में investigate करें)
- Token usage week-over-week 20% बढ़ रहा है
- 7 दिनों में latency degradation
- Cache hit rate गिर रही है
- असामान्य request patterns
- Completion rate 2 घंटे के लिए 95% से नीचे
- Component P95 5000ms से अधिक
Informational Alerts (daily digest)
- Daily cost summaries
- Weekly usage reports
- Model performance comparisons
- Top spenders report
Alert Routing उदाहरण
route:
  group_by: ['alertname', 'cloud_provider']
  group_wait: 30s
  group_interval: 5m
  repeat_interval: 4h
  receiver: 'default'
  routes:
    - match:
        severity: critical
      receiver: 'pagerduty'
    - match:
        severity: warning
      receiver: 'slack-ops'
    - match:
        alertname: MonthlyBudgetExceeded
      receiver: 'slack-finops'
ऑब्ज़र्वेबिलिटी Maturity Model
Level 1: Basic Monitoring
- Request counts और errors ट्रैक करें
- Basic latency metrics
- Manual cost tracking
Level 2: Comprehensive Metrics
- Token-level tracking
- Multi-dimensional metrics (model, team, environment)
- Automated dashboards
- Baselines के साथ basic alerting
Level 3: Advanced Analytics
- Agent workflows में distributed tracing
- Team/feature-wise cost attribution
- Quality scoring और user feedback integration
- Trends पर आधारित predictive alerting
Level 4: AI-Powered ऑब्ज़र्वेबिलिटी
- Cost और behavior पर एनोमली डिटेक्शन
- Automated रूट कॉज़ एनालिसिस
- Self-healing systems (सस्ते models पर automatic fallback)
- Continuous optimization loops
MLOps के साथ Integration
ऑब्ज़र्वेबिलिटी केवल production नहीं, बल्कि पूरे ML lifecycle में extend होनी चाहिए:
Training Phase:
- Training costs और duration ट्रैक करें
- Model quality metrics monitor करें
- Models और prompts के लिए version control
Deployment Phase:
- Metric comparison के साथ canary deployments
- Blue-green deployment monitoring
- ऑब्ज़र्वेबिलिटी signals पर आधारित rollback triggers
Production Phase:
- Continuous monitoring
- Drift detection पर आधारित automated retraining triggers
- Performance degradation detection
Optimization Phase:
- Prompts और models के लिए A/B testing frameworks
- Cost-performance tradeoff analysis
- Prompt engineering feedback loops
बचने योग्य सामान्य Anti-Patterns
- PII redaction के बिना पूर्ण prompts और responses लॉग करना -- compliance violations, data breach risk। Model Invocation Logging enable करने से पहले data protection policies configure करें।
- केवल aggregate metrics ट्रैक करना -- per-request detail के बिना individual issues debug या costs attribute नहीं कर सकते।
- Baselines के बिना alerts सेट करना -- false positives से alert fatigue। हमेशा पहले normal behavior establish करें।
- Bill आने तक token usage ignore करना -- जब तक bill दिखे, नुकसान हो चुका है। Daily monitor करें।
- Provider-wise अलग metric names उपयोग करना -- models में performance compare नहीं कर सकते। OpenTelemetry GenAI semantic conventions पर standardize करें।
- Telemetry data indefinitely store करना -- compliance issues और अनावश्यक storage costs। Data class-wise retention policies सेट करें।
- Manual dashboard creation -- inconsistency और maintenance burden। Dashboards के लिए Infrastructure as Code उपयोग करें।
- केवल technical metrics monitor करना -- quality और business impact issues miss करते हैं। Latency के साथ user satisfaction भी ट्रैक करें।
शुरुआती Checklist
Pre-Production
- CloudWatch Transaction Search enable करें
- AgentCore के लिए: अपना agent deploy करें -- telemetry स्वचालित रूप से flow होगी
- Non-AgentCore के लिए: ADOT ऑटो-इंस्ट्रुमेंटेशन agent attach करें
- Bedrock console से Bedrock Model Invocation Logging enable करें
- PII redaction के लिए data protection policies configure करें
- प्रत्येक log group के लिए log retention policies सेट करें
- Dashboard queries guide का उपयोग करके initial dashboards बनाएं
- Baseline metrics document करें (latency, token usage, cost)
- उचित thresholds के साथ alarms configure करें
- सामान्य issues के लिए runbooks बनाएं
Production
- Production में monitoring enable
- सही channels पर alerts route (PagerDuty, Slack)
- Team access configure (stakeholders के लिए read-only dashboards)
- Backup और disaster recovery tested
- नियमित review schedule स्थापित (weekly cost review, monthly performance review)
अतिरिक्त संसाधन
साथी गाइड
- GenAI टेलीमेट्री के लिए कस्टम डैशबोर्ड बनाना -- Telemetry को DevOps, FinOps, और अन्य stakeholders के लिए persona-based dashboards में बदलें
AWS दस्तावेज़ीकरण
- Model Invocations — CloudWatch GenAI ऑब्ज़र्वेबिलिटी
- Getting Started with AgentCore ऑब्ज़र्वेबिलिटी
- Set up Bedrock Model Invocation Logging
- Protect Sensitive Data in CloudWatch Logs
- Configure Custom ऑब्ज़र्वेबिलिटी for AgentCore
- Configure Third-Party ऑब्ज़र्वेबिलिटी
- AgentCore Evaluations
Standards और Tools
- AWS Distro for OpenTelemetry (ADOT)
- OpenTelemetry GenAI Semantic Conventions
- OpenTelemetry Specification
योगदानकर्ता: AWS ऑब्ज़र्वेबिलिटी Team अंतिम अपडेट: 2026-04-21