Amazon Managed Grafana の自動化に Terraform を使用する
このレシピでは、Terraform を使用して Amazon Managed Grafana を自動化する方法を紹介します。 例えば、複数のワークスペースにわたってデータソースやダッシュボードを一貫して追加する方法を説明します。
このガイドは完了までに約 30 分かかります。
前提条件
- ローカル環境に AWS command line がインストールされ、設定 されていること。
- ローカル環境に Terraform コマンドラインがインストールされていること。
- 使用可能な Amazon Managed Service for Prometheus ワークスペースがあること。
- 使用可能な Amazon Managed Grafana ワークスペースがあること。
Amazon Managed Grafana のセットアップ
Terraform が Grafana に対して認証を行うために、パスワードのような役割を果たす API キーを使用します。
API キーは、Grafana API に対するすべてのリクエストで呼び出し元を認証する、51 文字の英数字の値を持つ RFC 6750 HTTP Bearer ヘッダーです。
そのため、Terraform マニフェストをセットアップする前に、まず API キーを作成する必要があります。以下の手順で Grafana UI から作成します。
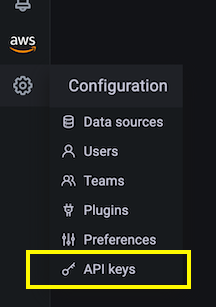
まず、左側のメニューの Configuration セクションから API keys メニュー項目を選択します:
次に、新しい API キーを作成し、タスクに適した名前を付け、Admin ロールを割り当て、有効期間を例えば 1 日に設定します:
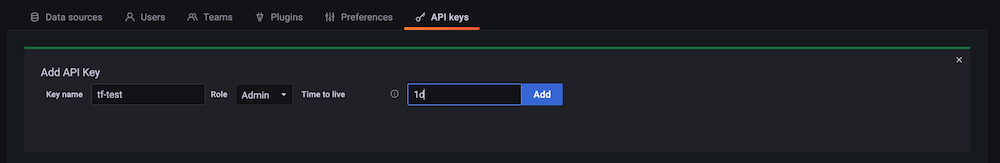
API キーの有効期限は限られており、AMG では最大 30 日まで設定できます。
Add ボタンをクリックすると、API キーを含むポップアップダイアログが表示されます:
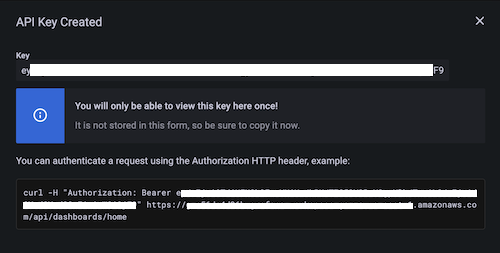
API キーが表示されるのはこの時だけです。後で Terraform マニフェストで必要になるので、ここで安全な場所に保存してください。
これで、Terraform を使用した自動化のために必要な Amazon Managed Grafana のセットアップが完了しました。次のステップに進みましょう。
Terraform による自動化
Terraform の準備
Terraform が Grafana と連携できるように、バージョン 1.13.3 以上の公式 Grafana プロバイダー を使用します。
以下では、データソースの作成を自動化します。具体的には、Prometheus データソース、つまり AMP ワークスペースを追加します。
まず、以下の内容で main.tf というファイルを作成します:
terraform {
  required_providers {
    grafana = {
      source  = "grafana/grafana"
      version = ">= 1.13.3"
    }
  }
}

provider "grafana" {
  url  = "INSERT YOUR GRAFANA WORKSPACE URL HERE"
  auth = "INSERT YOUR API KEY HERE"
}

resource "grafana_data_source" "prometheus" {
  type          = "prometheus"
  name          = "amp"
  is_default    = true
  url           = "INSERT YOUR AMP WORKSPACE URL HERE "
  json_data {
	http_method     = "POST"
	sigv4_auth      = true
	sigv4_auth_type = "workspace-iam-role"
	sigv4_region    = "eu-west-1"
  }
}
上記のファイルには、環境に応じて 3 つの値を挿入する必要があります。
Grafana プロバイダーセクションでは:
url… Grafana ワークスペース URL で、以下のような形式です:https://xxxxxxxx.grafana-workspace.eu-west-1.amazonaws.comauth… 前のステップで作成した API キー
Prometheus リソースセクションでは、url に AMP ワークスペース URL を挿入します。
形式は https://aps-workspaces.eu-west-1.amazonaws.com/workspaces/ws-xxxxxxxxx です。
ファイルに示されているものとは異なるリージョンで Amazon Managed Grafana を使用している場合は、上記に加えて sigv4_region をお使いのリージョンに設定する必要があります。
準備フェーズを完了するために、Terraform を初期化しましょう:
$ terraform init
Initializing the backend...

Initializing provider plugins...
- Finding grafana/grafana versions matching ">= 1.13.3"...
- Installing grafana/grafana v1.13.3...
- Installed grafana/grafana v1.13.3 (signed by a HashiCorp partner, key ID 570AA42029AE241A)

Partner and community providers are signed by their developers.
If you'd like to know more about provider signing, you can read about it here:
https://www.terraform.io/docs/cli/plugins/signing.html

Terraform has created a lock file .terraform.lock.hcl to record the provider
selections it made above. Include this file in your version control repository
so that Terraform can guarantee to make the same selections by default when
you run "terraform init" in the future.

Terraform has been successfully initialized!

You may now begin working with Terraform. Try running "terraform plan" to see
any changes that are required for your infrastructure. All Terraform commands
should now work.

If you ever set or change modules or backend configuration for Terraform,
rerun this command to reinitialize your working directory. If you forget, other
commands will detect it and remind you to do so if necessary.
これで準備が整い、以下で説明するようにデータソースの作成を Terraform で自動化できます。
Terraform の使用
通常、最初に以下のように Terraform のプランを確認します:
$ terraform plan

Terraform used the selected providers to generate the following execution plan.
Resource actions are indicated with the following symbols:
  + create

Terraform will perform the following actions:

  # grafana_data_source.prometheus will be created
  + resource "grafana_data_source" "prometheus" {
      + access_mode        = "proxy"
      + basic_auth_enabled = false
      + id                 = (known after apply)
      + is_default         = true
      + name               = "amp"
      + type               = "prometheus"
      + url                = "https://aps-workspaces.eu-west-1.amazonaws.com/workspaces/ws-xxxxxx/"

      + json_data {
          + http_method     = "POST"
          + sigv4_auth      = true
          + sigv4_auth_type = "workspace-iam-role"
          + sigv4_region    = "eu-west-1"
        }
    }

Plan: 1 to add, 0 to change, 0 to destroy.

───────────────────────────────────────────────────────────────────────────────────────────────────────────────────────────────────────────────────────────────────────────

Note: You didn't use the -out option to save this plan, so Terraform can't guarantee to take exactly these actions if you run "terraform apply" now.
プランの内容に問題がなければ、以下のようにプランを適用できます:
$ terraform apply

Terraform used the selected providers to generate the following execution plan.
Resource actions are indicated with the following symbols:
  + create

Terraform will perform the following actions:

  # grafana_data_source.prometheus will be created
  + resource "grafana_data_source" "prometheus" {
      + access_mode        = "proxy"
      + basic_auth_enabled = false
      + id                 = (known after apply)
      + is_default         = true
      + name               = "amp"
      + type               = "prometheus"
      + url                = "https://aps-workspaces.eu-west-1.amazonaws.com/workspaces/ws-xxxxxxxxx/"

      + json_data {
          + http_method     = "POST"
          + sigv4_auth      = true
          + sigv4_auth_type = "workspace-iam-role"
          + sigv4_region    = "eu-west-1"
        }
    }

Plan: 1 to add, 0 to change, 0 to destroy.

Do you want to perform these actions?
  Terraform will perform the actions described above.
  Only 'yes' will be accepted to approve.

  Enter a value: yes

grafana_data_source.prometheus: Creating...
grafana_data_source.prometheus: Creation complete after 1s [id=10]

Apply complete! Resources: 1 added, 0 changed, 0 destroyed.
Grafana のデータソースリストに移動すると、以下のような画面が表示されるはずです:
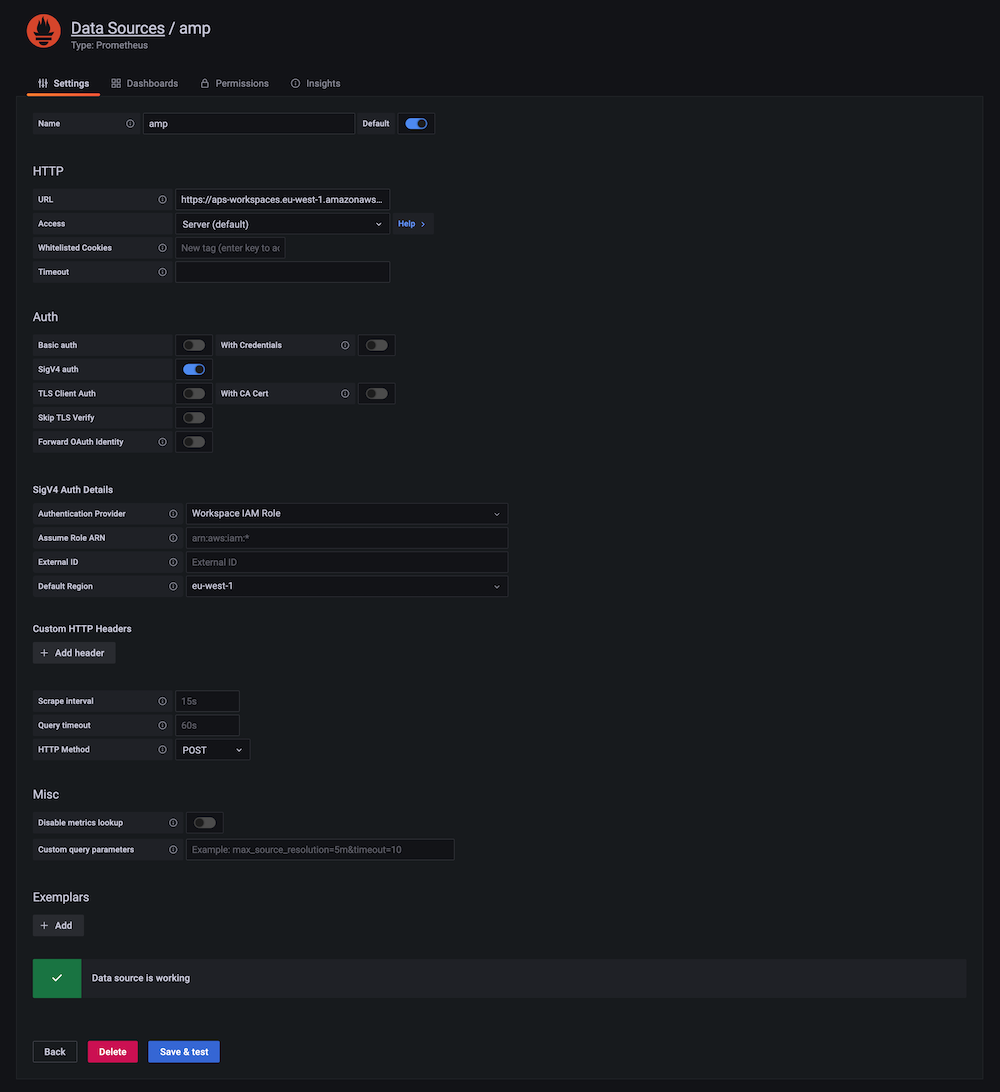
新しく作成したデータソースが機能しているかを確認するには、下部にある青い Save & test ボタンをクリックします。
結果として「Data source is working」という確認メッセージが表示されるはずです。
Terraform を使用して他の作業も自動化できます。 例えば、Grafana provider はフォルダやダッシュボードの管理をサポートしています。
例えば、ダッシュボードを整理するためのフォルダを作成する場合:
resource "grafana_folder" "examplefolder" {
  title = "devops"
}
さらに、example-dashboard.json というダッシュボードを上記のフォルダに作成する場合は、以下のスニペットを使用します:
resource "grafana_dashboard" "exampledashboard" {
  folder = grafana_folder.examplefolder.id
  config_json = file("example-dashboard.json")
}
Terraform は強力な自動化ツールであり、ここで示したように Grafana リソースの管理に使用できます。
ただし、Terraform の状態 は、デフォルトではローカルで管理されることに注意してください。 つまり、Terraform を使用して共�同作業を行う場合は、チーム間で状態を共有できる利用可能なオプションのいずれかを選択する必要があります。
クリーンアップ
コンソールから Amazon Managed Grafana ワークスペースを削除してください。