Observability Adoption Guide
Overview
This guide provides a structured framework for organizations to assess and evolve their observability capabilities through three adoption stages. It also identifies common anti-patterns and pitfalls that lead to costly, fragile observability implementations — particularly under tight time and budget pressures.
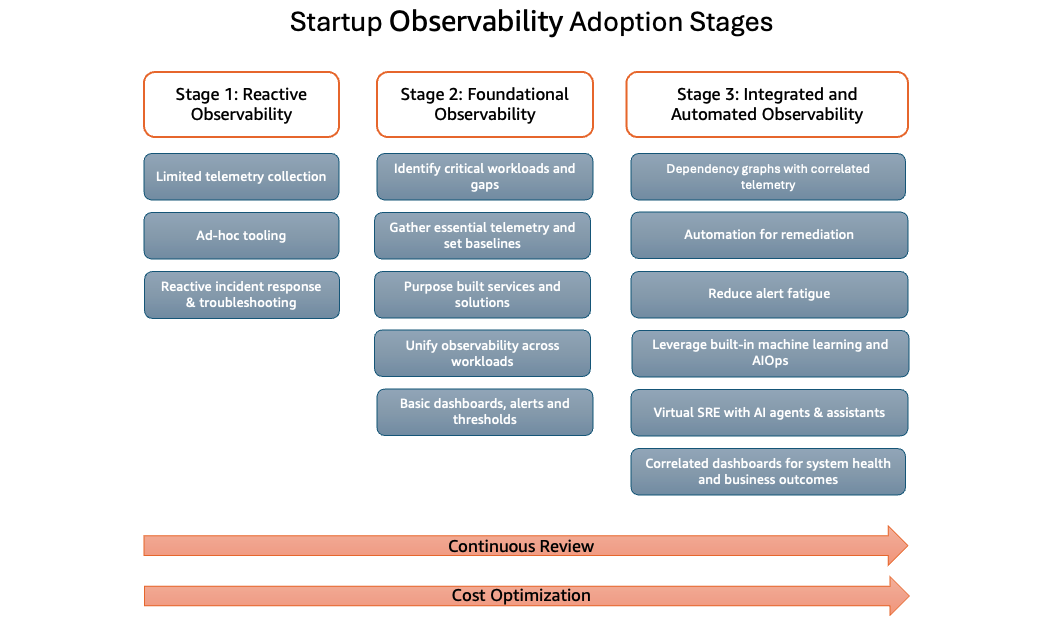
The framework spans from reactive monitoring through integrated and automated observability, with each stage building upon the previous to create increasing operational visibility. Throughout all stages, organizations should maintain focus on continuous review and cost optimization as foundational principles.
When to use this
- You are a growing organization establishing observability practices for the first time
- You want to understand where your observability capabilities sit relative to a maturity framework
- You need guidance on what to prioritize at each stage of growth
- You want to avoid common pitfalls that waste budget or create technical debt
- You are transitioning from ad-hoc monitoring tools to a unified observability platform
- You need to balance observability investment against constrained resources
Guidance
Stage 1: Reactive Observability
This is the starting point for most organizations where observability practices are largely reactive. Teams typically operate with constrained resources and focus primarily on immediate operational needs.
Key characteristics:
- Limited telemetry collection: Basic metrics, logs, and traces are gathered, but coverage is incomplete and inconsistent. Data collection may be occasional or focused only on the most critical components.
- Ad-hoc tooling: Monitoring solutions are implemented on an as-needed basis, resulting in a fragmented toolset. Teams may rely on free-tier offerings, open-source solutions without standardization, or built-in cloud provider tools with limited integration.
- Reactive incident response: Issues are discovered through customer complaints or system failures rather than proactive detection. Troubleshooting is manual, time-intensive, and dependent on individual knowledge.
Common challenges:
- Extended mean time to detect (MTTD) and resolve (MTTR)
- Difficulty reproducing and diagnosing issues
- Limited historical data for trend analysis
- Knowledge silos within engineering teams
Stage 2: Foundational Observability
This stage marks the transition from a reactive approach to an intentional observability strategy. Organizations begin implementing systematic approaches and establish groundwork for scalable practices.
Key characteristics:
-
Identify critical workloads and gaps — Define critical workloads (systems with highest impact on customer experience, revenue, or core operations) and analyze existing gaps. Build a checklist that defines critical flows, maps associated services and dependencies, assigns owners, and defines key technical signals (latency, errors, utilization) while flagging where coverage is missing.
-
Gather essential telemetry and set baselines — Track consistent metrics across three categories:
- Core service health: CPU, memory, DB connections, p95/p99 response times, requests per second, 4xx/5xx error rates
- Reliability and availability: Uptime and SLOs, incident metrics (MTTR, alert volume), customer impact indicators
- Product and business metrics: Revenue rate, transaction success rate, churn and retention, active sessions, cost per tenant
-
Leverage purpose-built services — Managed AWS observability platforms reduce operational overhead. Amazon CloudWatch for metrics and logs combined with AWS X-Ray for distributed tracing delivers deep, real-time visibility with minimal configuration. Pay-as-you-go pricing combined with savings from not managing monitoring infrastructure lets teams focus on product features.
-
Unify observability across workloads — Standardize telemetry through shared data models, consistent naming conventions, and standard frameworks such as OpenTelemetry. Adopting an extensible platform like Amazon CloudWatch provides a single source of truth and supports faster incident detection as the business scales.
-
Establish basic dashboards, alerts, and thresholds — CloudWatch provides metrics for core AWS services, alarms that evaluate against thresholds, and dashboards that visualize system health. CloudWatch recommended alarms help teams identify best-practice metrics and thresholds for managed services.
Common outcomes:
- Reduced incident response times
- Improved cross-team collaboration and knowledge sharing
- Standardized operational procedures
- Foundation for data-driven decision making
Stage 3: Integrated and Automated Observability
This represents mature practices where organizations leverage sophisticated tooling, automation, and machine learning for operational excellence. Observability becomes deeply integrated into both technical operations and business strategy.
Key characteristics:
-
Dependency graphs with correlated telemetry — Use Amazon CloudWatch Application Signals, Application Maps, and AWS X-Ray trace maps to automatically discover and visualize services, dependencies, and cross-account interactions. This enables quick assessment of blast radius during incidents.
-
Automation for remediation — Orchestrate AWS services including Amazon EventBridge, AWS Lambda, and AWS Systems Manager to trigger automated remediation based on alert conditions.
-
Reduced alert fatigue — Map alerts to critical services, SLOs, and customer-impacting behaviors. Group and correlate related conditions, apply dynamic thresholds, and suppress alerts during maintenance windows.
-
Built-in machine learning and AIOps — CloudWatch Anomaly Detection learns normal baselines and surfaces anomalous behavior without static thresholds. CloudWatch Log Anomaly Detection clusters patterns and identifies new or unexpected errors. X-Ray Insights detects anomalies in application performance. CloudWatch Investigations provides generative AI-driven assistance for incident response.
-
Correlated dashboards for system health and business outcomes — Present telemetry through both technical and business impact lenses so latency spikes are immediately visible as degraded user journeys or reduced transaction completion.
Common outcomes:
- Significant reduction in manual operational overhead
- Proactive issue prevention and prediction
- Clear visibility into business impact of technical decisions
- Enhanced customer experience through improved reliability
Anti-patterns and common pitfalls
Treating observability as a one-time initiative
Positioning observability as a finite project with a defined end date leads to stale dashboards, misaligned or silent alarms, and incomplete coverage as new services are introduced. Observability must be managed as a persistent capability, with regular reviews and iterative enhancements tied to architectural evolution and changing requirements.
Not following a staged crawl-walk-run approach
Designing a highly complex observability stack early on — for example, multi-region, multi-tenant telemetry pipelines with extensive custom enrichment — introduces significant operational overhead without proven business value. Establish a minimal but robust baseline first, then progressively introduce advanced capabilities as workload complexity justifies additional investment.
Collecting high-volume telemetry without clear objectives
Ingesting all logs, metrics, and traces at full fidelity without defined use cases drives excessive cardinality, degraded query performance, and high storage costs. Define explicit objectives, scope telemetry collection to those objectives, and apply sampling, aggregation, and filtering strategies. For example, reducing nonessential labels (granular request IDs, dynamic user identifiers) helps control cardinality, lowers costs, and speeds up queries.
Premature lock-in to a single observability vendor
Coupling instrumentation libraries, data schemas, and runbooks to a single vendor in early stages increases migration risk and limits flexibility as data volume grows. Use managed services that follow open standards like OpenTelemetry for instrumentation and data transport. This allows shifting to cost-effective options or diversifying observability tools without large-scale re-instrumentation.
Adopting a tool-centric rather than culture-centric model
Simply enabling services (CloudWatch, X-Ray, or third-party APM) without engineering teams actively instrumenting code paths and using telemetry in their workflows does not yield effective observability. Teams must incorporate observability into development and operations — defining and owning health signals, embedding dashboards into incident response, and using telemetry to inform design and capacity planning.
Absence of governance for telemetry and metadata standards
Allowing each team to independently define metric names, label sets, log formats, and trace attributes produces fragmented datasets that are difficult to join and correlate. Establish and enforce telemetry governance including standardized naming conventions, required dimensions (service, environment, region, tenant), and shared schemas via common libraries and templates.
Neglecting customer-centric and user experience indicators
Focusing primarily on infrastructure-level signals (CPU, memory, disk) while omitting user-centric and business KPIs obscures actual customer impact. An API may appear healthy at the host level while customers experience degraded journeys due to elevated latency or error rates on key flows. Model these signals as first-class SLOs tied to user experience.
Lack of defined data retention and tiering policies
Relying on default or unbounded retention for logs and metrics leads to uncontrolled growth in storage and analytics costs. Define tiered retention policies per telemetry class: short-term high-resolution data for incident response, downsampled metrics for long-term trend analysis, and lifecycle rules to archive or purge obsolete data.
Progression considerations
Advancement through these stages is not strictly linear. Organizations may exhibit characteristics of multiple stages simultaneously. The appropriate pace depends on:
- Growth rate and scaling requirements
- Available engineering resources and expertise
- Budget constraints and investment priorities
- Regulatory and compliance obligations
Assess your current state, prioritize improvements based on business impact, and invest incrementally to advance observability in alignment with operational needs and strategic objectives.
Related
- Observability Strategy — Strategic guidance for leaders on tying observability to business outcomes
- Observability Maturity Model — A staged assessment model for evaluating maturity levels
- AWS Well-Architected Operational Excellence Pillar