Java Spring Integration பயன்பாடுகளை Instrument செய்தல்
இந்த கட்டுரை Spring-Integration பயன்பாடுகளை Open Telemetry மற்றும் X-ray பயன்படுத்தி கைமுறையாக instrument செய்வதற்கான அணுகுமுறையை விவரிக்கிறது.
Spring-Integration framework event-driven architectures மற்றும் messaging-centric architectures-க்கு பொதுவான integration solutions-ன் மேம்பாட்டை இயக்க வடிவமைக்கப்பட்டுள்ளது. மறுபுறம், OpenTelemetry micro services architectures-ல் அதிகம் கவனம் செலுத்துகிறது, அதில் services HTTP requests பயன்படுத்தி ஒருவருக்கொருவர் தொடர்பு கொள்கின்றன மற்றும் ஒருங்கிணைக்கின்றன. எனவே இந்த வழிகாட்டி OpenTelemetry API-உடன் manual instrumentation பயன்படுத்தி Spring-Integration பயன்பாடுகளை எவ்வாறு instrument செய்வது என்பதற்கான எடுத்துக்காட்டை வழங்கும்.
பின்னணி தகவல்
Tracing என்றால் என்ன?
OpenTelemetry ஆவணத்திலிருந்து பின்வரும் மேற்கோள் trace-ன் நோக்கம் என்ன என்பதற்கான நல்ல மேலோட்டத்தை வழங்குகிறது:
Traces give us the big picture of what happens when a request is made to an application. Whether your application is a monolith with a single database or a sophisticated mesh of services, traces are essential to understanding the full “path” a request takes in your application.
Given that one of the main benefits of tracing is end-to-end visibility of a request, it is important for traces to link properly all the way from the request origin to the backend. A common way of doing this in OpenTelemetry is to utilize nested spans. This works in a microservices architecture where the spans are passed from service to service until they reach the final destination. In a Spring Integration application, we need to create parent/child relationships between spans created both remotely AND locally.
Context Propagation பயன்படுத்தி Tracing
Context propagation பயன்படுத்தும் அணுகுமுறையை நிரூபிப்போம். இந்த அணுகுமுறை பாரம்பரியமாக locally மற்றும் remote locations-ல் உருவாக்கப்பட்ட spans-க்கு இடையே parent/child relationship உருவாக்க வேண்டியபோது பயன்படுத்தப்படும் என்றாலும், Spring Integration Application-க்கு பயன்படுத்தப்படும், ஏனெனில் இது code-ஐ எளிதாக்குகிறது மற்றும் application-ஐ scale செய்ய அனுமதிக்கும்: பல threads-ல் messages-ஐ parallel-ஆக process செய்ய முடியும், மேலும் வெவ்வேறு hosts-ல் messages-ஐ process செய்ய வேண்டுமானால் horizontally scale செய்யவும் முடியும்.
இதை அடைய என்ன தேவை என்பதற்கான மேலோட்டம் இங்கே:
-
Create a
ChannelInterceptorand register it as aGlobalChannelInterceptorso that it can capture messages being sent across all channels. -
In the
ChannelInterceptor:- In the
preSendmethod:- try to read the context from the previous message that is being generated upstream.This is where we are able to connect spans from upstream messages. If no context exists, a new trace is started (this is done by the OpenTelemetry SDK).
- Create a Span with a unique name that identifies that operation. This can be the name of the channel where this message is being processed.
- Save current context in the message.
- Store the context and scope in thread.local so that they can be closed afterwards.
- inject context in the message being sent downstream.
- In the
afterSendCompletion:- Restore the context and scope from thread.local
- Recreate the span from the context.
- Register any exceptions raised while processing the message.
- Close Scope.
- End Span.
- In the
இது செய்ய வேண்டியவற்றின் எளிமைப்படுத்தப்பட்ட விளக்கமாகும். Spring-Integration framework பயன்படுத்தும் செயல்படும் மாதிரி application-ஐ வழங்குகிறோம். இந்த application-ன் code இங்கே காணலாம்.
Application-ஐ instrument செய்ய செய்யப்பட்ட மாற்றங்களை மட்டும் பார்க்க, இந்த diff-ஐ பார்க்கவும்.
இந்த மாதிரி application-ஐ இயக்க பயன்படுத்தவும்:
# build and run
mvn spring-boot:run
# create sample input file to trigger flow
echo 'testcontent\nline2content\nlastline' > /tmp/in/testfile.txt
இந்த மாதிரி application-ஐ பரிசோதிக்க, application-உடன் ஒரே machine-ல் ADOT collector பின்வருவதைப் போன்ற configuration-உடன் இயங்க வேண்டும்:
receivers:
  otlp:
    protocols:
      grpc:
        endpoint: 0.0.0.0:4317
      http:
        endpoint: 0.0.0.0:4318
processors:
  batch/traces:
    timeout: 1s
    send_batch_size: 50
  batch/metrics:
    timeout: 60s
exporters:
  aws xray: region:us-west-2
  aws emf:
    region: us-west-2
service:
  pipelines:
    traces:
      receivers: [otlp]
      processors: [batch/traces]
      exporters: [awsxray]
    metrics:
      receivers: [otlp]
      processors: [batch/metrics]
      exporters: [awsemf]
முடிவுகள்
மாதிரி application-ஐ இயக்கி பின்வரும் command-ஐ இயக்கினால், இதைப் பெறுவோம்:
echo 'foo123\nbar123\nfoo1234' > /tmp/in/testfile.txt
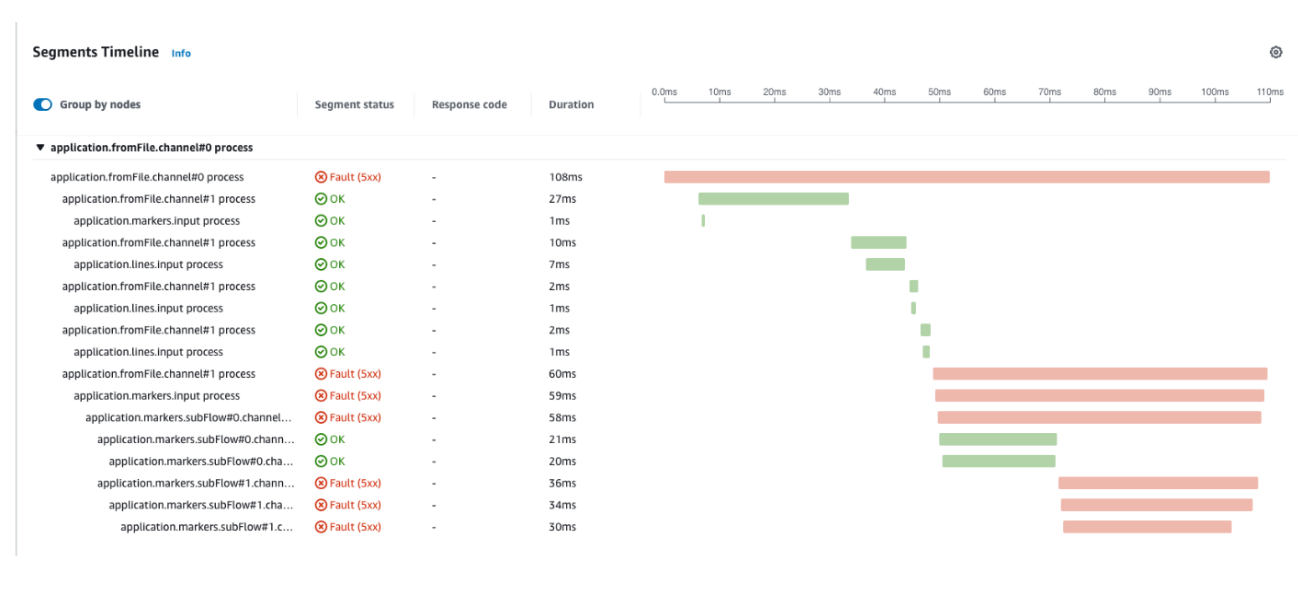
மேலே உள்ள segments மாதிரி application-ல் விவரிக்கப்பட்ட workflow-உடன் பொருந்துவதைக் காணலாம். சில messages process செய்யப்படும்போது Exceptions எதிர்பார்க்கப்படுகின்றன, எனவே அவை சரியாக பதிவு செய்யப்படுவதையும் X-Ray-ல் troubleshoot செய்ய அனுமதிக்கும் என்பதையும் காணலாம்.
அடிக்கடி கேட்கப்படும் கேள்விகள்
Nested spans-ஐ எவ்வாறு உருவாக்குவது?
OpenTelemetry-ல் spans-ஐ இணைக்கப் பயன்படுத்தக்கூடிய மூன்று mechanisms உள்ளன:
வெளிப்படையாக (Explicitly)
Parent span-ஐ child span உருவாக்கப்படும் இடத்திற்கு அனுப்பி, இரண்டையும் பின்வருவனவற்றைப் பயன்படுத்தி இணைக்க வேண்டும்:
    Span childSpan = tracer.spanBuilder("child")
    .setParent(Context.current().with(parentSpan))
    .startSpan();
மறைமுகமாக (Implicitly)
Span context thread.local-ல் உள்ளடக்கமாக சேமிக்கப்படும். இந்த method நீங்கள் ஒரே thread-ல் spans உருவாக்குகிறீர்கள் என்று உறுதியாக இருக்கும்போது சுட்டிக்காட்டப்படுகிறது.
    void parentTwo() {
        Span parentSpan = tracer.spanBuilder("parent").startSpan();
        try(Scope scope = parentSpan.makeCurrent()) {
            childTwo();
        } finally {
        parentSpan.end();
        }
    }
    void childTwo() {
        Span childSpan = tracer.spanBuilder("child")
            // NOTE: setParent(...) is not required;
            // `Span.current()` is automatically added as the parent
            .startSpan();
        try(Scope scope = childSpan.makeCurrent()) {
            // do stuff
        } finally {
            childSpan.end();
        }
    }
Context Propagation
இந்த method context-ஐ எங்காவது (HTTP headers அல்லது message-ல்) சேமிக்கும், இதனால் child span உருவாக்கப்படும் remote location-க்கு கொண்டு செல்ல முடியும். Remote location ஆக இருக்க வேண்டும் என்ற கடுமையான தேவை இல்லை. இதே process-லும் பயன்படுத்தலாம்.
OpenTelemetry properties X-Ray properties-ஆக எவ்வாறு மொழிபெயர்க்கப்படுகின்றன?
உறவை காண பின்வரும் வழிகாட்டியைப் பார்க்கவும்.