AWS Lambda அடிப்படையிலான Serverless Observability
விநியோகிக்கப்பட்ட அமைப்புகள் மற்றும் serverless computing உலகில், observability ஐ அடைவது பயன்பாட்டு நம்பகத்தன்மை மற்றும் செயல்திறனை உறுதிசெய்வதற்கான திறவுகோலாகும். இது பாரம்பரிய கண்காணிப்பை விட அதிகமானதை உள்ளடக்குகிறது. Amazon CloudWatch மற்றும் AWS X-Ray போன்ற AWS observability கருவிகளை பயன்படுத்துவதன் மூலம், உங்கள் serverless பயன்பாடுகளில் நுண்ணறிவுகளைப் பெறலாம், சிக்கல்களைத் தீர்க்கலாம், பயன்பாட்டு செயல்திறனை மேம்படுத்தலாம். இந்த வழிகாட்டியில், உங்கள் Lambda அடிப்படையிலான serverless பயன்பாட்டின் Observability ஐ செயல்படுத்த அத்தியாவசிய கருத்துக்கள், கருவிகள் மற்றும் சிறந்த நடைமுறைகளைக் கற்றுக்கொள்வோம்.
உங்கள் உள்கட்டமைப்பு அல்லது பயன்பாட்டிற்கு observability ஐ செயல்படுத்துவதற்கு முன் முதல் படி உங்கள் முக்கிய நோக்கங்களை தீர்மானிப்பதாகும். இது மேம்படுத்தப்பட்ட பயனர் அனுபவம், அதிகரித்த டெவலப்பர் உற்பத்தித்திறன், service level objectives (SLOs) களை சந்திப்பது, வணிக வருவாயை அதிகரிப்பது அல்லது உங்கள் பயன்பாட்டு வகையைப் பொறுத்து வேறு ஏதேனும் குறிப்பிட்ட நோக்கமாக இருக்கலாம். எனவே, இந்த முக்கிய நோக்கங்களை தெளிவாக வரையறுத்து அவற்றை எவ்வாறு அளவிடுவீர்கள் என்பதை நிறுவுங்கள். பின்னர் அங்கிருந்து backwards work செய்து உங்கள் observability strategy ஐ வடிவமைக்கவும். மேலும் அறிய “Monitor what matters” ஐப் பார்க்கவும்.
Observability இன் தூண்கள்
Observability க்கு மூன்று முக்கிய தூண்கள் உள்ளன:
- Logs: Timestamped records of discrete events that happened within an application or system, such as a failure, an error, or a state transformation
- Metrics: Numeric data measured at various time intervals (time series data); SLIs (request rate, error rate, duration, CPU%, etc.)
- Traces: A trace represents a single user’s journey across multiple applications and systems (usually microservices)
AWS offers both Native and Open source tools to facilitate logging, monitoring metrics, and tracing to obtain actionable insights for your AWS Lambda application.
Logs
In this section of the observability best practices guide, we will deep dive on to following topics:
- Unstructured vs structured logs
- CloudWatch Logs Insights
- Logging correlation Id
- Code Sample using Lambda Powertools
- Log visualization using CloudWatch Dashboards
- CloudWatch Logs Retention
Logs are discrete events that have occurred within your application. These can include events like failures, errors, execution path or something else. Logs can be recorded in unstructured, semi-structured, or structured formats.
Unstructured vs structured logs
We often see developers start with simple log messages within their application using print or console.log statements. These are difficult to parse and analyze programmatically at scale, particularly in a AWS Lambda based applications that can generate many lines of log messages across different log groups. As a result, consolidating these logs in CloudWatch becomes challenging and hard to analyze. You would need to do text match or regular expressions to find relevant information in the logs. Here’s is an example of what unstructured logging looks like:
[2023-07-19T19:59:07Z]  INFO  Request started
[2023-07-19T19:59:07Z]  INFO  AccessDenied: Could not access resource
[2023-07-19T19:59:08Z]  INFO  Request finished
As you can see, the log messages lack a consistent structure, making it challenging to get useful insights from it. Also, it is hard to add contextual information to it.
Whereas structured logging is a way to log information in a consistent format, often in JSON, that allows logs to be treated as data rather than text, which makes querying and filtering simple. It gives developers the ability to efficiently store, retrieve, and analyze the logs programmatically. It also facilitates better debugging. Structured logging provides a simpler way to modify the verbosity of logs across different environments through log levels. Pay attention to logging levels. Logging too much will increase costs and decrease application throughput. Ensure personal identifiable information is redacted before logging. Here’s is an example of what structured logging looks like:
{
   "correlationId": "9ac54d82-75e0-4f0d-ae3c-e84ca400b3bd",
   "requestId": "58d9c96e-ae9f-43db-a353-c48e7a70bfa8",
   "level": "INFO",
   "message": "AccessDenied",
   "function-name": "demo-observability-function",
   "cold-start": true
}
Prefer structured and centralized logging into CloudWatch logs to emit operational information about transactions, correlation identifiers across different components, and business outcomes from your application.
CloudWatch Logs Insights
Use CloudWatch Logs Insights, which can automatically discover fields in JSON formatted logs. In addition, JSON logs can be extended to log custom metadata specific to your application that can be used to search, filter, and aggregate your logs.
Logging correlation Id
For example, for an http request coming in from API Gateway, the correlation Id is set at the requestContext.requestId path, which can be easily extracted and logged in the downstream Lambda functions using Lambda powertools. Distributed systems often involve multiple services and components working together to handle a request. So, logging correlation Id and passing them to downstream systems becomes crucial for end-to-end tracing and debugging. A correlation Id is a unique identifier assigned to a request at the very beginning. As the request moves through different services, the correlation Id is included in the logs, allowing you to trace the entire path of the request. You can either manually insert correlation Id to your AWS Lambda logs or use tools like AWS Lambda powertools to easily grab the correlation Id the from API Gateway and log it along with your application logs. For example, for an http request correlation Id could be a request-id which can be initiated at API Gateway and then passed on to your backend services like Lambda functions.
Code Sample using Lambda Powertools
As a best practice, generate a correlation Id as early as possible in the request lifecycle, preferably at the entry point of your serverless application, such as API Gateway or application load balancer. Use UUIDs, or request id or any other unique attribute which can used to track the request across distributed systems. Pass the correlation id along with each request either as part of the custom header, body or metadata. Ensure that correlation Id is included in all the log entries and traces in your downstream services.
You can either manually capture and include correlation Id as part of your Lambda function logs or use tools like AWS Lambda Powertools. With Lambda Powertools, you can easily grab the correlation Id from predefined request path mapping for supported upstream services and automatically add it alongside your application logs. Also, ensure that correlation Id is added to all your error messages to easily debug and identify the root cause in case of failures and tie it back to the original request.
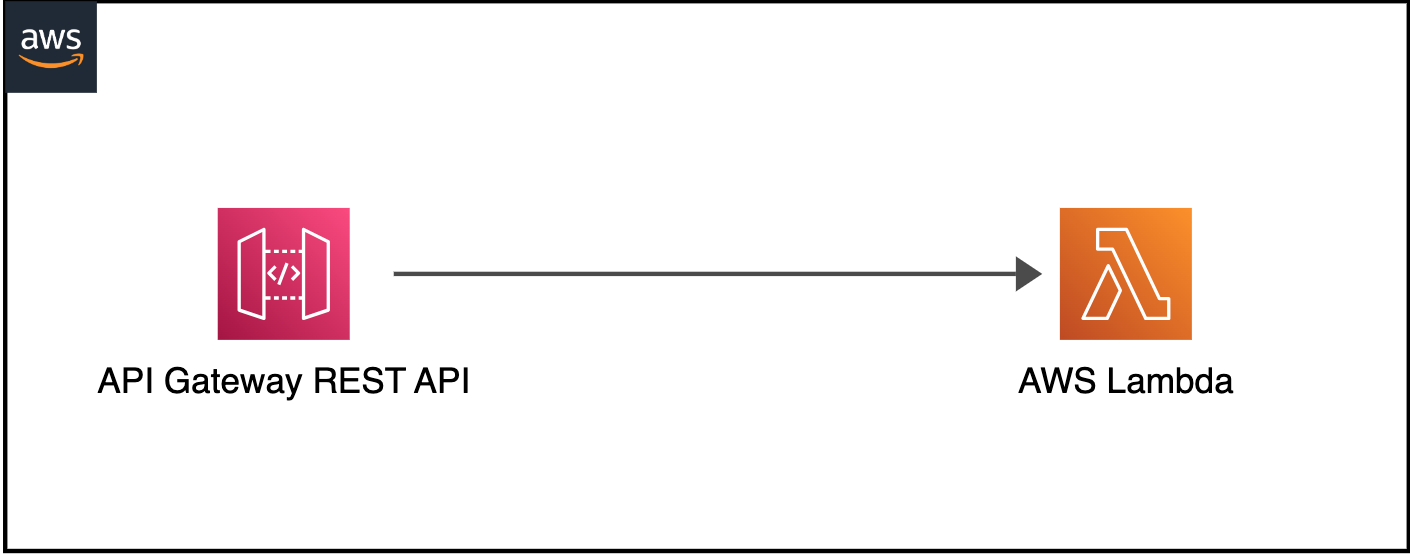
Let's look at the code sample to demostrate structured logging with correlation id and viewing it in CloudWatch for below serverless architecture:
// Initializing Logger
Logger log = LogManager.getLogger();

// Uses @Logger annotation from Lambda Powertools, which takes optional parameter correlationIdPath to extract correlation Id from the API Gateway header and inserts correlation_id to the Lambda function logs in a structured format.
@Logging(correlationIdPath = "/headers/path-to-correlation-id")
public APIGatewayProxyResponseEvent handleRequest(final APIGatewayProxyRequestEvent input, final Context context) {
  ...
  // The log statement below will also have additional correlation_id
  log.info("Success")
  ...
}
In this example, a Java based Lambda function is using Lambda Powertools library to log correlation_id coming in from the api gateway request.
Sample CloudWatch logs for the code sample:
{
   "level": "INFO",
   "message": "Success",
   "function-name": "demo-observability-function",
   "cold-start": true,
   "lambda_request_id": "52fdfc07-2182-154f-163f-5f0f9a621d72",
   "correlation_id": "<correlation_id_value>"
}_
Log visualization using CloudWatch Dashboards
Once you log the data in structured JSON format, CloudWatch Logs Insights then automatically discovers values in JSON output and parses the messages as fields. CloudWatch Logs insights provides purpose-built SQL-like query language to search and filter multiple log streams. You can perform queries over multiple log groups using glob and regular expressions pattern matching. In addition, you can also write your custom queries and save them to re-run it again without having to re-create them each time.
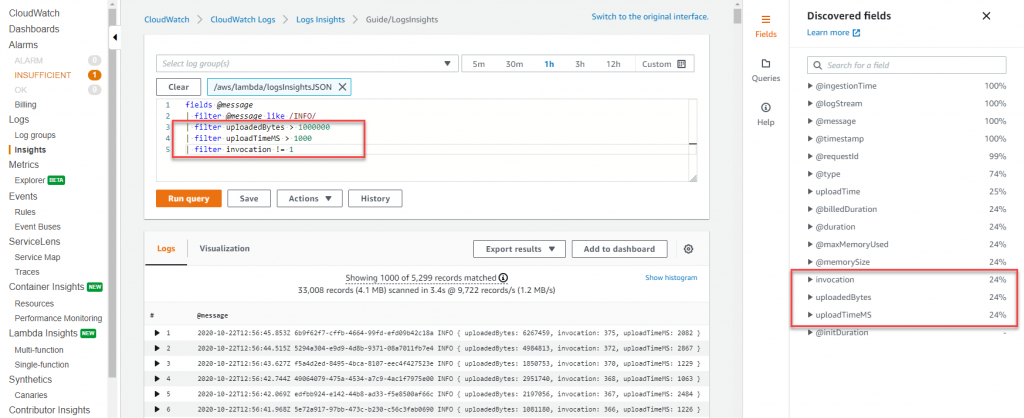 In CloudWatch logs insights, you can generate visualizations like line charts, bar charts, and stacked area charts from your queries with one or more aggregation functions. You can then easily add these visualization to the CloudWatch Dashboards. Sample dashboard below shows percentile report of Lambda function’s execution duration. Such dashboards will quickly give you insights on where you should focus on improve application performance. Average latency is a good metrics to look at but
 you should aim to optimize for p99 and not the average latency.
 To send (platform, function and extensions) logs to locations other than CloudWatch, you could use Lambda Telemetry API with Lambda Extensions. A number of partner solutions provide Lambda layers which use the Lambda Telemetry API and make integration with their systems easier.
To make the best use of CloudWatch logs insights, think about what data you must be ingesting into your logs in the form of structured logging, which will then help better monitor the health of your application.
CloudWatch Logs Retention
By default all messages that are written to stdout in your Lambda function are saved to an Amazon CloudWatch log stream. Lambda function's execution role should have permission to create CloudWatch log streams and write log events the streams. It is important to be aware that CloudWatch is billed by the amount of data ingested, and the storage used. Therefore, reducing the amount of logging will help you minimize the associated cost. By default CloudWatch logs are kept indefinitely and never expire. It is recommended to configure log retention policy to reduce log-storage costs, and apply it across all your log groups. You might want differing retention policies per environment. Log retention can be configured manually in the AWS console but to ensure consistency and best practices, you should configure it as part of your Infrastructure as Code (IaC) deployments. Below is a sample CloudFormation template that demonstrates how to configuring Log Retention for Lambda function:
Resources:
  Function:
    Type: AWS::Serverless::Function
    Properties:
      CodeUri: .
      Runtime: python3.8
      Handler: main.handler
      Tracing: Active

  # Explicit log group that refers to the Lambda function
  LogGroup:
    Type: AWS::Logs::LogGroup
    Properties:
      LogGroupName: !Sub "/aws/lambda/${Function}"
      # Explicit retention time
      RetentionInDays: 7
In this example, we created a Lambda function and corresponding log group. The RetentionInDays property is set to 7 days, meaning that logs in this log group will be retained for 7 days before they are automatically deleted, thus helping to control log storage cost.
Metrics
In this section of Observability best practices guide, we will deep dive on to following topics:
- Monitor and alert on out-of-the-box metrics
- Publish custom metrics
- Use embedded-metrics to auto generate metrics from your logs
- Use CloudWatch Lambda Insights to monitor system-level metrics
- Creating CloudWatch Alarms
Monitor and alert on out-of-the-box metrics
Metrics are numeric data measured at various time intervals (time series data) and service-level indicators (request rate, error rate, duration, CPU, etc.). AWS services provide a number of out-of-the-box standard metrics to help monitor the operational health of your application. Establish key metrics applicable for your application and use them for monitor performance of your application. Examples of key metrics may include function errors, queue depth, failed state machine executions, and api response times.
One challenge with out-of-the-box metrics is knowing how to analyze them in a CloudWatch dashboard. For example, when looking at Concurrency, do I look at max, average, or percentile? And the right statistics to monitor differs for each metric.
As best practices, for Lambda function’s ConcurrentExecutions metrics look at the Count statistics to check if it is getting close to the account and regional limit or close to the Lambda reserved concurrency limit if applicable.
For Duration metric, which indicates how long your function takes to process an event, look at the Average or Max statistic. For measuring the latency of your API, look at the Percentile statistics for API Gateway’s Latency metrics. P50, P90, and P99 are much better methods of monitoring latency over averages.
Once you know what metrics to monitor, configure alerts on these key metrics to engage you when components of your application are unhealthy. For Example
- For AWS Lambda, alert on Duration, Errors, Throttling, and ConcurrentExecutions. For stream-based invocations, alert on IteratorAge. For Asynchronous invocations, alert on DeadLetterErrors.
- For Amazon API Gateway, alert on IntegrationLatency, Latency, 5XXError, 4XXError
- For Amazon SQS, alert on ApproximateAgeOfOldestMessage, ApproximateNumberOfMessageVisible
- For AWS Step Functions, alert on ExecutionThrottled, ExecutionsFailed, ExecutionsTimedOut
Publish custom metrics
Identify key performance indicators (KPIs) based on desired business and customer outcomes for your application. Evaluate KPIs to determine application success and operational health. Key metrics may vary depending on the type of application, but examples include site visited, orders placed, flights purchased, page load time, unique visitors etc.
One way to publish custom metrics to AWS CloudWatch is by calling CloudWatch metrics SDK’s putMetricData API. However, putMetricData API call is synchronous. It will increase the duration of your Lambda function and it can potentially block other API calls in your application, leading to performance bottlenecks. Also, longer execution duration of your Lambda function will attribute towards higher cost. Additionally you are charged for both the number of custom metrics that are sent to CloudWatch and the number of API calls (i.e. PutMetricData API calls) that are made.
A more efficient and cost-effective way to publish custom metrics is with CloudWatch Embedded Metrics Format (EMF). The CloudWatch Embedded Metric format allows you to generate custom metrics asynchronously as logs written to CloudWatch logs, resulting in improved performance of your application at a lower cost. With EMF, you can embed custom metrics alongside detailed log event data, and CloudWatch automatically extracts these custom metrics so that you can visualize and set alarm on them as you would do out-of-the-box metrics. By sending logs in the embedded metric format, you can query it using CloudWatch Logs Insights, and you only pay for the query, not the cost of the metrics.
To achieve this, you can generate the logs using EMF specification, and send them to CloudWatch using PutLogEvents API. To simplify the process, there are two client libraries that support the creation of metrics in the EMF format.
- Low level client libraries (aws-embedded-metrics)
- Lambda Powertools Metrics.
Use CloudWatch Lambda Insights to monitor system-level metrics
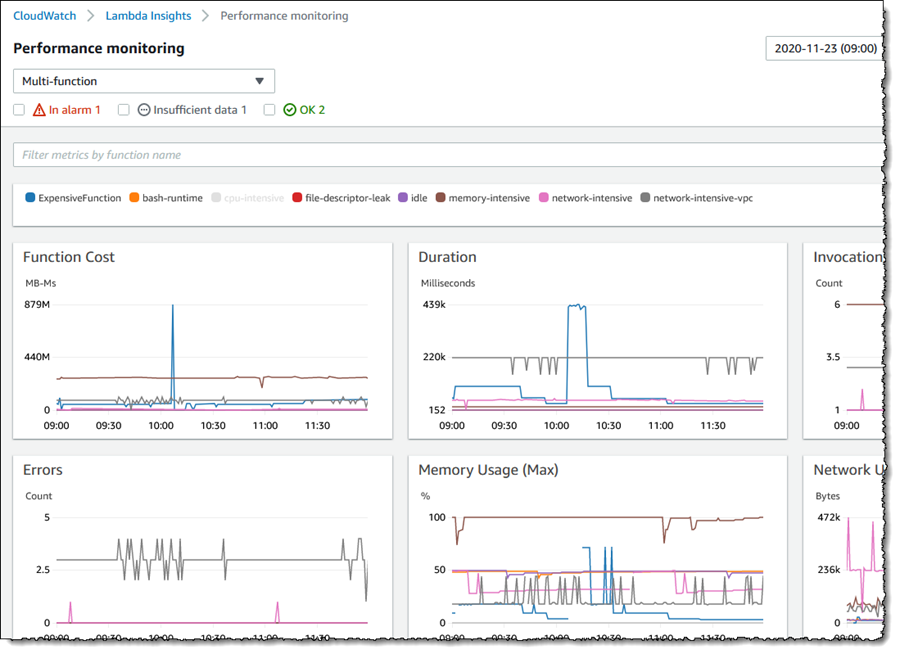
CloudWatch Lambda insights provides you system-level metrics, including CPU time, memory usage, disk utilization, and network performance. Lambda Insights also collects, aggregates, and summarizes diagnostic information, such as cold starts and Lambda worker shutdowns. Lambda Insights leverages CloudWatch Lambda extension, which is packaged as a Lambda layer. Once enabled, it collects system-level metrics and emits a single performance log event to CloudWatch Logs for every invocation of that Lambda function in the embedded metrics format.
CloudWatch Lambda Insights is not enabled by default and needs to be turned on per Lambda function.
You can enable it via AWS console or via Infrastructure as Code (IaC). Here is an example of how to enable it using the AWS serverless application model (SAM). You add LambdaInsightsExtension extension Layer to your Lambda function, and also add managed IAM policy CloudWatchLambdaInsightsExecutionRolePolicy, which gives permissions to your Lambda function to create log stream and call PutLogEvents API to be able to write logs to it.
// Add LambdaInsightsExtension Layer to your function resource
Resources:
  MyFunction:
    Type: AWS::Serverless::Function
    Properties:
      Layers:
        - !Sub "arn:aws:lambda:${AWS::Region}:580247275435:layer:LambdaInsightsExtension:14"

// Add IAM policy to enable Lambda function to write logs to CloudWatch
Resources:
  MyFunction:
    Type: AWS::Serverless::Function
    Properties:
      Policies:
        - `CloudWatchLambdaInsightsExecutionRolePolicy`
You can then use CloudWatch console to view these system-level performance metrics under Lambda Insights.
Creating CloudWatch Alarms
Creating CloudWatch Alarms and take necessary actions when metrics go off is a critical part of observability. Amazon CloudWatch alarms are used to alert you or automate remediation actions when application and infrastructure metrics exceed static or dynamically set thresholds.
To set up an alarm for a metric, you select a threshold value that triggers a set of actions. A fixed threshold value is known as a static threshold. For instance, you can configure an alarm on Throttles metrics from Lambda function to activate if it exceeds 10% of the time within a 5-min period. This could potentially mean that Lambda function has reached its max concurrency for your account and region.
In a serverless application, it is common to send an alert using SNS (Simple Notification Service). This enables users to receive alerts via email, SMS, or other channels. Additionally, you can subscribe a Lambda function to the SNS topic, allowing it to auto remediate any issues which caused the alarm to go off.
For example, Let’s say you have a Lambda function A, which is polling an SQS queue and calling a downstream service. If downstream service is down and not responding, Lambda function will continue to poll from SQS and try calling downstream service with failures. While you can monitor these errors and generate a CloudWatch alarm using SNS to notify appropriate team, you can also call another Lambda function B (via SNS subscription), which can disable the event-source-mapping for the Lambda function A and thus stopping it from polling SQS queue, until the downstream service is back up and running.
While setting up alarms on an individual metric is good, sometimes monitoring multiple metrics becomes necessary to better understand the operational health and performance of your application. In such a scenario, you should setup alarms based on multiple metrics using metric math expression.
For example, if you want to monitor AWS Lambda errors but allow a small number of errors without triggering your alarm, y you can create an error rate expression in the form of a percentage. i.e. ErrorRate = errors / invocation * 100, then create an alarm to send an alert if the ErrorRate goes above 20% within the configured evaluation period.
Tracing
In this section of Observability best practices guide, we will deep dive on to following topics:
- Introduction to distributed tracing and AWS X-Ray
- Apply appropriate sampling rule
- Use X-Ray SDK to trace interaction with other services
- Code Sample for tracing integrated services using X-Ray SDK
Introduction to distributed tracing and AWS X-Ray
Most serverless applications consist of multiple microservices, each using multiple AWS services. Due to the nature of serverless architectures, it’s crucial to have distributed tracing. For effective performance monitoring and error tracking, it is important to trace the transaction across entire application flow, from the source caller through all the downstream services. While it’s possible to achieve this using individual service’s logs, it’s faster and more efficient to use a tracing tool like AWS X-Ray. See Instrumenting your application with AWS X-Ray for more information.
AWS X-Ray enables you to trace requests as it flows through the involved microservices. X-Ray Service maps enables you to understand different integration points and identify any performance degradation of your application. You can quickly isolate which component of you application is causing errors, throttling or having latency issues with just few clicks. Under the service graph, you can also individual traces to pinpoint the exact duration taken by each microservice.
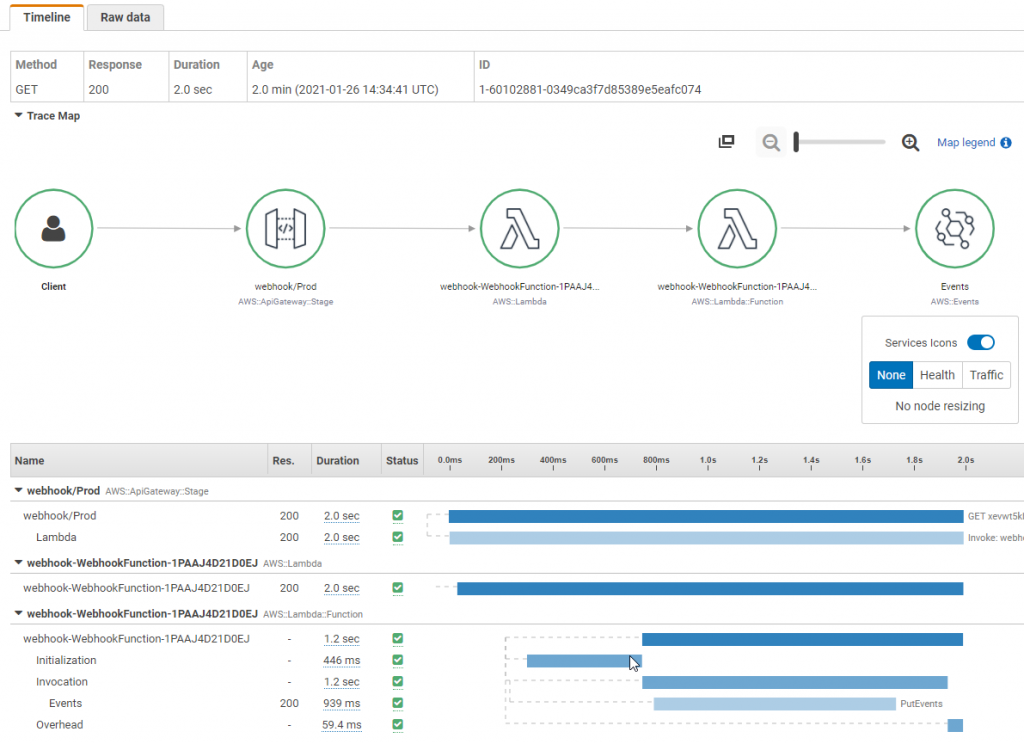
As a best practice, create custom subsegments in your code for downstream calls or any specific functionality that requires monitoring. For instance, you can create a subsegment to monitor a call to an external HTTP API, or an SQL database query.
For example, To create a custom subsegment for a function that makes calls to downstream services, use the captureAsyncFunc function (in node.js)
var AWSXRay = require('aws-xray-sdk');

app.use(AWSXRay.express.openSegment('MyApp'));

app.get('/', function (req, res) {
  var host = 'api.example.com';

  // start of the subsegment
  AWSXRay.captureAsyncFunc('send', function(subsegment) {
    sendRequest(host, function() {
      console.log('rendering!');
      res.render('index');

      // end of the subsegment
      subsegment.close();
    });
  });
});
In this example, the application creates a custom subsegment named send for calls to the sendRequest function. captureAsyncFunc passes a subsegment that you must close within the callback function when the asynchronous calls that it makes are complete.
Apply appropriate sampling rule
AWS X-Ray SDK does not trace all requests by default. It applies a conservative sampling rule to provide a representative sample of the requests without incurring high cost. However, you can customize the default sampling rule or disable sampling altogether and start tracing all your requests based on your specific requirements.
It’s important to note that AWS X-Ray is not intended to be used as an audit or compliance tool. You should consider having different sampling rate for different type of application. For instance, high-volume read-only calls, like background polling, or health checks can be sampled at a lower rate while still providing enough data to identify any potential issues that may arise. You may also want to have different sampling rate per environment. For instance, in your development environment, you may want all your requests to be traced to troubleshoot any errors or performance issues easily, whereas for production environment you may have lower number of traces. You should also keep in mind that extensive tracing can result in increased cost. For more information about sampling rules, see Configuring sampling rules in the X-Ray console.
Use X-Ray SDK to trace interaction with other AWS services
While X-Ray tracing can be easily enabled for services like AWS Lambda and Amazon API Gateway, with just few clicks or few lines on your IaC tool, other services require additional steps to instrument their code. Here is the complete list of AWS Services integrated with X-Ray.
To instrument calls to the services which are not integrated with X-Ray, such as DynamoDB, you can capture traces by wrapping AWS SDK calls with the AWS X-Ray SDK. For instance, when using node.js, you can follow below code example to capture all AWS SDK calls:
Code sample for tracing integrated services using X-Ray SDK
//... FROM (old code)
const AWS = require('aws-sdk');

//... TO (new code)
const AWSXRay = require('aws-xray-sdk-core');
const AWS = AWSXRay.captureAWS(require('aws-sdk'));
...
To instrument individual clients wrap your AWS SDK client in a call to AWSXRay.captureAWSClient. Do not use both captureAWS and captureAWSClient together. This will lead to duplicate traces.
Additional Resources
சுருக்கம்
AWS Lambda அடிப்படையிலான serverless பயன்பாட்டிற்கான இந்த observability சிறந்த நடைமுறை வழிகாட்டியில், Amazon CloudWatch மற்றும் AWS X-Ray போன்ற Native AWS சேவைகளைப் பயன்படுத்தி logging, metrics மற்றும் tracing போன்ற முக்கியமான அம்சங்களை எடுத்துக்காட்டினோம். உங்கள் பயன்பாட்டில் observability சிறந்த நடைமுறைகளை எளிதாகச் சேர்க்க AWS Lambda Powertools நூலகத்தைப் பயன்படுத்த பரிந்துரைத்தோம். இந்த சிறந்த நடைமுறைகளை ஏற்றுக்கொள்வதன் மூலம், உங்கள் serverless பயன்பாட்டில் மதிப்புமிக்க நுண்ணறிவுகளை திறக்கலாம், வேகமான பிழை கண்டறிதல் மற்றும் செயல்திறன் மேம்படுத்தலை செயல்படுத்தலாம்.
மேலும் ஆழமாக அறிய, AWS One Observability Workshop இன் AWS Native Observability module ஐ பயிற்சி செய்ய மிகவும் பரிந்துரைக்கிறோம்.