Internet Monitor
As of this writing, Internet Monitor is available in preview in the CloudWatch console. The scope of features for general availability may change from what you experience today.
Collecting telemetry from all tiers of your workload is a best practice, and one that can be a challenge. But what are the tiers of your workload? For some it may be web, application, and database servers. Other people might view their workload as front end and back end. And those operating web applications can use Real User Monitoring(RUM) to observe the health of these apps as experienced by end users.
But what about the traffic between the client and the datacenter or cloud services provider? And for applications that are not served as web pages and therefore cannot use RUM?
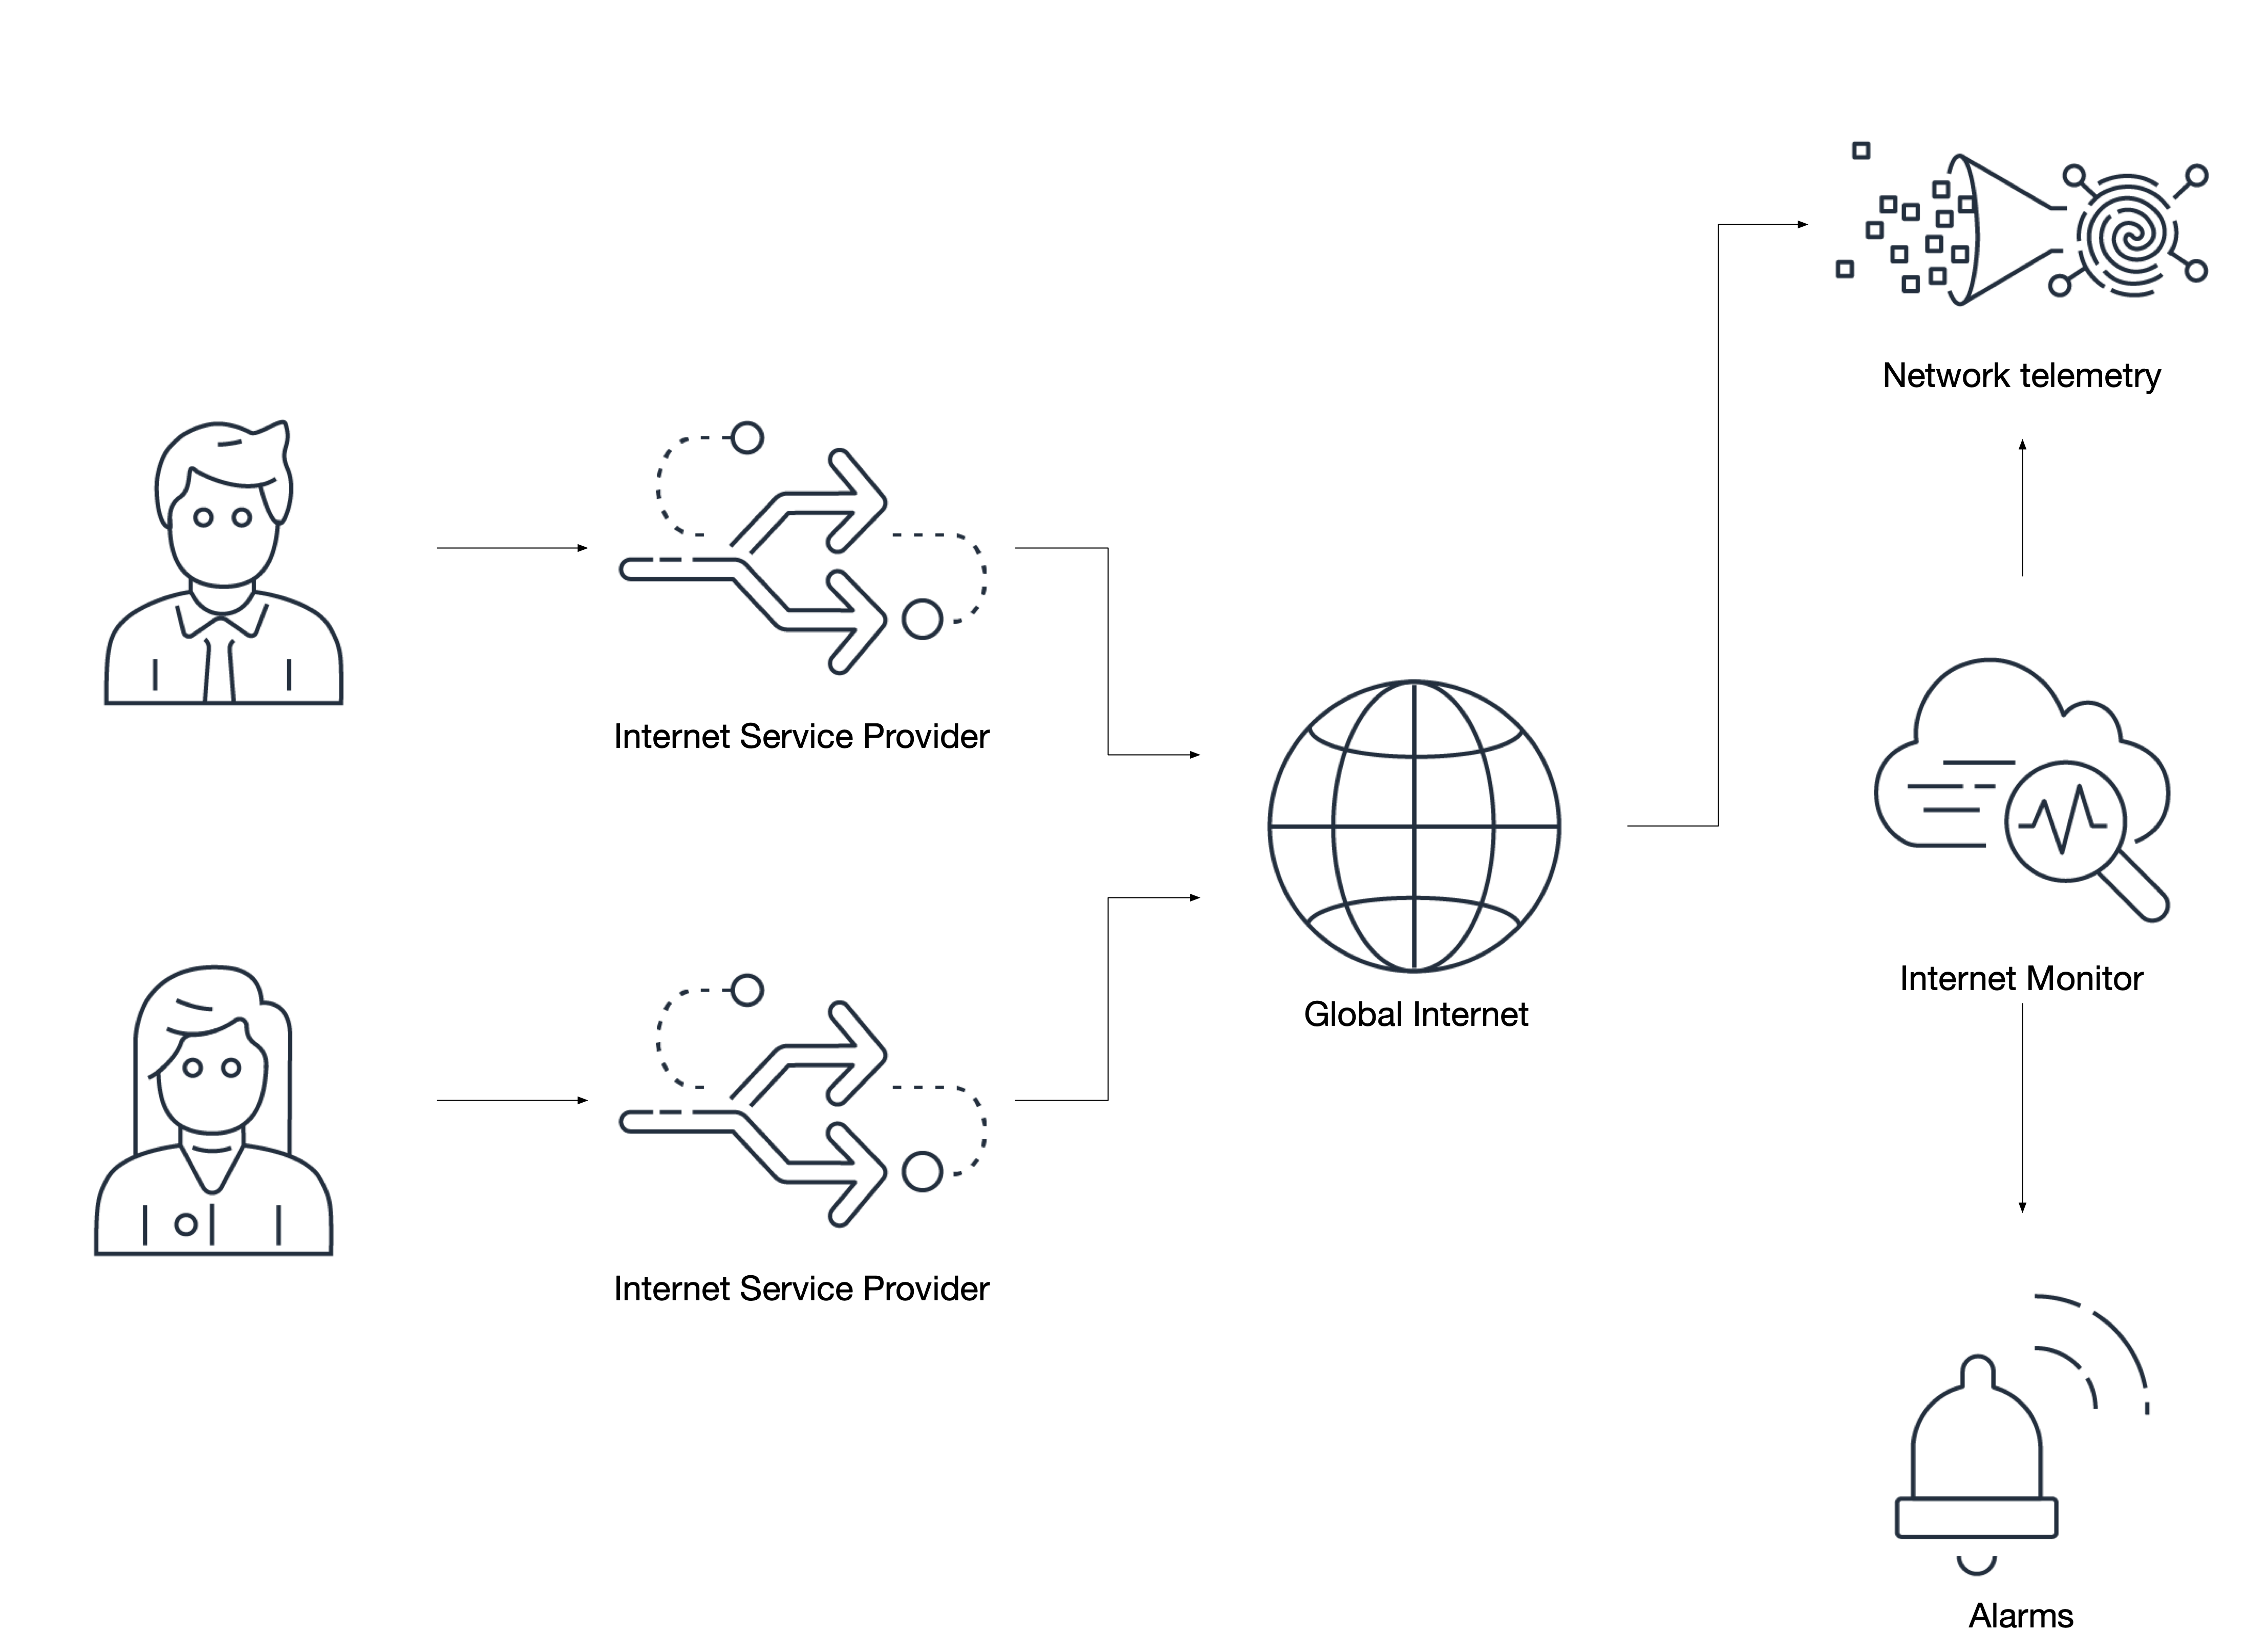
Internet Monitor works at the networking level and evaluates the health of observed traffic, correlated against AWS existing knowledge of known Internet issues. In short, if there is an Internet Service Provider (ISP) that has a performance or availability issue and if your application has traffic that uses this ISP for client/server communication, then Internet Monitor can proactively inform you about this impact to your workload. Additionally, it can make recommendations to you based on your selected hosting region and use of CloudFront as a Content Delivery Network1.
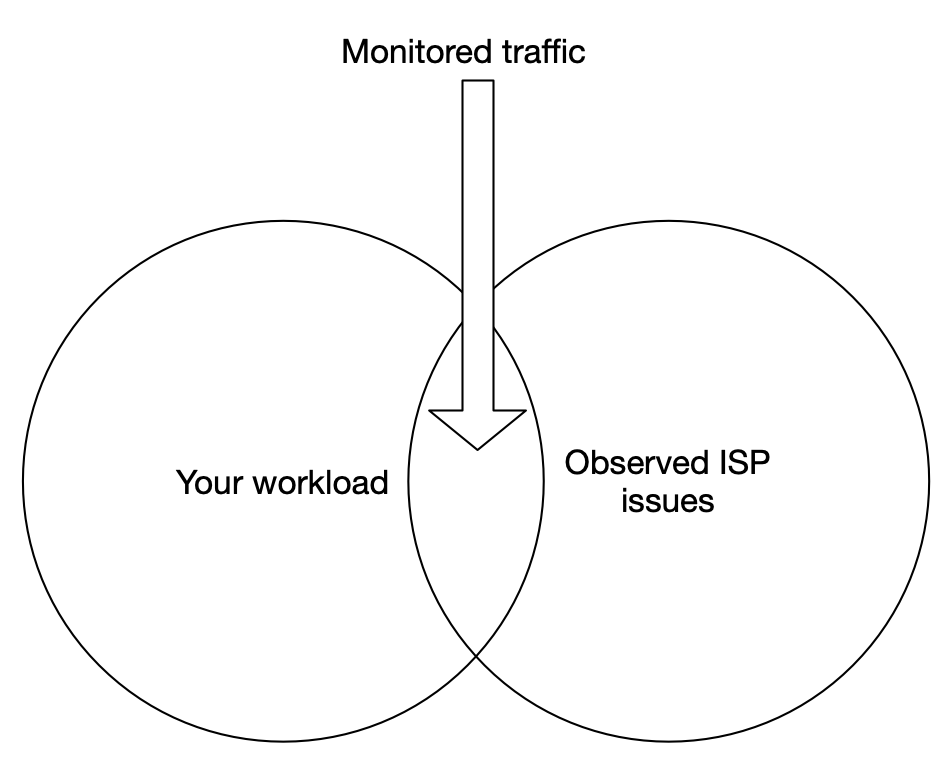
Internet Monitor only evaluates traffic from networks that your workloads traverse. For example, if an ISP in another country is impacted, but your users do not use that carrier, then you will not have visibility into that issue.
Create monitors for applications that traverse the Internet
The way that Internet Monitor operates is by watching for traffic that comes either into your CloudFront distributions or to your VPCs from impacted ISPs. This allows you to make decisions about application behaviour, routing, or user notification that helps offset business issues that arise as a result of network problems that are outside of your control.
Only create monitors that watch traffic which traverses the Internet. Private traffic, such as between two hosts in a private network (RFC1918) cannot be monitored using Internet Monitor.
Prioritize traffic from mobile applications where applicable. Customers roaming between providers, or in remote geographical locations, may have different or unexpected experiences that you should be aware of.
Enable actions through EventBridge and CloudWatch
Observed issues will be published through EventBridge using a schema that contains the souce identified as aws.internetmonitor. EventBridge can be used to automatically create issues in your ticket management system, page your support teams, or even trigger automation that can alter your workload to mitigate some scenarios.
{
  "source": ["aws.internetmonitor"]
}
Likewise, extensive details of traffic are available in CloudWatch Logs for observed cities, countries, metros, and subdivisions. This allows you to create highly-targeted actions which can notify impacted customers proactively about issues local to them. Here is an example of a country-level observation about a single provider:
{
    "version": 1,
    "timestamp": 1669659900,
    "clientLocation": {
        "latitude": 0,
        "longitude": 0,
        "country": "United States",
        "subdivision": "",
        "metro": "",
        "city": "",
        "countryCode": "US",
        "subdivisionCode": "",
        "asn": 00000,
        "networkName": "MY-AWESOME-ASN"
    },
    "serviceLocation": "us-east-1",
    "percentageOfTotalTraffic": 0.36,
    "bytesIn": 23,
    "bytesOut": 0,
    "clientConnectionCount": 0,
    "internetHealth": {
        "availability": {
            "experienceScore": 100,
            "percentageOfTotalTrafficImpacted": 0,
            "percentageOfClientLocationImpacted": 0
        },
        "performance": {
            "experienceScore": 100,
            "percentageOfTotalTrafficImpacted": 0,
            "percentageOfClientLocationImpacted": 0,
            "roundTripTime": {
                "p50": 71,
                "p90": 72,
                "p95": 73
            }
        }
    },
    "trafficInsights": {
        "timeToFirstByte": {
            "currentExperience": {
                "serviceName": "VPC",
                "serviceLocation": "us-east-1",
                "value": 48
            },
            "ec2": {
                "serviceName": "EC2",
                "serviceLocation": "us-east-1",
                "value": 48
            }
        }
    }
}
Values such as percentageOfTotalTraffic can reveal powerful insights about where your customers access your workloads from and can be used for advanced analytics.
Note that log groups created by Internet Monitor will have a default retention period set to never expire. AWS does not delete your data without your consent, so be sure to set a retention period that makes sense for your needs.
Each monitor will create at least 10 discrete CloudWatch metrics. These should be used for creating alarms just as you would with any other operational metric.
Utilize traffic optimization suggestions
Internet Monitor features traffic optimization recommendations that can advise you on where to best place your workloads so as to have the best customer experiences. For those workloads that are global, or have global customers, this feature is particularly valuable.
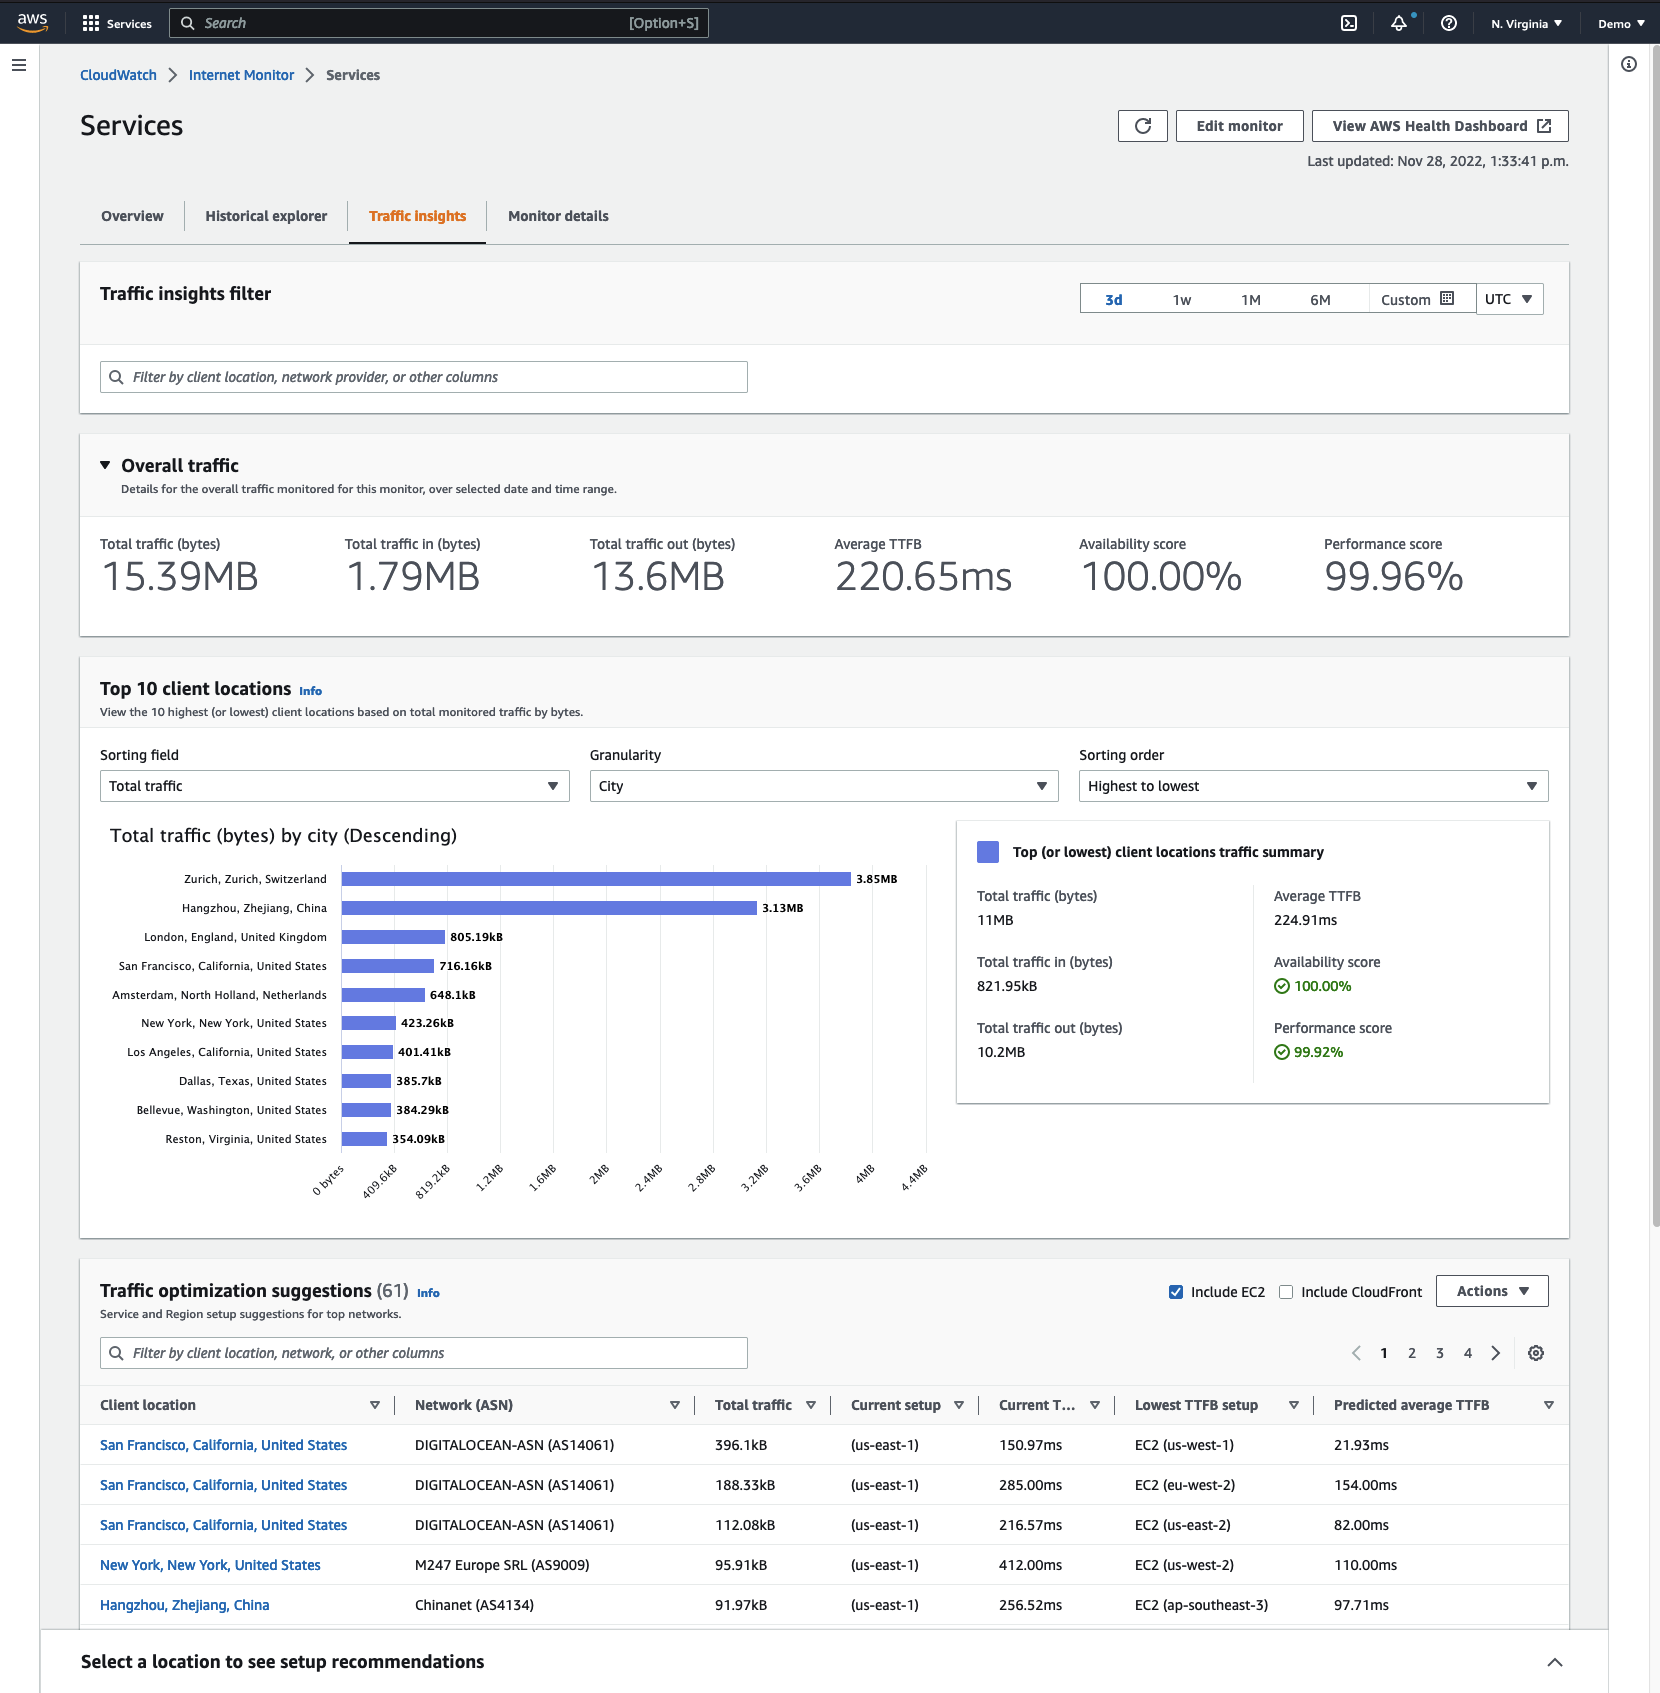
Pay close attention to the current, predicted, and lowest time-to-first-byte (TTFB) values in the traffic optimization suggestions view as these can indicate potentially poor end-user experiences that are otherwise difficult to observe.
Footnotes
-
See https://aws.amazon.com/blogs/aws/cloudwatch-internet-monitor-end-to-end-visibility-into-internet-performance-for-your-applications/ for our launch blog about this new feature. ↩