Different Instrumentation and Collector Setups
Quick navigation:
- Instrumentation Approaches
- ADOT SDK + CloudWatch Agent
- ADOT SDK + Custom OTEL Collector
- Upstream OpenTelemetry SDK + OTEL Collector
- Collector-less Tracing with OTLP Endpoints
- Existing X-Ray SDK + X-Ray Daemon (End of Support)
- RED Metrics Calculation Summary
Instrumentation Approaches
Auto-Instrumentation
When to use: Getting started quickly, minimal code changes, production rollouts
Who should use it: DevOps teams, platform engineers, organizations prioritizing speed
Benefits:
- Zero code changes required
- Fast time to value
- Covers common frameworks automatically
- Easy to roll back if needed
Limitations:
- Less control over what gets instrumented
- May capture more data than needed
- Custom business logic requires additional manual instrumentation
Manual OpenTelemetry Instrumentation
When to use: Custom business metrics, vendor portability, fine-grained control
Who should use it: Application developers, teams with observability expertise
Benefits:
- Complete control over telemetry data
- Custom spans and attributes for business logic
- Vendor-neutral (works with other APM tools)
- Precise control over performance impact
Trade-offs:
- Requires code changes
- More complex to implement
- Ongoing maintenance as code evolves
Instrumentation + Collector Setup Options
ADOT SDK + CloudWatch Agent
This approach provides the most integrated AWS experience with deep service integration and automatic correlation with AWS infrastructure metrics.
Key Benefits
- Metrics such as call volume, availability, latency, faults, and errors are calculated on 100% of requests at the client-side before sampling decision
- X-Ray Sampling Integration uses X-Ray sampling rules by default (configure for 100% if needed)
- Out-of-the-box CloudWatch Logs integration for seamless log correlation
- Full AWS Support for the entire observability stack
- Automatic service discovery and golden signals
Architecture
How ADOT SDK + CloudWatch Agent Works
Step 1: Application Instrumentation
When you deploy the ADOT SDK, it automatically instruments your application without requiring code changes. ADOT SDK dynamically injects code into an application at runtime, without requiring manual code changes. This injected code automatically detects calls to supported frameworks, creates spans for each operation, and propagates context across services to build a complete trace.
Step 2: Sampling Decision
For each request, the ADOT SDK checks your X-Ray sampling rules to decide whether to send the full trace data. You can configure this from 5% for cost savings up to 100% for complete visibility.
Step 3: Client-Side Metrics Calculation
Here's the key advantage: before sampling happens, the SDK calculates RED (Requests, Errors, Duration) metrics on 100% of requests when OTEL_AWS_APPLICATION_SIGNALS_ENABLED=true. This means you get complete golden signals even with low sampling rates:
- Rate: Count of requests per time window
- Errors: Count of requests with error status codes (4xx/5xx)
- Duration: Latency measurements from request start/end times
Step 4: CloudWatch Agent Processing
The ADOT SDK sends both sampled spans and pre-calculated metrics to the CloudWatch Agent, which processes them through a pipeline:
- OTLP Receiver: Accepts traces and metrics from your application
- Resource Detector: Adds AWS resource info (instance IDs, container details)
- APM Processor: Enriches spans with platform-specific metadata
- Exporters: Routes data to X-Ray (spans) and CloudWatch (metrics)
Step 5: Data Distribution
Your data splits into three paths:
- Metrics →
/aws/application-signals/datalog group for Application Maps - Spans →
aws/spanslog group for Transaction Search - Indexed spans → X-Ray backend for traditional trace analysis
Step 6: Analytics Options
This gives you three ways to analyze your data:
- Application Signals: Application Maps with dynamic grouping and golden signals from complete metrics
- Transaction Search: Query all span data with advanced filters
- X-Ray Analytics: Traditional trace analysis on indexed spans
Implementation Guides
Follow platform-specific setup guides:
- Enable Application Signals on Amazon EKS
- Enable Application Signals on Amazon ECS
- Enable Application Signals on Amazon EC2
- Enable Application Signals on Self hosted Kubernetes
- Application Signals Demo repository
Once done, verify service discovery and golden signals in the Application Signals console.
ADOT SDK + Custom OTEL Collector
This approach combines the ADOT SDK's client-side RED metrics calculation with the flexibility of a custom-built OpenTelemetry Collector that includes the AWS Application Signals Processor. You get the same accurate 100%-of-traffic metrics as the CloudWatch Agent approach, plus the ability to fan out telemetry to multiple destinations.
Key Benefits
- Client-side RED metrics on 100% of requests via ADOT SDK (same as CW Agent approach) — metrics are calculated before sampling
- Multi-destination telemetry — fan out to AWS, Datadog, Prometheus, etc. simultaneously
- App Signals Processor normalizes
aws.local.*/aws.remote.*attributes, resolves platform context, and controls cardinality - Full control over collector pipeline — add custom processors, filters, and exporters
Architecture
How ADOT SDK + Custom OTEL Collector Works
Step 1: Application Instrumentation
Your application gets instrumented with the ADOT SDK, which captures runtime metrics, logs, and traces in OpenTelemetry format. The ADOT SDK injects AWS-specific span attributes (aws.local.service, aws.local.operation, aws.remote.service, aws.remote.operation, etc.) that the App Signals Processor depends on.
Step 2: Client-Side RED Metrics Calculation
When OTEL_AWS_APPLICATION_SIGNALS_ENABLED=true, the ADOT SDK calculates RED metrics on 100% of requests before any sampling decision:
- Rate: Count of requests per time window
- Errors: Count of requests with error status codes (4xx/5xx)
- Duration: Latency measurements from request start/end times
Step 3: Sampling Decision
The ADOT SDK applies your configured sampling strategy (X-Ray sampling rules or local sampling). Only sampled traces get sent to the collector, but RED metrics are already calculated on 100% of traffic.
Step 4: Custom OpenTelemetry Collector Processing Pipeline
OTLP Receivers (Data Ingestion)
receivers:
  otlp:
    protocols:
      grpc:
        endpoint: 0.0.0.0:4317
      http:
        endpoint: 0.0.0.0:4318
Resource Detection Processor
processors:
  resourcedetection:
    detectors:
      - eks
      - env
      - ec2
Application Signals Processor
processors:
  awsapplicationsignals:
    resolvers:
      - platform: ecs
This processor works with the aws.local.* / aws.remote.* span attributes that the ADOT SDK injects. It performs:
- Attribute Resolution: Uses platform-specific resolvers to enrich telemetry with platform context
- Attribute Normalization: Renames ADOT SDK attributes to CloudWatch metric dimension names
- Cardinality Control: Applies user-configured
keep/drop/replacerules - Application Map Generation: Creates topology data with dynamic grouping
Step 5: Export Processing
Exporters route data to AWS EMF (metrics), OTLP HTTP (logs), and OTLP HTTP (traces) endpoints with SigV4 authentication.
Step 6: Backend Processing
- CloudWatch Logs: Extracts metrics from EMF logs, stores span data in
aws/spans - X-Ray Backend: Indexes configurable percentage of spans for trace analytics
Step 7: Analytics and Visualization
- Application Signals: Uses client-side calculated RED metrics — accurate on 100% of traffic regardless of sampling
- Transaction Search: Queries span data from CloudWatch Logs
- X-Ray Analytics: Traditional trace analysis on indexed spans
Building Custom OTEL Collector with awsapplicationsignalsprocessor
Prerequisites: Install Go (version 1.21 or later).
Step 1: Install the OpenTelemetry Collector Builder (ocb)
For latest binaries, see opentelemetry-collector-releases.
# macOS (ARM64)
curl --proto '=https' --tlsv1.2 -fL -o ocb \
https://github.com/open-telemetry/opentelemetry-collector-releases/releases/download/cmd%2Fbuilder%2Fv0.132.4/ocb_0.132.4_darwin_arm64
chmod +x ocb
Step 2: Create Builder Manifest File
Create builder-config.yaml:
dist:
  name: otelcol-appsignals
  description: OTel Collector for Application Signals
  output_path: ./otelcol-appsignals
exporters:
  - gomod: github.com/open-telemetry/opentelemetry-collector-contrib/exporter/awsemfexporter v0.113.0
  - gomod: go.opentelemetry.io/collector/exporter/otlphttpexporter v0.113.0
processors:
  - gomod: github.com/amazon-contributing/opentelemetry-collector-contrib/processor/awsapplicationsignalsprocessor v0.113.0
  - gomod: github.com/open-telemetry/opentelemetry-collector-contrib/processor/resourcedetectionprocessor v0.113.0
  - gomod: github.com/open-telemetry/opentelemetry-collector-contrib/processor/metricstransformprocessor v0.113.0
receivers:
  - gomod: go.opentelemetry.io/collector/receiver/otlpreceiver v0.113.0
extensions:
  - gomod: github.com/open-telemetry/opentelemetry-collector-contrib/extension/awsproxy v0.113.0
  - gomod: github.com/open-telemetry/opentelemetry-collector-contrib/extension/sigv4authextension v0.113.0
replaces:
  - github.com/open-telemetry/opentelemetry-collector-contrib/internal/aws/awsutil v0.113.0 => github.com/amazon-contributing/opentelemetry-collector-contrib/internal/aws/awsutil v0.113.0
  - github.com/open-telemetry/opentelemetry-collector-contrib/internal/aws/cwlogs v0.113.0 => github.com/amazon-contributing/opentelemetry-collector-contrib/internal/aws/cwlogs v0.113.0
  - github.com/open-telemetry/opentelemetry-collector-contrib/exporter/awsemfexporter v0.113.0 => github.com/amazon-contributing/opentelemetry-collector-contrib/exporter/awsemfexporter v0.113.0
  - github.com/openshift/api v3.9.0+incompatible => github.com/openshift/api v0.0.0-20180801171038-322a19404e37
Step 3: Sample Collector Configuration
receivers:
  otlp:
    protocols:
      grpc:
        endpoint: 0.0.0.0:4317
      http:
        endpoint: 0.0.0.0:4318
processors:
  awsapplicationsignals:
    resolvers:
      - platform: eks
  resourcedetection:
    detectors:
      - eks
      - env
      - ec2
exporters:
  otlphttp/logs:
    compression: gzip
    logs_endpoint: https://logs.us-east-1.amazonaws.com/v1/logs
    auth:
      authenticator: sigv4auth/logs
  otlphttp/traces:
    compression: gzip
    traces_endpoint: https://xray.us-east-1.amazonaws.com/v1/traces
    auth:
      authenticator: sigv4auth/traces
extensions:
  sigv4auth/logs:
    region: "us-east-1"
    service: "logs"
  sigv4auth/traces:
    region: "us-east-1"
    service: "xray"
service:
  extensions: [sigv4auth/logs, sigv4auth/traces]
  pipelines:
    logs:
      receivers: [otlp]
      exporters: [otlphttp/logs]
    traces:
      receivers: [otlp]
      processors: [resourcedetection, awsapplicationsignals]
      exporters: [otlphttp/traces]
Step 4: Build Docker Image
docker buildx build --load \
  -t otelcol-appsignals:latest \
  --platform=linux/amd64 .
Upstream OpenTelemetry SDK + OTEL Collector
This approach uses the standard upstream OpenTelemetry SDK (not ADOT) with an OpenTelemetry Collector. It provides maximum vendor neutrality and supports any language with an OpenTelemetry SDK, including those not supported by ADOT (Erlang, Rust, Ruby, etc.). RED metrics are calculated server-side by the X-Ray backend from sampled trace data.
Key Benefits
- Full vendor neutrality — no AWS-specific SDK dependency on the client side
- Any OTEL-supported language — works with Erlang, Rust, Ruby, PHP, and all other upstream OTEL SDKs
- Multi-cloud and hybrid environments — same SDK works across AWS, GCP, Azure, and on-premises
- Standard upstream OTEL Collector with standard processors and exporters
- Existing OpenTelemetry investments preserved — no migration to ADOT needed
- Multi-destination telemetry — fan out to any backend simultaneously
Architecture
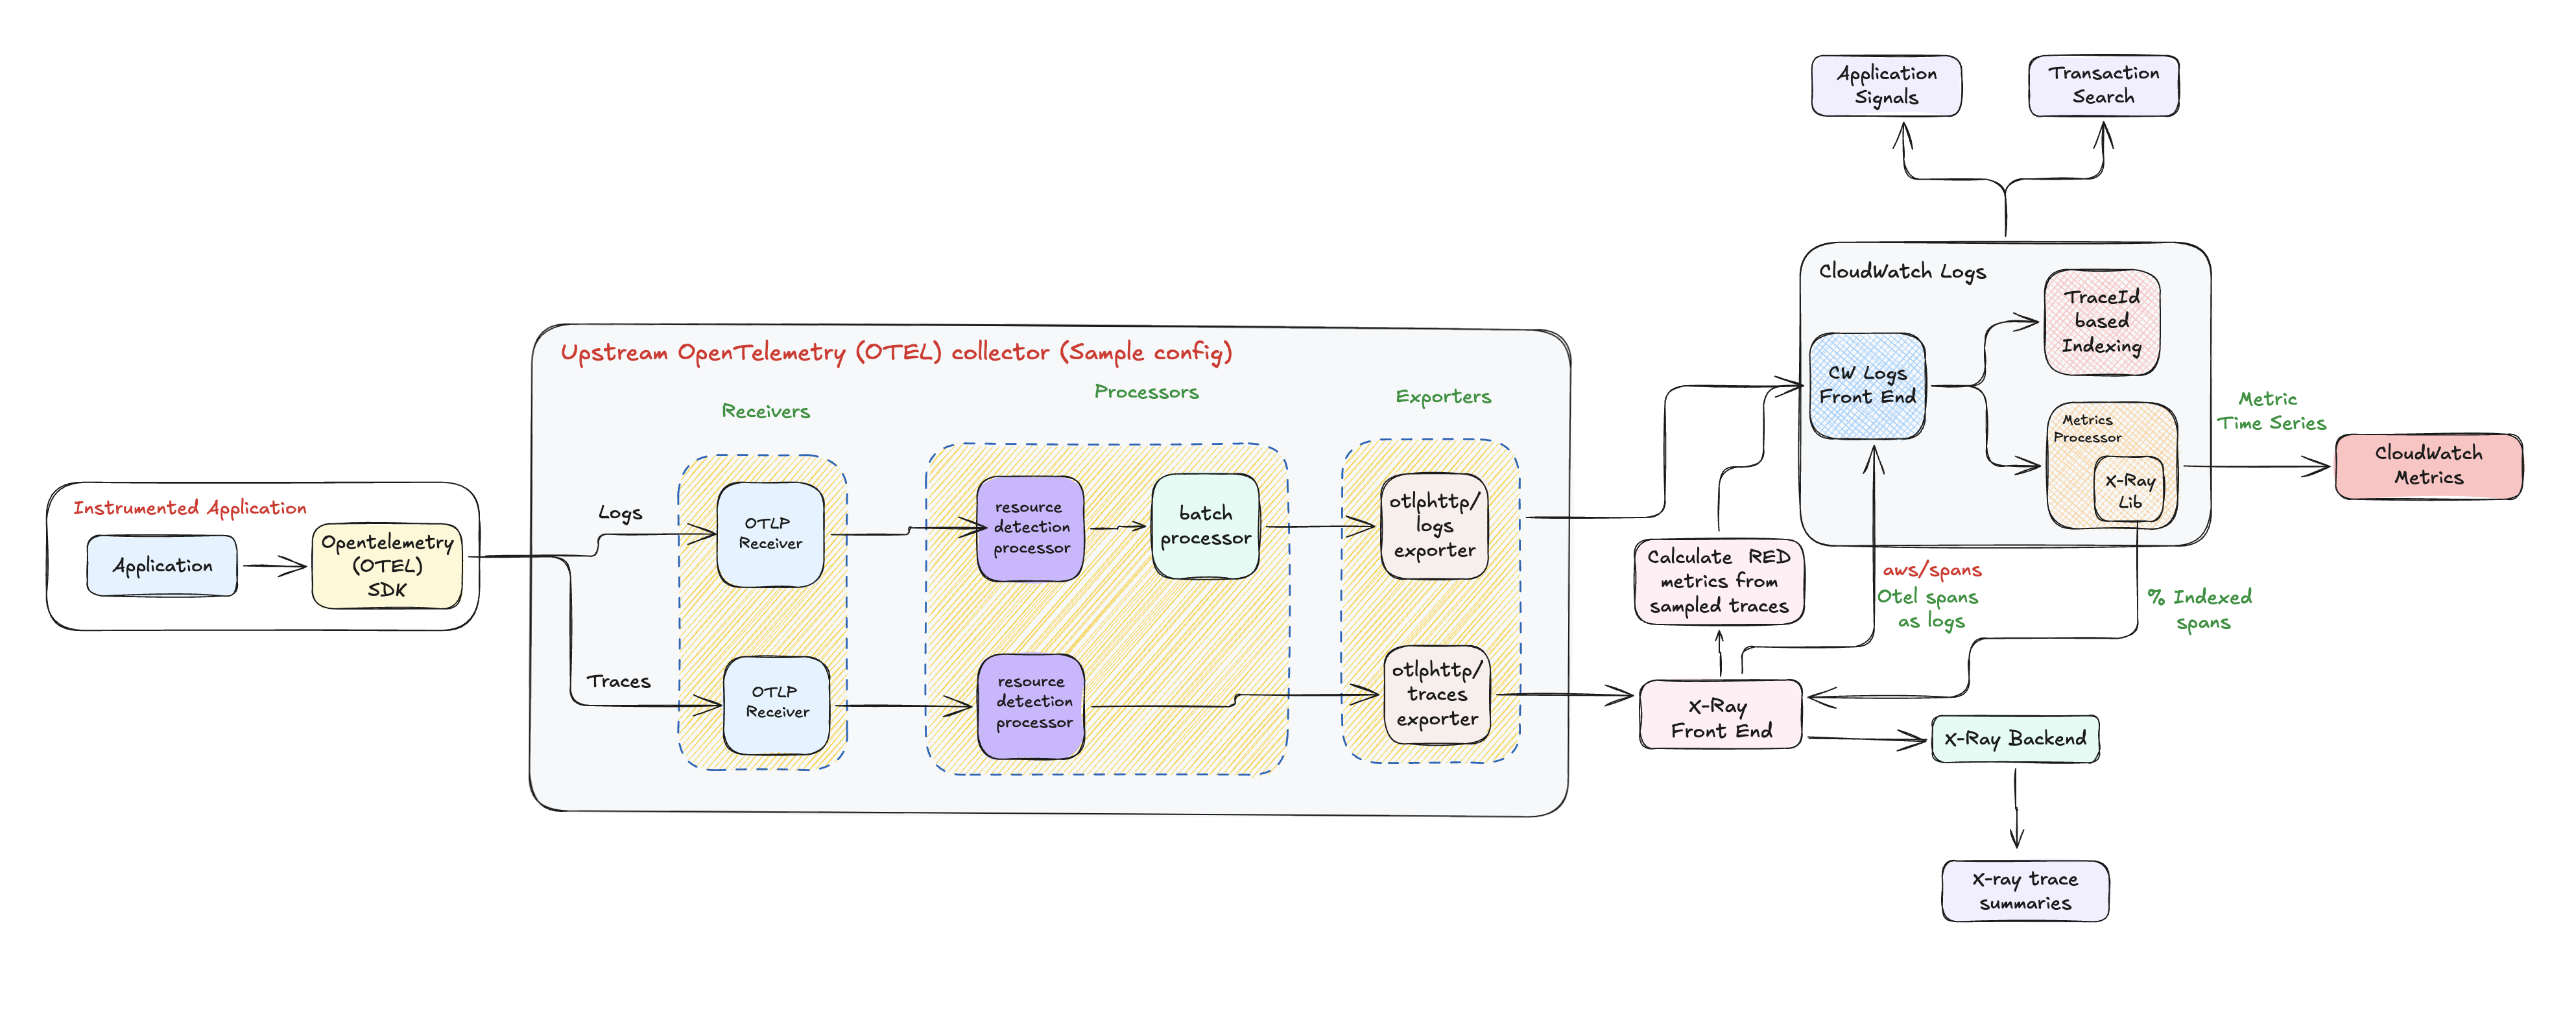
How Upstream OTEL SDK + Collector Works
Step 1: Application Instrumentation
Your application gets instrumented with the standard upstream OpenTelemetry SDK. This produces standard OTEL spans with semantic conventions (http.method, http.route, http.status_code, etc.).
Step 2: Client-Side Sampling
The OTEL SDK applies your configured sampling strategy. For accurate RED metrics, you need always_on sampling (100%) since metrics are calculated server-side from sampled traces only. With partial sampling, your RED metrics will only reflect the sampled subset.
Step 3: Standard OTEL Collector Processing Pipeline
The collector uses standard upstream processors:
receivers:
  otlp:
    protocols:
      grpc:
        endpoint: 0.0.0.0:4317
      http:
        endpoint: 0.0.0.0:4318
processors:
  resourcedetection:
    detectors:
      - eks
      - env
      - ec2
  batch:
    send_batch_size: 8192
    timeout: 200ms
Step 4: Server-Side RED Metrics Calculation
Since the upstream OTEL SDK does not calculate RED metrics client-side, the X-Ray frontend calculates them server-side from the sampled traces it receives:
- Rate: Request counts extracted from sampled span data
- Errors: Error counts identified from sampled span status codes
- Duration: Latency calculated from sampled span start/end times
RED metrics accuracy depends entirely on your sampling rate. With 5% sampling, you only get metrics on 5% of traffic. For accurate RED metrics with this approach, configure 100% sampling.
Step 5: Analytics and Visualization
- Application Signals: Application Maps with golden signals from server-calculated RED metrics (accuracy depends on sampling rate)
- Transaction Search: Query span data from CloudWatch Logs (
aws/spans) - X-Ray Analytics: Traditional trace analysis on indexed spans
Key Differences from ADOT SDK Approach
| Aspect | ADOT SDK + Custom Collector | Upstream OTEL SDK + Collector |
|---|---|---|
| RED Metrics | Client-side, 100% of traffic | Server-side, only sampled traffic |
aws.* span attributes | Injected by ADOT SDK | Not present |
| Language support | Java, Python, .NET, Node.js | Any OTEL-supported language |
| Collector build | Custom build with App Signals Processor | Standard upstream collector build |
| 100% sampling needed for accurate metrics | No | Yes |
Sample Collector Configuration
receivers:
  otlp:
    protocols:
      grpc:
        endpoint: 0.0.0.0:4317
      http:
        endpoint: 0.0.0.0:4318
processors:
  resourcedetection:
    detectors:
      - eks
      - env
      - ec2
  batch:
    send_batch_size: 8192
    timeout: 200ms
exporters:
  otlphttp/logs:
    compression: gzip
    logs_endpoint: https://logs.us-east-1.amazonaws.com/v1/logs
    auth:
      authenticator: sigv4auth/logs
  otlphttp/traces:
    compression: gzip
    traces_endpoint: https://xray.us-east-1.amazonaws.com/v1/traces
    auth:
      authenticator: sigv4auth/traces
extensions:
  sigv4auth/logs:
    region: "us-east-1"
    service: "logs"
  sigv4auth/traces:
    region: "us-east-1"
    service: "xray"
service:
  extensions: [sigv4auth/logs, sigv4auth/traces]
  pipelines:
    logs:
      receivers: [otlp]
      processors: [resourcedetection, batch]
      exporters: [otlphttp/logs]
    traces:
      receivers: [otlp]
      processors: [resourcedetection, batch]
      exporters: [otlphttp/traces]
Collector-less Tracing with OTLP Endpoints
This approach provides minimal infrastructure complexity and reduced resource overhead by sending logs and traces directly to CloudWatch OTLP endpoints.
Why Choose Collector-less Tracing
Collector-less tracing is perfect when you want the simplest possible architecture with maximum resource utilization. By sending data directly to AWS endpoints, you eliminate the need for additional infrastructure components and their associated management overhead.
Architecture
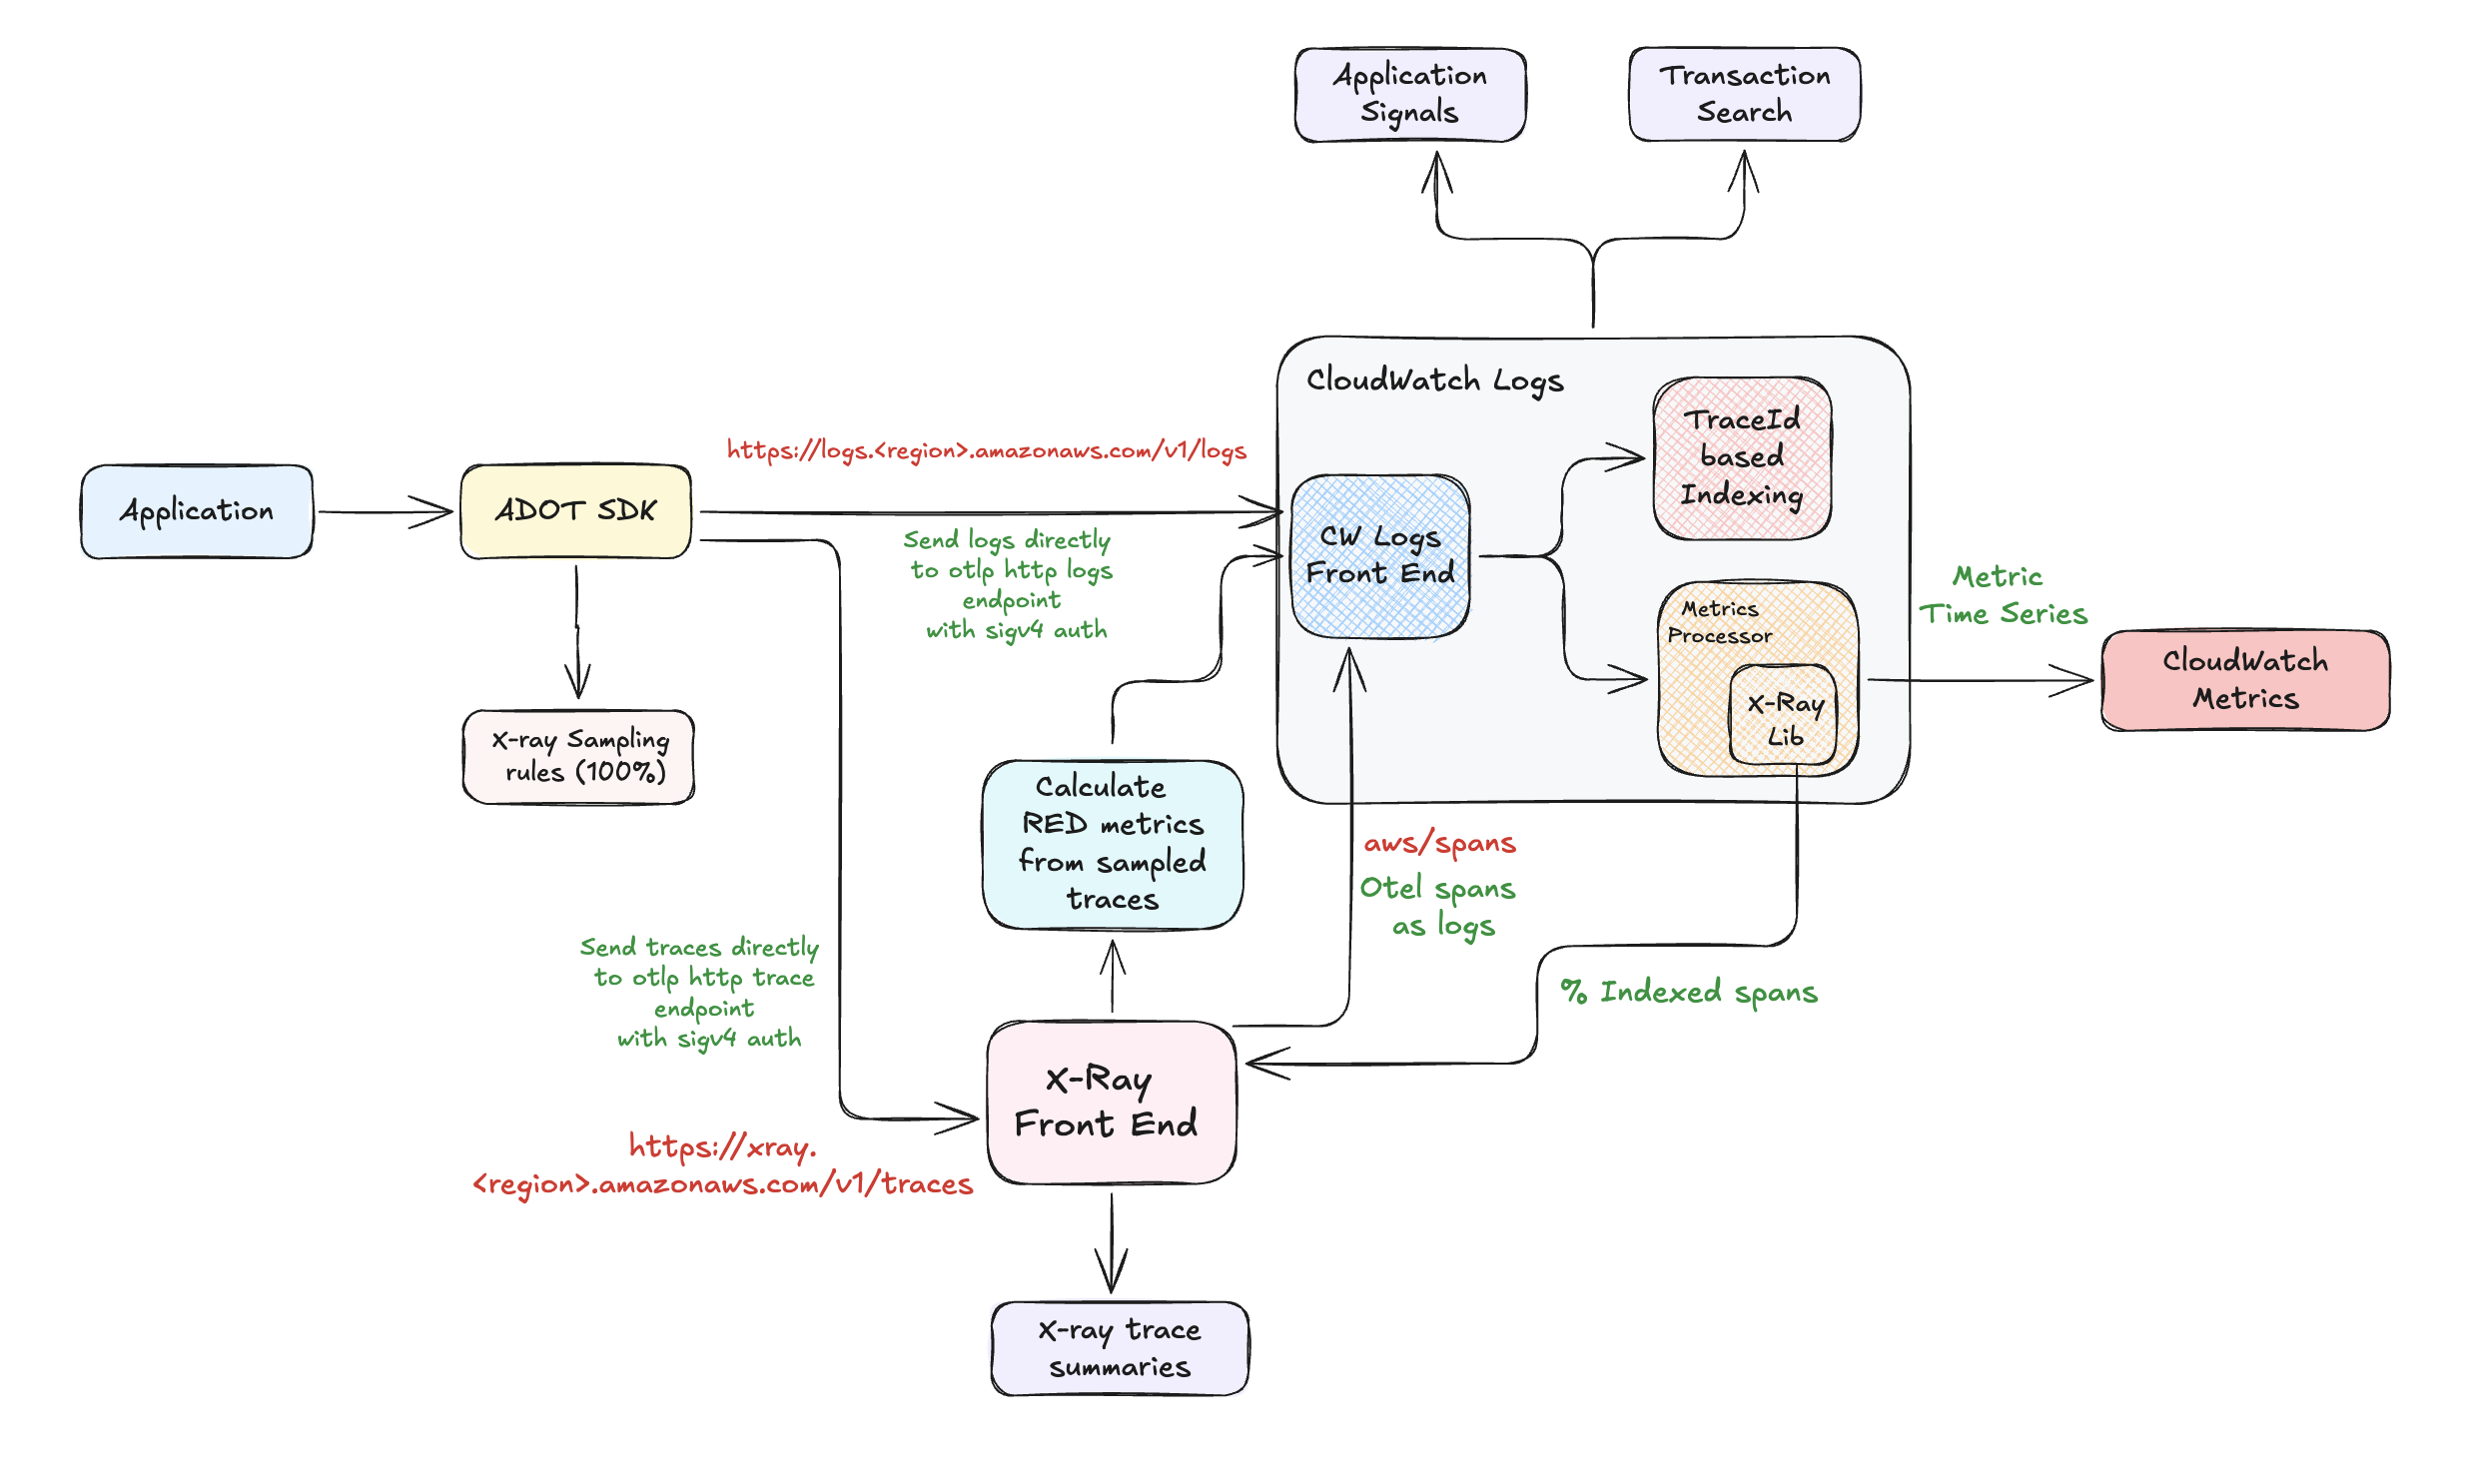
How Collector-less Tracing Works
Step 1: Application Instrumentation
Your application gets automatically instrumented with the ADOT SDK. It captures logs and traces in OpenTelemetry format without requiring any code changes.
Step 2: Client-Side Sampling
The ADOT SDK applies your X-Ray sampling rules to decide which traces to send. All logs get processed regardless of sampling decisions.
Step 3: Direct AWS Communication
Instead of going through a collector, your data goes directly to AWS services:
- Logs →
https://logs.<region>.amazonaws.com/v1/logsvia OTLP HTTP - Traces →
https://xray.<region>.amazonaws.com/v1/tracesvia OTLP HTTP - Authentication: Uses SigV4 with your AWS credentials
Step 4: Server-Side Metrics Calculation
The X-Ray frontend analyzes your received traces to calculate RED metrics on the AWS backend. This means your metrics are only as complete as your sampling rate.
Step 5: Analytics Options
- Application Signals: Application Maps with dynamic grouping and golden signals from server-calculated metrics
- Transaction Search: Query complete span data from CloudWatch Logs
- X-Ray Analytics: Traditional trace analysis on indexed spans
Important Considerations
- Transaction Search is required — you must enable it when using OTLP endpoints
- ADOT SDK is required — regular OpenTelemetry SDK won't work for this approach
- Authentication is automatic — ADOT SDK handles AWS SigV4 authentication
- Sampling affects metrics — your Application Signals metrics are only as complete as your sampling rate
Existing X-Ray SDK + X-Ray Daemon (End of Support Timeline)
AWS X-Ray SDKs and Daemon GA ended on February 25, 2026 and are now in maintenance mode.
| SDK and Daemon Phase | Start Date | End Date | Support Provided |
|---|---|---|---|
| General Availability | N/A | February 25, 2026 | X-Ray SDKs and Daemon are fully supported. AWS provides regular SDK and daemon releases that include bug and security fixes. |
| Maintenance Mode | February 25, 2026 | N/A | AWS will limit X-Ray SDK and Daemon releases to address security issues only. The SDKs/Daemon will not receive new feature enhancements. |
See X-Ray End of Support Timeline and X-Ray to OpenTelemetry Migration Guide for details.
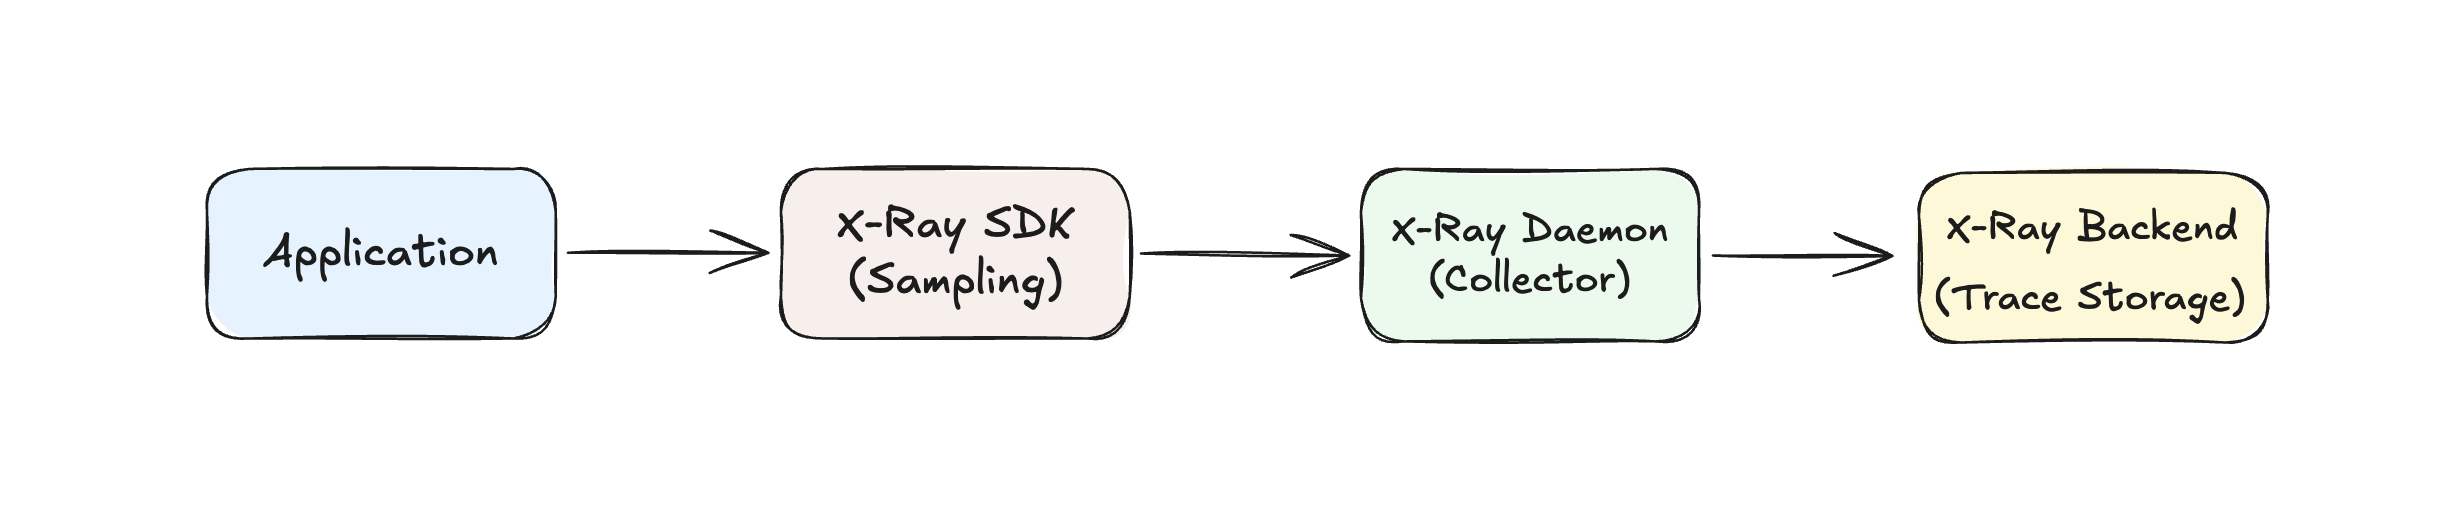
This approach is suitable for organizations with existing X-Ray investments who want to gradually adopt Application Signals capabilities while planning their migration to OpenTelemetry.
How to Get Started
- Enable Transaction Search for your existing X-Ray data
- Configure 100% Sampling or use adaptive sampling for cost-effective anomaly detection
- Plan Your Migration — start gradually migrating services to ADOT instrumentation
RED Metrics Calculation Summary
Understanding how RED (Rate, Errors, Duration) metrics are calculated across different instrumentation setups is crucial for choosing the right approach:
| Instrumentation Setup | Calculation Method | Environment Variable | Requirements |
|---|---|---|---|
| ADOT SDK + CloudWatch Agent | Client-side | OTEL_AWS_APPLICATION_SIGNALS_ENABLED=true | None - works with any sampling |
| ADOT SDK + Custom OTEL Collector | Client-side | OTEL_AWS_APPLICATION_SIGNALS_ENABLED=true | Custom collector with App Signals Processor |
| Upstream OTEL SDK + OTEL Collector | Server-side | N/A (no ADOT SDK) | Transaction Search + 100% sampling for accuracy |
| Collector-less (ADOT SDK) | Server-side | OTEL_AWS_APPLICATION_SIGNALS_ENABLED=false (default) | Transaction Search + 100% sampling for accuracy |
| X-Ray SDK + X-Ray Daemon | Server-side (extrapolated) | N/A | Based on sampled data |
Client-side RED Metrics (ADOT SDK — both CW Agent and Custom Collector)
Application → ADOT SDK → Calculate Metrics → CW Agent or Custom Collector → AWS
                ↓
            (100% of requests)
- Calculation happens in the application before any sampling decisions
- Always accurate regardless of trace sampling configuration
- Default behavior when
OTEL_AWS_APPLICATION_SIGNALS_ENABLED=true - No Transaction Search dependency for metrics calculation
Server-side RED Metrics (Upstream OTEL SDK, Collector-less, X-Ray)
Application → Upstream OTEL SDK/Collector → AWS Backend → Calculate Metrics
                ↓
        (Requires 100% sampling for accuracy)
- Calculation happens at AWS backend (X-Ray frontend) from received span data
- OTLP-based setups require Transaction Search to be enabled
- Needs 100% sampling for accurate metrics (except X-Ray which extrapolates)