さまざまなインストルメンテーションと Collector のセットアップ
クイックナビゲーション:
- インストルメンテーションアプローチ
- ADOT SDK + CloudWatch Agent
- ADOT SDK + カスタム OTEL Collector
- アップストリーム OpenTelemetry SDK + OTEL Collector
- OTLP エンドポイントを使用した Collector レスのトレーシング
- 既存の X-Ray SDK + X-Ray Daemon(サポート終了)
- RED メトリクス計算サマリー
インストルメンテーションのアプローチ
自動インストルメンテーション
使用するタイミング: すぐに始めたい場合、コードの変更を最小限に抑えたい場合、本番環境へのロールアウト
使用対象者: DevOps チーム、プラットフォームエンジニア、スピードを優先する組織
メリット:
- コードの変更が不要
- 短時間で価値を実現
- 一般的なフレームワークを自動的にカバー
- 必要に応じて簡��単にロールバック可能
制限事項:
- インストルメント化される内容に対する制御が少ない
- 必要以上のデータをキャプチャする可能性がある
- カスタムビジネスロジックには追加の手動インストルメンテーションが必要
手動 OpenTelemetry インストルメンテーション
使用するタイミング: カスタムビジネスメトリクス、ベンダーの移植性、きめ細かい制御
使用対象者: アプリケーション開発者、オブザーバビリティの専門知識を持つチーム
メリット:
- テレメトリデータの完全な制御
- ビジネスロジック向けのカスタムスパンと属性
- ベンダー中立(他の APM ツールとも連携可能)
- パフォーマンスへの影響を精密に制御
トレードオフ:
- コードの変更が必要
- 実装がより複雑
- コードの進化に伴う継続的なメンテナンスが必要
インストルメンテーション + Collector セットアップオプション
ADOT SDK + CloudWatch Agent
このアプローチは、深いサービス統合と AWS インフラストラクチャメトリクスとの自動相関を備えた、最も統合された AWS エクスペリエンスを提供します。
主なメリット
- コール量、可用性、レイテンシー、障害、エラーなどのメトリクスは、サンプリング決定前にクライアント側で 100% のリクエストに対して計算されます
- X-Ray サンプリング統合はデフォルトで X-Ray サンプリングルールを使用します(必要に応じて 100% に設定可能)
- すぐに使える CloudWatch Logs 統合によりシームレスなログ相関を実現
- 完全な AWS サポートによりオブザーバビリティスタック全体をカバー
- 自動サービス検出とゴールデンシグナル
アーキテクチャ
ADOT SDK + CloudWatch Agent の仕組み
ステップ 1: アプリケーションのインストルメンテーション
ADOT SDK をデプロイすると、コードを変更することなく、アプリケーションが自動的にインストルメント化されます。ADOT SDK は、手動でのコード変更を必要とせず、実行時にアプリケーションにコードを動的に注入します。この注入されたコードは、サポートされているフレームワークへの呼び出しを自動的に検出し、各操作のスパンを作成し、サービス間でコンテキストを伝播して完全なトレースを構築します。
ステップ 2: サンプリングの決定
各リクエストに対して、ADOT SDK は X-Ray サンプリングルールを確認し、完全なトレースデータを送信するかどうかを決定します。コスト削減のために 5% から、完全な可視性のために 100% まで設定できます。
ステップ 3: クライアントサイドのメトリクス計算
サンプリングが行われる前に、SDK が 100% のリクエストに対して RED (Requests、Errors、Duration) メトリクスを計算するという重要な利点があります。 OTEL_AWS_APPLICATION_SIGNALS_ENABLED=trueこれは、サンプリングレートが低い場合でも完全なゴールデンシグナルが得られることを意味します。
- Rate: 時間ウィンドウあたりのリクエスト数
- Errors: エラーステータスコード (4xx/5xx) を持つリクエスト数
- Duration: リクエストの開始/終了時刻からのレイテンシ測定値
ステップ 4: CloudWatch Agent の処理
ADOT SDK は、サンプリングされたスパンと事前計算されたメトリクスの両方を CloudWatch Agent に送信し、CloudWatch Agent はパイプラインを通じてそれらを処理します。
- OTLP Receiver: アプリケーションからトレースとメトリクスを受信します
- Resource Detector: AWS リソース情報(インスタンス ID、コンテナの詳細)を追加します
- APM Processor: プラットフォーム固有のメタデータでスパンを強化します
- Exporters: データを X-Ray(スパン)と CloudWatch(メトリクス)にルーティングします
ステップ 5: データ配布
データは 3 つのパスに分割されます。
- メトリクス →
/aws/application-signals/dataApplication Maps のロググループ - スパン →
aws/spansTransaction Search のロググループ - インデックス付きスパン → 従来のトレース分析のための X-Ray バックエンド
ステップ 6: 分析オプション
これ��により、データを分析する 3 つの方法が提供されます。
- Application Signals: 完全なメトリクスからの動的グループ化とゴールデンシグナルを備えたアプリケーションマップ
- Transaction Search: 高度なフィルターを使用してすべてのスパンデータをクエリ
- X-Ray Analytics: インデックス付きスパンに対する従来のトレース分析
実装ガイド
プラットフォーム固有のセットアップガイドに従ってください。
- Amazon EKS で Application Signals を有効にする
- Amazon ECS で Application Signals を有効にする
- Amazon EC2 で Application Signals を有効にする
- セルフホスト型 Kubernetes で Application Signals を有効にする
- Application Signals デモリポジトリ
完了したら、Application Signals コンソールでサービスディスカバリーとゴールデンシグナルを確認してください。
ADOT SDK + カスタム OTEL Collector
このアプローチは、ADOT SDK のクライアントサイド RED メトリクス計算と、AWS Application Signals Processor を含むカスタムビルドの OpenTelemetry Collector の柔軟性を組み合わせています。CloudWatch Agent アプローチと同様の正確な 100% トラフィックメトリクスに加え、テレメトリを複数の宛先にファンアウトする機能も利用できます。
主なメリット
- 100% のリクエストに対するクライアントサイド RED メトリクス (ADOT SDK 経由、CW Agent アプローチと同様) — メトリクスはサンプリング前に計算されます
- マルチデスティネーションテレメトリ — AWS、Datadog、Prometheus などへ同時にファンアウト
- App Signals Processor による正規化
aws.local.*/aws.remote.*属性を解決し、プラットフォームコンテキストを解決し、カーディナリティを制御します - コレクターパイプラインの完全な制御 — カスタムプロセッサー、フィルター、エクスポーターを追加できます
アーキテクチャ
ADOT SDK + カスタム OTEL Collector の仕組み
ステップ 1: アプリケーションのインストルメンテーション
アプリケーションは ADOT SDK でインストルメント化され、OpenTelemetry 形式でランタイムメトリクス、ログ、トレースをキャプチャします。ADOT SDK は AWS 固有のスパン属性を注入します (aws.local.service, aws.local.operation, aws.remote.service, aws.remote.operation、など) App Signals Processor が依存するもの。
ステップ 2: クライアントサイドの RED メトリクス計算
次の場合 OTEL_AWS_APPLICATION_SIGNALS_ENABLED=true、ADOT SDK はサンプリング決定の前に 100% のリクエストに対して RED メトリクスを計算します。
- Rate: 時間ウィンドウあたりのリクエスト数
- Errors: エラーステータスコード (4xx/5xx) を持つリクエスト数
- Duration: リクエストの開始/終了時刻からのレイテンシ測定値
ステップ 3: サンプリングの決定
ADOT SDK は、設定されたサンプリング戦略(X-Ray サンプリングルールまたはローカルサンプリング)を適用します。サンプリングされたトレースのみがコレクターに送信されますが、RED メトリクスはトラフィックの 100% に対してすでに計算されています。
ステップ 4: カスタム OpenTelemetry Collector 処理パイプライン
OTLP レシーバー (データ取り込み)
receivers:
  otlp:
    protocols:
      grpc:
        endpoint: 0.0.0.0:4317
      http:
        endpoint: 0.0.0.0:4318
リソース検出プロセッサ
processors:
  resourcedetection:
    detectors:
      - eks
      - env
      - ec2
Application Signals Processor
processors:
  awsapplicationsignals:
    resolvers:
      - platform: ecs
このプロセッサーは以下と連携します。 aws.local.* / aws.remote.* ADOT SDK が挿入する span 属性に対して、以下の処理を実行します。
- 属性の解決: プラットフォーム固有のリゾルバーを使用して、プラットフォームコンテキストでテレメトリを強化します
- 属性の正規化: ADOT SDK 属性を CloudWatch メトリクスディメンション名に変換します
- カーディナリティの制御: ユーザーが設定した
keep/drop/replaceルール - アプリケーションマップの生成: 動的グループ化によるトポロジデータの作成
ステップ 5: エクスポート処理
Exporter は、SigV4 認証を使用して AWS EMF (メトリクス)、OTLP HTTP (ログ)、および OTLP HTTP (トレース) エンドポイントにデータをルーティングします。
ステップ 6: バックエンド処理
- CloudWatch Logs: EMF ログからメトリクスを抽出し、スパンデータを保存します。
aws/spans - X-Ray バックエンド: トレース分析のためにスパンの設定可能な割合をインデックス化します
ステップ 7: 分析と可視化
- Application Signals: クライアント側で計算された RED メトリクスを使用 — サンプリングに関係なく 100% のトラフィックに対して正確
- Transaction Search: CloudWatch Logs のスパンデータをクエリ
- X-Ray Analytics: インデックス化されたスパンに対する従来のトレース分析
awsapplicationsignalsprocessor を使用したカスタム OTEL Collector の構築
前提条件: Go(バージョン 1.21 以降)をインストールしてください。
ステップ 1: OpenTelemetry Collector Builder (ocb) をインストールする
最新のバイナリについては、opentelemetry-collector-releases を参照してください。
# macOS (ARM64)
curl --proto '=https' --tlsv1.2 -fL -o ocb \
https://github.com/open-telemetry/opentelemetry-collector-releases/releases/download/cmd%2Fbuilder%2Fv0.132.4/ocb_0.132.4_darwin_arm64
chmod +x ocb
ステップ 2: ビルダーマニフェストファイルを作成する
作成 builder-config.yaml:
dist:
  name: otelcol-appsignals
  description: OTel Collector for Application Signals
  output_path: ./otelcol-appsignals
exporters:
  - gomod: github.com/open-telemetry/opentelemetry-collector-contrib/exporter/awsemfexporter v0.113.0
  - gomod: go.opentelemetry.io/collector/exporter/otlphttpexporter v0.113.0
processors:
  - gomod: github.com/amazon-contributing/opentelemetry-collector-contrib/processor/awsapplicationsignalsprocessor v0.113.0
  - gomod: github.com/open-telemetry/opentelemetry-collector-contrib/processor/resourcedetectionprocessor v0.113.0
  - gomod: github.com/open-telemetry/opentelemetry-collector-contrib/processor/metricstransformprocessor v0.113.0
receivers:
  - gomod: go.opentelemetry.io/collector/receiver/otlpreceiver v0.113.0
extensions:
  - gomod: github.com/open-telemetry/opentelemetry-collector-contrib/extension/awsproxy v0.113.0
  - gomod: github.com/open-telemetry/opentelemetry-collector-contrib/extension/sigv4authextension v0.113.0
replaces:
  - github.com/open-telemetry/opentelemetry-collector-contrib/internal/aws/awsutil v0.113.0 => github.com/amazon-contributing/opentelemetry-collector-contrib/internal/aws/awsutil v0.113.0
  - github.com/open-telemetry/opentelemetry-collector-contrib/internal/aws/cwlogs v0.113.0 => github.com/amazon-contributing/opentelemetry-collector-contrib/internal/aws/cwlogs v0.113.0
  - github.com/open-telemetry/opentelemetry-collector-contrib/exporter/awsemfexporter v0.113.0 => github.com/amazon-contributing/opentelemetry-collector-contrib/exporter/awsemfexporter v0.113.0
  - github.com/openshift/api v3.9.0+incompatible => github.com/openshift/api v0.0.0-20180801171038-322a19404e37
ステップ 3: サンプルコレクター設定
receivers:
  otlp:
    protocols:
      grpc:
        endpoint: 0.0.0.0:4317
      http:
        endpoint: 0.0.0.0:4318
processors:
  awsapplicationsignals:
    resolvers:
      - platform: eks
  resourcedetection:
    detectors:
      - eks
      - env
      - ec2
exporters:
  otlphttp/logs:
    compression: gzip
    logs_endpoint: https://logs.us-east-1.amazonaws.com/v1/logs
    auth:
      authenticator: sigv4auth/logs
  otlphttp/traces:
    compression: gzip
    traces_endpoint: https://xray.us-east-1.amazonaws.com/v1/traces
    auth:
      authenticator: sigv4auth/traces
extensions:
  sigv4auth/logs:
    region: "us-east-1"
    service: "logs"
  sigv4auth/traces:
    region: "us-east-1"
    service: "xray"
service:
  extensions: [sigv4auth/logs, sigv4auth/traces]
  pipelines:
    logs:
      receivers: [otlp]
      exporters: [otlphttp/logs]
    traces:
      receivers: [otlp]
      processors: [resourcedetection, awsapplicationsignals]
      exporters: [otlphttp/traces]
ステップ 4: Docker イメージのビルド
docker buildx build --load \
  -t otelcol-appsignals:latest \
  --platform=linux/amd64 .
アップストリーム OpenTelemetry SDK + OTEL Collector
このアプローチは、OpenTelemetry Collector と共に標準のアップストリーム OpenTelemetry SDK(ADOT ではない)を使用します。最大限のベンダー中立性を提供し、ADOT でサポートされていない言語(Erlang、Rust、Ruby など)を含む、OpenTelemetry SDK を持つあらゆる言語をサポートします。RED メトリクスは、サンプリングされたトレースデータから X-Ray バックエンドによってサーバーサイドで計算されます。
主なメリット
- 完全なベンダー中立性 — クライアント側に AWS 固有の SDK 依存関係なし
- OTEL がサポートするあらゆる言語 — Erlang、Rust、Ruby、PHP、およびその他すべてのアップストリーム OTEL SDK で動作
- マルチクラウドおよびハイブリッド環境 — 同じ SDK が AWS、GCP、Azure、およびオンプレミスで動作
- 標準のアップストリーム OTEL Collector と標準のプロセッサおよびエクスポーター
- 既存の OpenTelemetry への投資 を保持 — ADOT への移行不要
- マルチデスティネーションテレメトリ — 任意のバックエンドに同時にファンアウト
アーキテクチャ
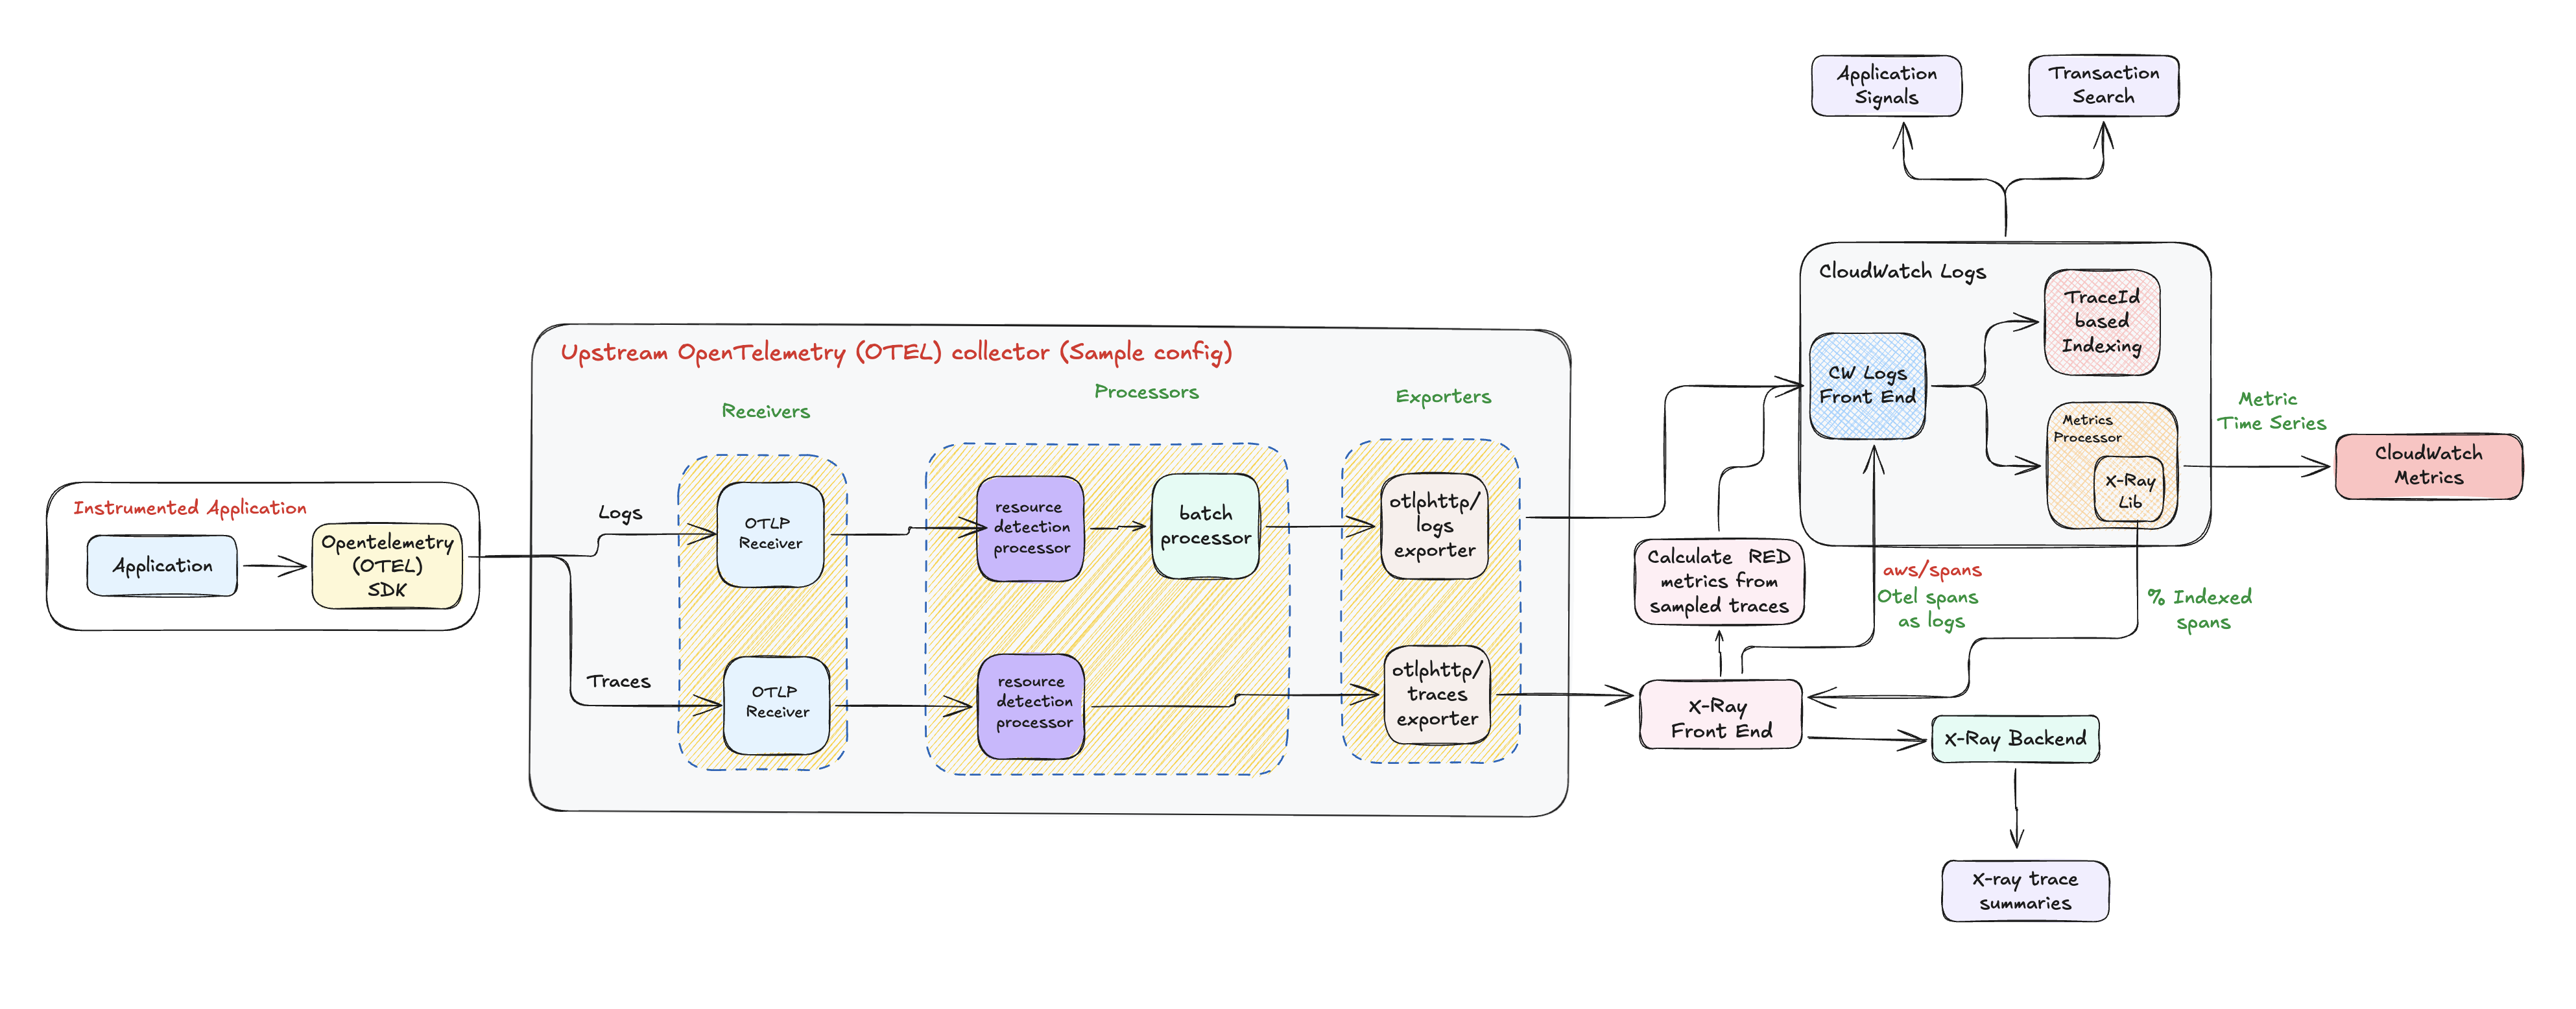
アップストリーム OTEL SDK + Collector の仕組み
ステップ 1: アプリケーションのインストルメンテーション
アプリケーションは、標準のアップストリーム OpenTelemetry SDK でインストルメント化されます。これにより、セマンティック規約に準拠した標準の OTEL スパンが生�成されます(http.method, http.route, http.status_codeなど)。
ステップ 2: クライアントサイドサンプリング
OTEL SDK は、設定されたサンプリング戦略を適用します。正確な RED メトリクスを得るには、以下が必要です。 always_on サンプリング(100%)を使用してください。メトリクスはサンプリングされたトレースのみからサーバーサイドで計算されるためです。部分的なサンプリングを使用すると、RED メトリクスはサンプリングされたサブセットのみを反映します。
ステップ 3: 標準 OTEL Collector 処理パイプライン
コレクターは標準のアップストリームプロセッサーを使用します。
receivers:
  otlp:
    protocols:
      grpc:
        endpoint: 0.0.0.0:4317
      http:
        endpoint: 0.0.0.0:4318
processors:
  resourcedetection:
    detectors:
      - eks
      - env
      - ec2
  batch:
    send_batch_size: 8192
    timeout: 200ms
ステップ 4: サーバーサイド RED メトリクスの計算
アップストリームの OTEL SDK はクライアント側で RED メトリクスを計算しないため、X-Ray フロントエンドは受信したサンプリングトレースからサーバー側でそれらを計算します。
- レート: サンプリングされたスパンデータから抽出されたリクエスト数
- エラー: サンプリングされたスパンのステータスコードから特定されたエラー数
- デュレーション: サンプリングされたスパンの開始時刻と終了時刻から計算されたレイテンシー
RED メトリクスの精度は、サンプリングレートに完全に依存します。5% のサンプリングでは、トラフィックの 5% についてのみメトリクスを取得できます。このアプローチで正確な RED メトリクスを得るには、100% サンプリングを設定してください。
ステップ 5: 分析と可視化
- Application Signals: サーバーで計算された RED メトリクスのゴールデンシグナルを使用したアプリケーションマップ(精度はサンプリングレートに依存)
- トランザクション検索: CloudWatch Logs からスパンデータをクエリ(
aws/spans) - X-Ray Analytics: インデックス付きスパンに対する従来のトレース分析
ADOT SDK アプローチとの主な違い
| 観点 | ADOT SDK + Custom Collector | Upstream OTEL SDK + Collector |
|---|---|---|
| RED メトリクス | クライアント側、トラフィックの 100% | サーバー側、サンプリングされたトラフィックのみ |
aws.* スパン属性 | ADOT SDK によって注入される | 存在しない |
| 言語サポート | Java、Python、.NET、Node.js | OTEL がサポートする任意の言語 |
| Collector のビルド | App Signals Processor を含むカスタムビルド | 標準のアップストリーム Collector ビルド |
| 正確なメトリクスに 100% サンプリングが必要 | No | Yes |
サンプル Collector 設定
receivers:
  otlp:
    protocols:
      grpc:
        endpoint: 0.0.0.0:4317
      http:
        endpoint: 0.0.0.0:4318
processors:
  resourcedetection:
    detectors:
      - eks
      - env
      - ec2
  batch:
    send_batch_size: 8192
    timeout: 200ms
exporters:
  otlphttp/logs:
    compression: gzip
    logs_endpoint: https://logs.us-east-1.amazonaws.com/v1/logs
    auth:
      authenticator: sigv4auth/logs
  otlphttp/traces:
    compression: gzip
    traces_endpoint: https://xray.us-east-1.amazonaws.com/v1/traces
    auth:
      authenticator: sigv4auth/traces
extensions:
  sigv4auth/logs:
    region: "us-east-1"
    service: "logs"
  sigv4auth/traces:
    region: "us-east-1"
    service: "xray"
service:
  extensions: [sigv4auth/logs, sigv4auth/traces]
  pipelines:
    logs:
      receivers: [otlp]
      processors: [resourcedetection, batch]
      exporters: [otlphttp/logs]
    traces:
      receivers: [otlp]
      processors: [resourcedetection, batch]
      exporters: [otlphttp/traces]
OTLP エンドポイントを使用した Collector レスのトレーシング
このアプローチは、ログとトレースを CloudWatch OTLP エンドポイントに直接送信することで、インフラストラクチャの複雑さを最小限に抑え、リソースのオーバーヘッドを削減します。
コレクターレストレーシ�ングを選ぶ理由
Collector-less トレーシングは、最大限のリソース利用率を維持しながら、可能な限りシンプルなアーキテクチャを求める場合に最適です。AWS エンドポイントに直接データを送信することで、追加のインフラストラクチャコンポーネントとそれに関連する管理オーバーヘッドが不要になります。
アーキテクチャ
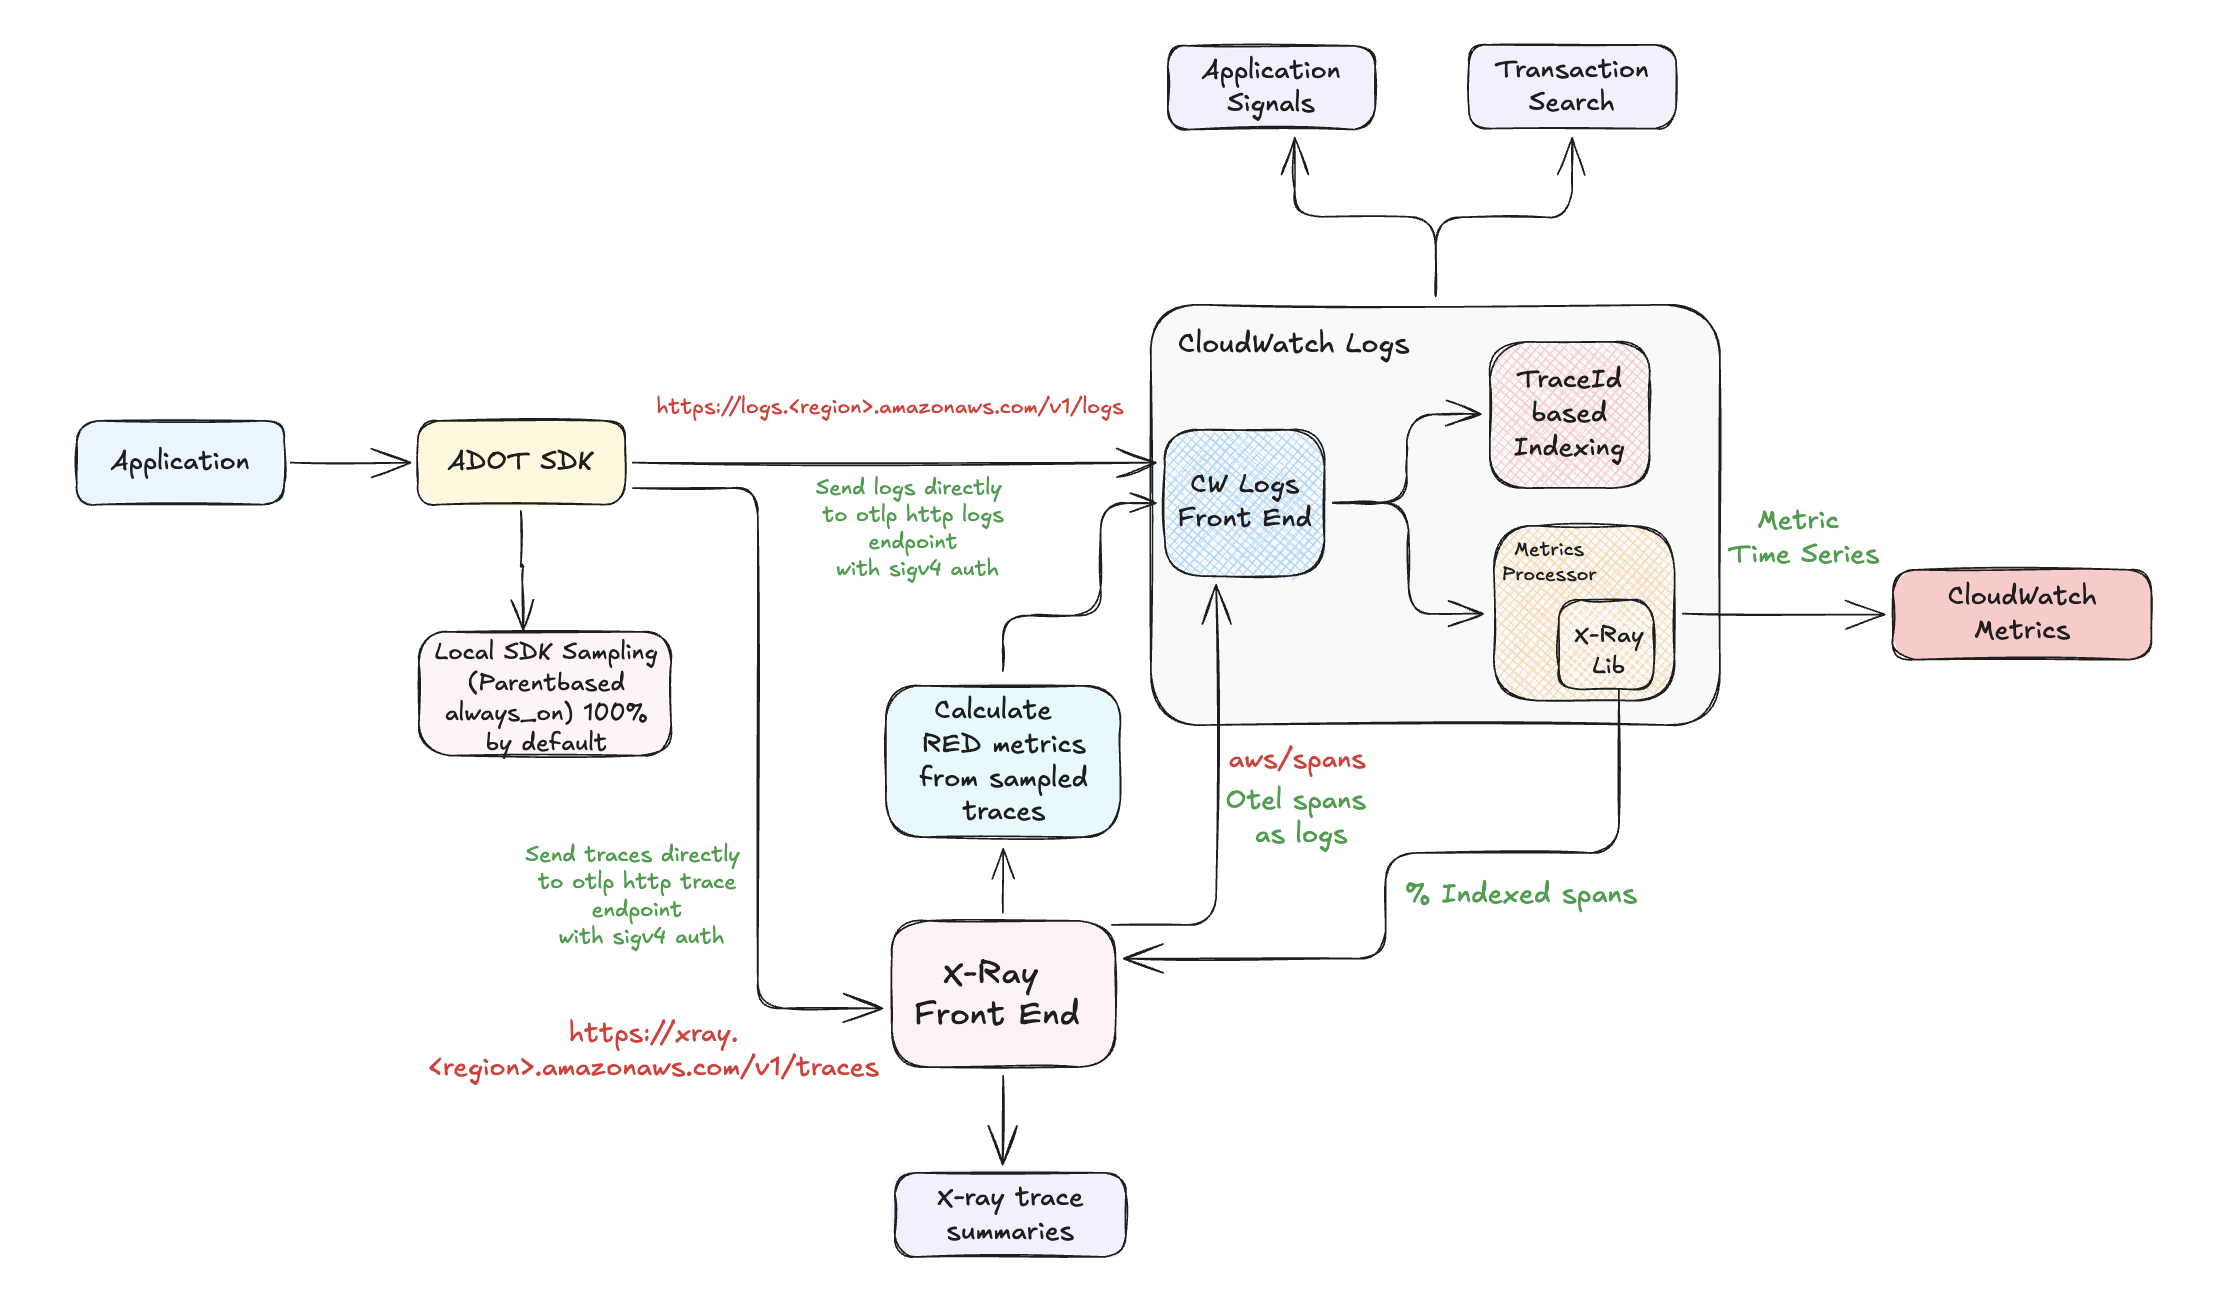
Collector レスのトレーシングの仕組み
ステップ 1: アプリケーションのインストルメンテーション
アプリケーションは ADOT SDK によって自動的にインストルメント化されます。コードを変更することなく、OpenTelemetry 形式でログとトレースをキャプチャします。
ステップ 2: ローカル SDK サンプリング (デフォルトでは ParentBased/AlwaysOn で 100%)
X-Ray リモートサンプラーは、サンプリングルールを取得するためにローカルプロキシ(CloudWatch Agent または OpenTelemetry Collector)を必要とします。これは呼び出しを行います http://localhost:2000/GetSamplingRules および http://localhost:2000/SamplingTargets 設定されたルールを取得します。コレクターレスモードでは、ローカルプロキシが実行されていないため、ADOT SDK はこれらのエンドポイントに到達できません。その結果、SDK はデフォルトのサンプリング戦略である ParentBased(AlwaysOn) at 100% にサイレントフォールバックします。
X-Ray リモートサンプリングはコレクターレスモードでは使用できないため、環境変数を使用してローカルサンプリング戦略を設定し、トレースのボリュームとコストを削減できます。
# Use a TraceIdRatioBased sampler at 5% (adjust ratio as needed)
OTEL_TRACES_SAMPLER=traceidratio
OTEL_TRACES_SAMPLER_ARG=0.05

# Or use parentbased_traceidratio to respect incoming trace context
OTEL_TRACES_SAMPLER=parentbased_traceidratio
OTEL_TRACES_SAMPLER_ARG=0.05
これらの変数がない場合、SDK はデフォルトで parentbased_always_on (100% サンプリング) は、すべてのトレースを送信するため、スループットの高いアプリケーションでは CloudWatch および X-Ray のコストが増加��する可能性があります。
ステップ 3: AWS との直接通信
コレクターを経由する代わりに、SigV4 認証を使用してデータが AWS サービスに直接送信されます。
- ログ →
https://logs.<region>.amazonaws.com/v1/logsOTLP HTTP 経由 - トレース →
https://xray.<region>.amazonaws.com/v1/tracesOTLP HTTP 経由
ステップ 4: サーバーサイド RED メトリクスの計算
X-Ray フロントエンドは、受信したトレースを分析して AWS バックエンドの RED メトリクスを計算します。SDK はコレクターレスモードでデフォルトで 100% サンプリングに設定されているため、サーバーサイドの RED メトリクスはすべてのトラフィックに対して計算されます。
ステップ 5: 分析オプション
- Application Signals: 動的グループ化と、サーバーで計算された RED メトリクスからのゴールデンシグナルを備えたアプリケーションマップ
- Transaction Search: CloudWatch Logs からの完全なスパンデータのクエリ (
aws/spans) - X-Ray Analytics: インデックス付きスパンに対する従来のトレース分析
重要な考慮事項
- Transaction Search が必要です — OTLP エンドポイントを使用する場合は有効にする必要があります
- ADOT SDK が必要です — この方法では通常の OpenTelemetry SDK は機能しません
- 認証は自動です — ADOT SDK が AWS SigV4 認証を処理します
- X-Ray リモートサンプリングなし — ローカルプロキシがない場合、SDK は X-Ray サンプリングルールを取得できず、デフォルトで 100% サンプリング (ParentBased/AlwaysOn) になります
- コストへの影響 — すべてのトレースが送信される (100% サンプリング) ため、スループットの高いサービスの CloudWatch および X-Ray のコストを監視してください
既存の X-Ray SDK + X-Ray Daemon(サポート終了タイムライン)
AWS X-Ray SDK とデーモンの GA は 2026 年 2 月 25 日に終了し、現在はメンテナンスモードになっています。
| SDK およびデーモンのフェ�ーズ | 開始日 | 終了日 | 提供されるサポート |
|---|---|---|---|
| General Availability | N/A | 2026年2月25日 | X-Ray SDK とデーモンは完全にサポートされます。AWS はバグ修正およびセキュリティ修正を含む定期的な SDK およびデーモンのリリースを提供します。 |
| Maintenance Mode | 2026年2月25日 | N/A | AWS は X-Ray SDK およびデーモンのリリースをセキュリティ問題への対応のみに限定します。SDK/デーモンは新機能の拡張を受け取りません。 |
詳細については、X-Ray のサポート終了タイムラインおよび X-Ray から OpenTelemetry への移行ガイドを参照してください。
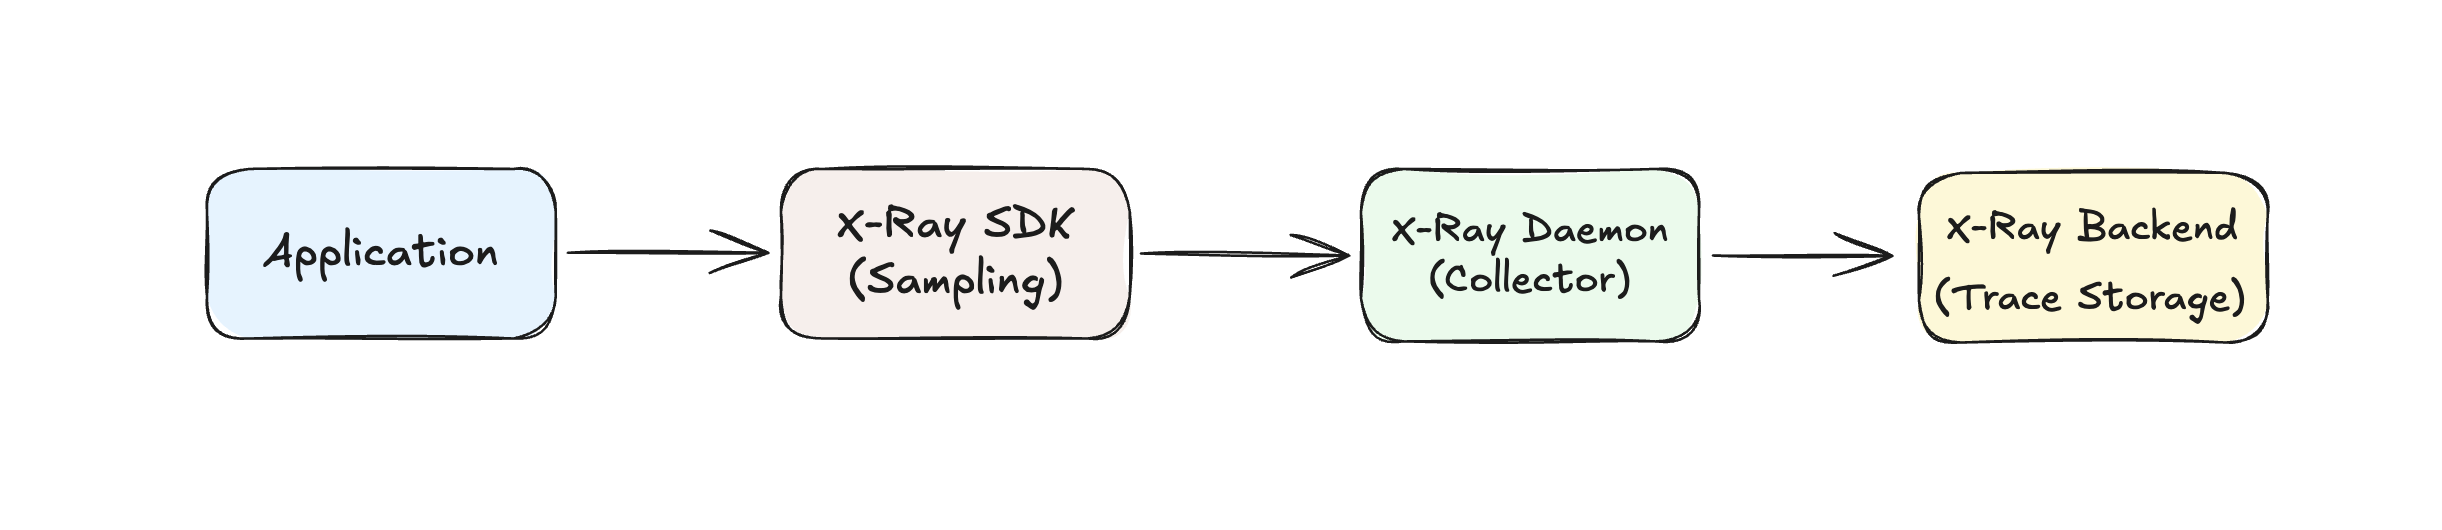
このアプローチは、既存の X-Ray への投資を持つ組織が、OpenTelemetry への移行を計画しながら、Application Signals の機能を段階的に採用したい場合に適しています。
はじめ方
- トランザクション検索を有効化する — 既存の X-Ray データに対して
- 100% サンプリングを設定する — またはコスト効率の良い異常検出のためにアダ��プティブサンプリングを使用する
- 移行を計画する — サービスを ADOT インストルメンテーションに段階的に移行し始める
RED メトリクス計算の概要
RED (Rate、Errors、Duration) メトリクスがさまざまなインストルメンテーション設定でどのように計算されるかを理解することは、適切なアプローチを選択するうえで非常に重要です。
| インストルメンテーションのセットアップ | 計算方法 | 環境変数 | 要件 |
|---|---|---|---|
| ADOT SDK + CloudWatch Agent | クライアント側 | OTEL_AWS_APPLICATION_SIGNALS_ENABLED=true | なし - 任意のサンプリングで動作 |
| ADOT SDK + Custom OTEL Collector | クライアント側 | OTEL_AWS_APPLICATION_SIGNALS_ENABLED=true | App Signals Processor を含むカスタム Collector |
| Upstream OTEL SDK + OTEL Collector | サーバー側 | N/A(ADOT SDK なし) | Transaction Search + 精度のための 100% サンプリング |
| Collector-less (ADOT SDK) | サーバー側 | OTEL_AWS_APPLICATION_SIGNALS_ENABLED=false(デフォルト) | Transaction Search。デフォルトで 100% サンプリング(ローカルプロキシがない場合、X-Ray リモートサンプリングは利用不可) |
| X-Ray SDK + X-Ray Daemon | サーバー側(外挿) | N/A | サンプリングされたデータに基づく |
クライアントサイド RED メトリクス (ADOT SDK — CW Agent およびカスタム Collector)
Application → ADOT SDK → Calculate Metrics → CW Agent or Custom Collector → AWS
                ↓
            (100% of requests)
- 計算はアプリケーション内で実行されます(サンプリング決定の前に)
- 常に正確(トレースサンプリング設定に関係なく)
- デフォルトの動作(次の場合)
OTEL_AWS_APPLICATION_SIGNALS_ENABLED=true - メトリクス計算のための Transaction Search 依存関係なし
サーバーサイド RED メトリクス (アップストリーム OTEL SDK、Collector レス、X-Ray)
Application → Upstream OTEL SDK/Collector → AWS Backend → Calculate Metrics
                ↓
        (Requires 100% sampling for accuracy)
- 計算は受信したスパンデータから AWS バックエンド(X-Ray フロントエンド)で行われます
- OTLP ベースのセットアップでは Transaction Search を有効にする必要があります
- 正確なメトリクスには 100% サンプリングが必要です(外挿を行う X-Ray を除く)