Setting up Application Signals + Transaction Search
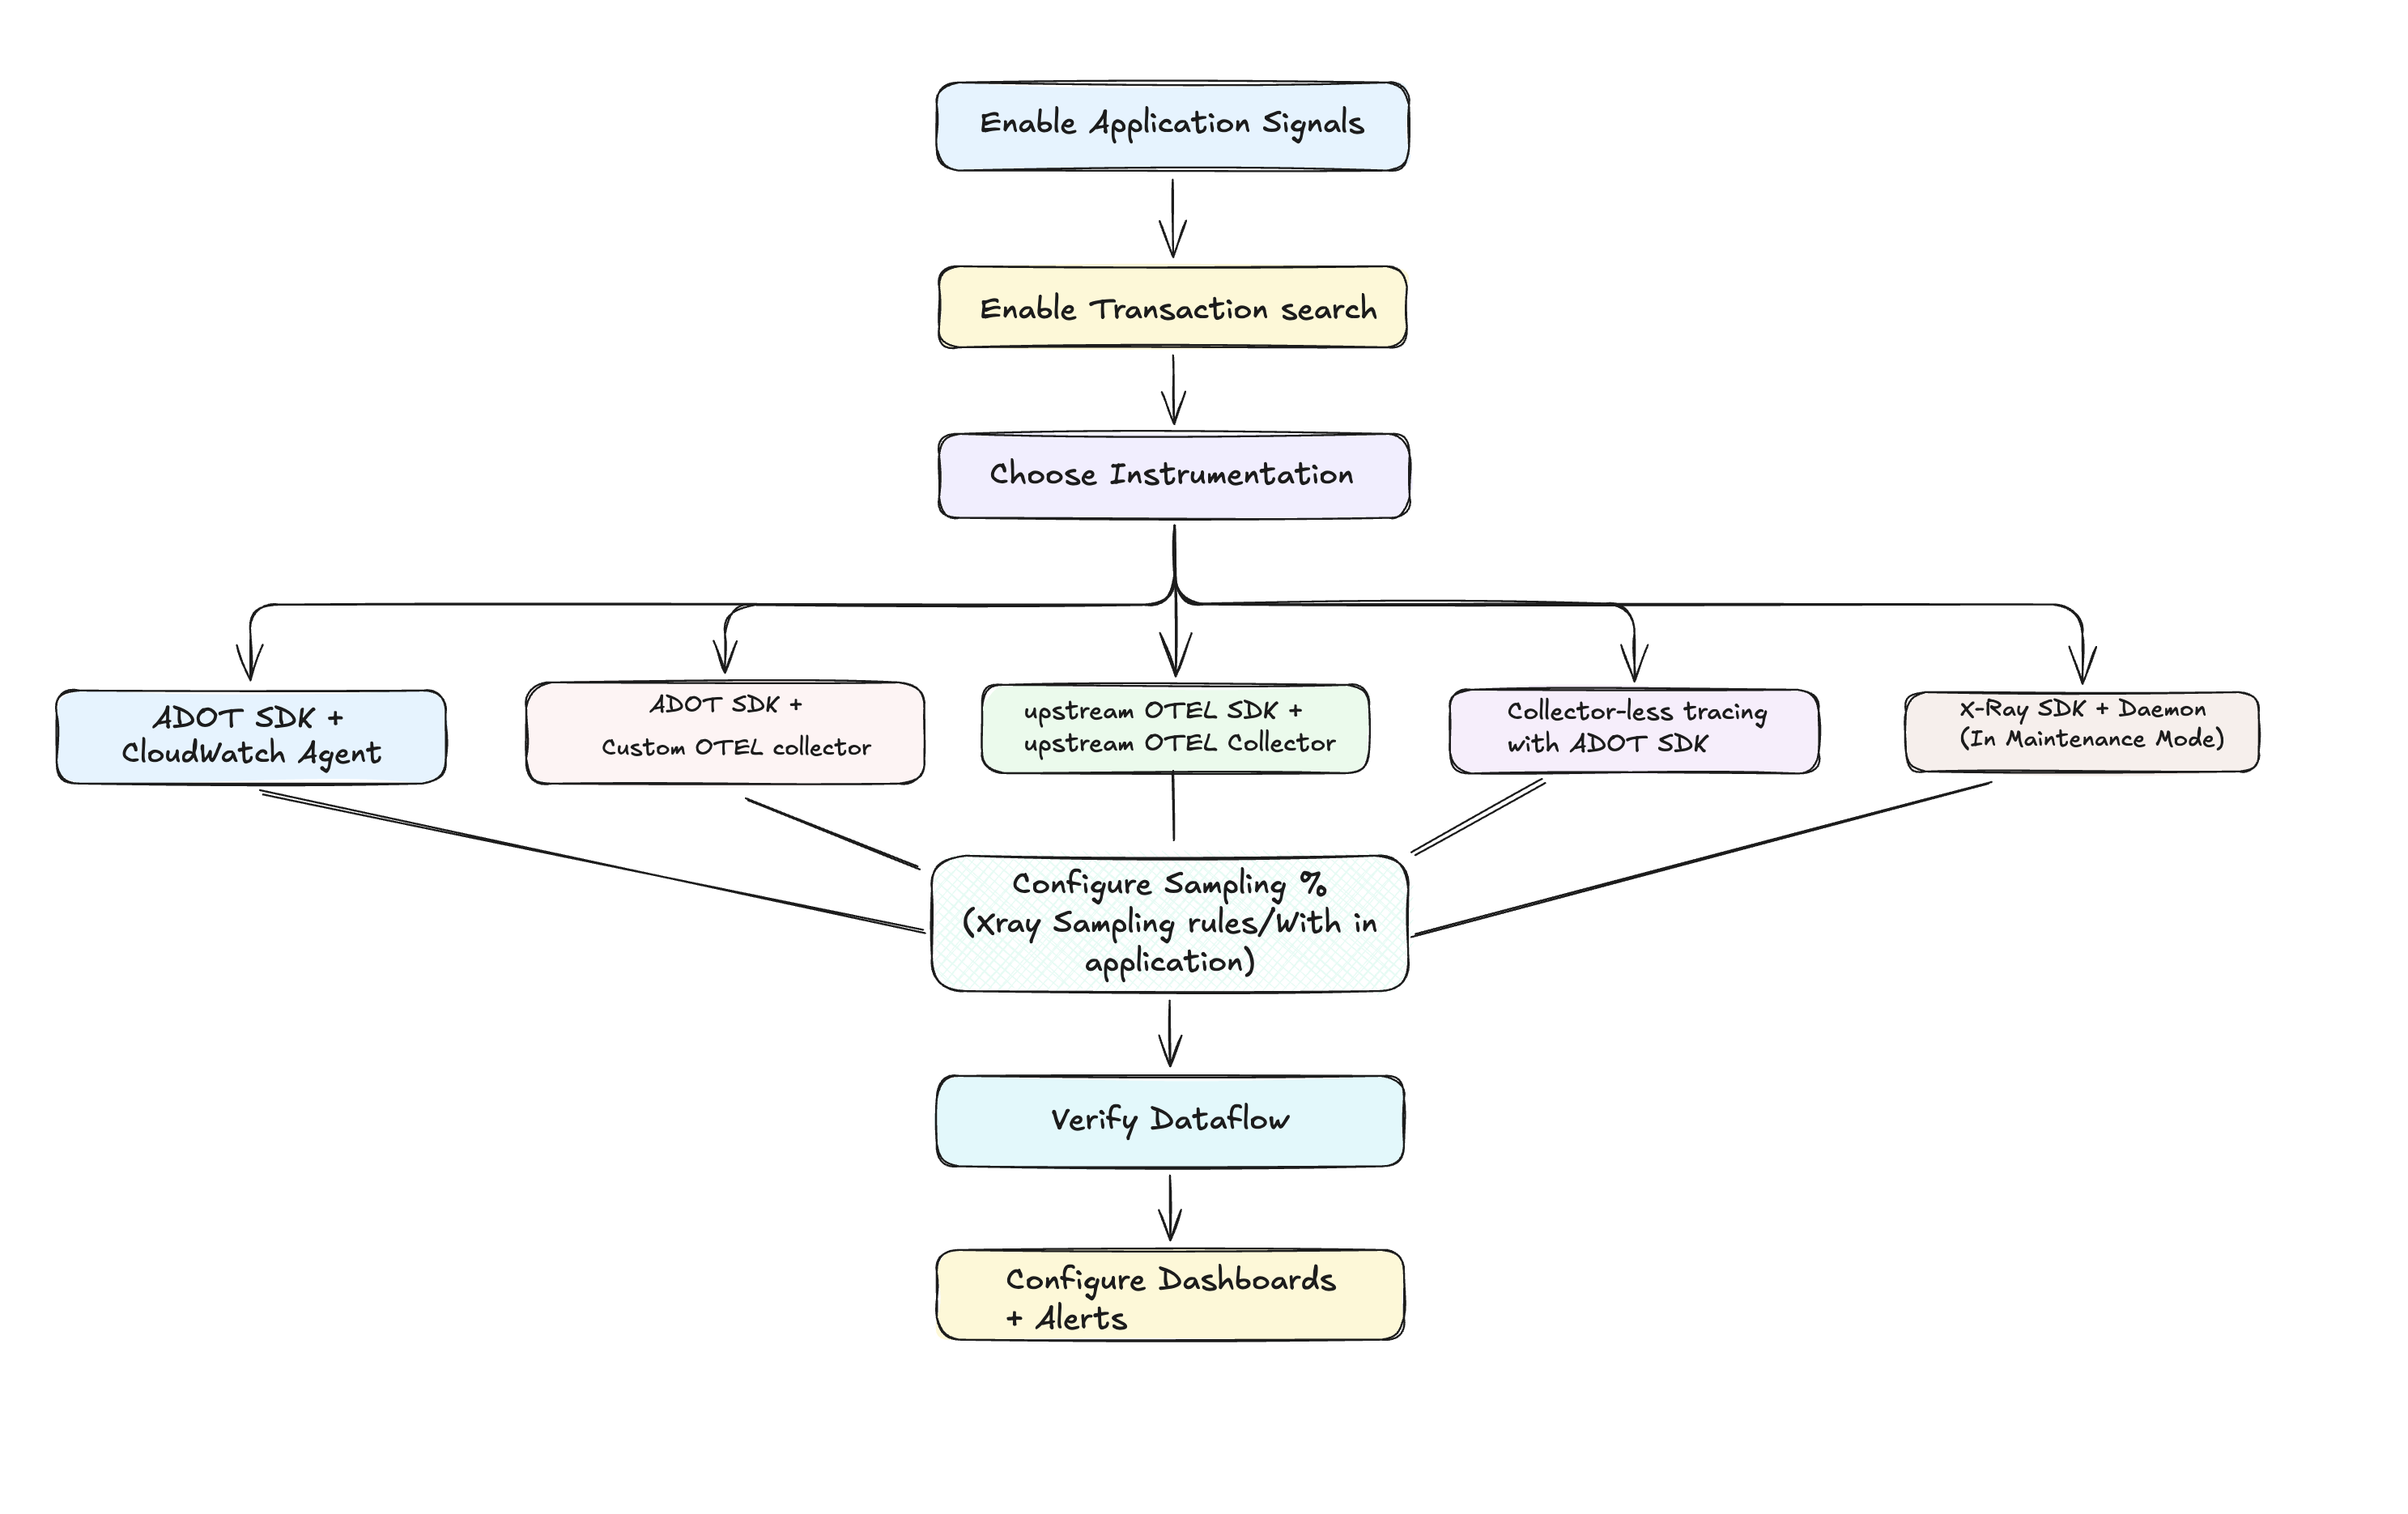
High-Level Setup Process
Prerequisites & Permissions
Before enabling CloudWatch Application Signals, ensure you have the necessary IAM permissions and infrastructure in place. Refer to Application Signals Permissions for detailed requirements.
Supported Systems
Application Signals is supported and tested on Amazon EKS, native Kubernetes, Amazon ECS, and Amazon EC2.
| Language | Runtime Version |
|---|---|
| Java | JVM versions 8, 11, 17, 21, and 23 |
| Python | Python versions 3.9 and higher |
| .NET | Release 1.6.0 and below: .NET 6, 8, and .NET Framework 4.6.2 and higher. Release 1.7.0 and higher: .NET 8, 9, and .NET Framework 4.6.2 and higher |
| Node.js | Node.js versions 14, 16, 18, 20, and 22 |
| PHP | PHP versions 8.0 and higher |
| Ruby | CRuby >= 3.1, JRuby >= 9.3.2.0, or TruffleRuby >= 22.1 |
| GoLang | Golang versions 1.18 and higher |
For the full support matrix, see Application Signals Supported Systems.
Step 1: Enable Application Signals in your account
Refer to Enable Application Signals in your account documentation.
Step 2: Enable Transaction Search
Refer to Enable transaction search documentation.
Step 3: Choose Your Instrumentation Strategy
Based on your requirements, select one of the instrumentation approaches. Application Signals supports multiple combinations of SDKs and collectors:
Available SDKs
- AWS Distro for OpenTelemetry (ADOT) SDK — AWS distribution of OpenTelemetry with Application Signals support. Available for Java, Python, .NET, and Node.js.
- Upstream OpenTelemetry SDK — Standard vendor-neutral OpenTelemetry SDK. Works with any OTEL-supported language (Erlang, Rust, Ruby, Go, PHP, etc.).
- X-Ray SDK — Legacy AWS tracing SDK. ⚠️ Maintenance mode
Available Collectors / Agents
- CloudWatch Agent — Managed AWS agent with built-in Application Signals support, Container Insights integration, and log collection.
- OpenTelemetry Collector — Standard upstream or custom-built collector. Supports multi-destination telemetry fan-out.
- X-Ray Daemon — Legacy trace relay for X-Ray SDK. ⚠️ Maintenance mode
Decision Matrix
| Approach | Best For | Key Benefits |
|---|---|---|
| ADOT SDK + CloudWatch Agent | AWS-native environments, deep service integration | Tight AWS integration, Container Insights correlation, managed experience |
| ADOT SDK + Custom OTEL Collector | Multi-destination telemetry with full Application Signals support | Client-side RED metrics, App Signals processor, multi-destination flexibility |
| Upstream OTEL SDK + OTEL Collector | Vendor-neutral strategy, non-ADOT languages, multi-cloud | Full vendor neutrality, any OTEL-supported language, no AWS SDK dependency |
| Direct OTLP Endpoint (Collector-less tracing) | Resource-efficient applications, minimal infrastructure | Minimal overhead, simplified architecture, reduced infrastructure |
| X-Ray SDKs | Legacy X-Ray users, gradual migration | Existing investment protection, minimal change requirements. ⚠️ Maintenance mode |
Feature Comparison
| Feature | ADOT SDK + CW Agent | ADOT SDK + Custom OTEL Collector | Upstream OTEL SDK + OTEL Collector | Collector-less tracing with ADOT SDK | X-Ray SDKs |
|---|---|---|---|---|---|
| AWS Support | ✅ Yes | ⚠️ Only for data sent to AWS | ⚠️ Only for data sent to AWS | ✅ Yes | ✅ Yes (⚠️ Maintenance mode) |
| Nonstandard language support | ❌ No | ❌ No | ✅ Yes | ❌ No | ❌ No |
| Container Insights integration | ✅ Yes | ❌ No | ❌ No | ❌ No | ❌ No |
| Out of the box logging with CloudWatch Logs | ✅ Yes | ❌ No | ❌ No | ✅ Yes | ❌ No |
| Out of the box runtime metrics | ✅ Yes | ✅ Yes | ✅ Yes | ❌ No | ❌ No |
| Always gets RED metrics on 100% of traffic | ✅ Yes (client-side) | ✅ Yes (client-side) | ⚠️ Only with 100% sampling (server-side) | ⚠️ Only with 100% sampling (server-side) | ⚠️ Only with 100% sampling (server-side) |
| Multi-destination telemetry | ❌ No | ✅ Yes | ✅ Yes | ❌ No | ❌ No |
For detailed implementation of each approach, see Instrumentation Setups.
Step 4: Understanding Sampling and Trace Indexing
Application Signals separates request sampling from trace indexing:
- Request Sampling: Determines which percentage of requests are sampled and sent to AWS
- Selective Trace Indexing: Percentage of spans stored in CloudWatch Logs that are sent to X-Ray backend for X-Ray trace summaries. Trace summaries are helpful for debugging transactions and are valuable for asynchronous processes. You need to index only a small fraction of spans as trace summaries.
Request Sampling
1. Default Application Signals Sampling Configuration
When you enable Application Signals, X-Ray centralized sampling is enabled by default with these settings:
| Setting | Default Value | Description |
|---|---|---|
| Reservoir | 1 request/second | Fixed number of requests sampled per second |
| Fixed Rate | 5% | Percentage of additional requests beyond reservoir |
The environment variables for the AWS Distro for OpenTelemetry (ADOT) SDK agent are set as follows:
| Environment Variable | Value | Description |
|---|---|---|
| OTEL_TRACES_SAMPLER | xray | Uses X-Ray sampling service |
| OTEL_TRACES_SAMPLER_ARG | endpoint=http://cloudwatch-agent.amazon-cloudwatch:2000 | CloudWatch agent endpoint |
2. Modifying Sampling Configuration
Option 1: X-Ray Centralized Sampling (Recommended)
- Configure X-Ray sampling rules to adjust your sampling rate (e.g., 10%)
- Refer to Configure sampling rules documentation
- Benefits: Centralized control, dynamic updates, service-specific rules
Option 2: Local sampling in the ADOT SDK
For local control, disable X-Ray centralized sampling:
| Environment Variable | Value | Description |
|---|---|---|
| OTEL_TRACES_SAMPLER | parentbased_traceidratio | Local sampling |
| OTEL_TRACES_SAMPLER_ARG | 0.10 | 10% sampling rate |
3. Alternative: X-Ray Adaptive Sampling (Cost-Optimized Approach)
If you don't need 100% sampling but want better anomaly coverage, consider X-Ray adaptive sampling which automatically increases sampling during error spikes and latency outliers while maintaining cost-effective baseline rates:
Key Benefits:
- Automatic anomaly detection: Boosts sampling during HTTP 5xx errors or high latency
- Cost control: Maintains low baseline sampling (e.g., 5%) during normal operations
- Configurable boost limits: Set maximum sampling rates and cooldown periods
- Critical trace capture: Ensures anomaly spans are captured even when full traces aren't sampled
- Centralized control: Configure through X-Ray sampling rules without application code changes
Configuration Example:
{
  "RuleName": "AdaptiveProductionRule",
  "Priority": 1,
  "ReservoirSize": 1,
  "FixedRate": 0.05,
  "ServiceName": "*",
  "ServiceType": "*",
  "Host": "*",
  "HTTPMethod": "*",
  "URLPath": "*",
  "SamplingRateBoost": {
    "MaxRate": 0.25,
    "CooldownWindowMinutes": 10
  }
}
Requirements:
- ADOT Java SDK (v2.11.5 or higher)
- Must run with CloudWatch Agent or OpenTelemetry Collector
- Compatible with Amazon EC2, ECS, EKS, and self-hosted Kubernetes
For detailed setup instructions, refer to X-Ray Adaptive Sampling documentation.
For more advanced sampling configurations, see OTEL_TRACES_SAMPLER documentation.
Trace Indexing
1. Default Indexing Rate:
- 1% indexing is included at no additional charge
- Above 1% indexing incurs X-Ray pricing charges
- Refer to CloudWatch Pricing documentation for current rates
2. Custom Indexing Rates:
# Higher indexing for applications requiring more X-Ray analytics (incurs charges)
aws cloudwatch put-transaction-search-configuration \
  --span-indexing-rate 0.10  # 10% indexing - X-Ray charges apply

# Lower indexing for cost optimization (still within free tier)
aws cloudwatch put-transaction-search-configuration \
  --span-indexing-rate 0.005  # 0.5% indexing - no additional charges