Instrumenting Java Spring Integration Applications
This article describes an approach for manually instrumenting Spring-Integration applications utilizing Open Telemetry and X-ray.
The Spring-Integration framework is designed to enable the development of integration solutions typical of event-driven architectures and messaging-centric architectures. On the other hand, OpenTelemetry tends to be more focused on micro services architectures, in which services communicate and coordinate with each other using HTTP requests. Therefore this guide will provide an example of how to instrument Spring-Integration applications using manual instrumentation with the OpenTelemetry API.
Background Information
What is tracing?
The following quote from the OpenTelemetry documentation gives a good overview of what a trace's purpose is:
Traces give us the big picture of what happens when a request is made to an application. Whether your application is a monolith with a single database or a sophisticated mesh of services, traces are essential to understanding the full “path” a request takes in your application.
Given that one of the main benefits of tracing is end-to-end visibility of a request, it is important for traces to link properly all the way from the request origin to the backend. A common way of doing this in OpenTelemetry is to utilize nested spans. This works in a microservices architecture where the spans are passed from service to service until they reach the final destination. In a Spring Integration application, we need to create parent/child relationships between spans created both remotely AND locally.
Tracing Utilizing Context Propagation
We will demonstrate an approach using context propagation. Although this approach is traditionally used when you need to create parent/child relationship between spans created locally and in remote locations, it will be used for the case of the Spring Integration Application because it simplifies the code and will allow the application to scale: it will be possible to process messages in parallel in multiple threads and it will also be possible to scale horizontally in case we need to process messages in different hosts.
Here is an overview of what is necessary to achieve this:
-
Create a
ChannelInterceptorand register it as aGlobalChannelInterceptorso that it can capture messages being sent across all channels. -
In the
ChannelInterceptor:- In the
preSendmethod:- try to read the context from the previous message that is being generated upstream.This is where we are able to connect spans from upstream messages. If no context exists, a new trace is started (this is done by the OpenTelemetry SDK).
- Create a Span with a unique name that identifies that operation. This can be the name of the channel where this message is being processed.
- Save current context in the message.
- Store the context and scope in thread.local so that they can be closed afterwards.
- inject context in the message being sent downstream.
- In the
afterSendCompletion:- Restore the context and scope from thread.local
- Recreate the span from the context.
- Register any exceptions raised while processing the message.
- Close Scope.
- End Span.
- In the
This is a simplified description of what needs to be done. We are providing a functional sample application that uses the Spring-Integration framework. The code for this application can be found here.
To view only the changes that were put in place to instrument the application, view this diff.
To run this sample application use:
# build and run
mvn spring-boot:run
# create sample input file to trigger flow
echo 'testcontent\nline2content\nlastline' > /tmp/in/testfile.txt
To experiment with this sample application, you will need to have the ADOT collector running in the same machine as the application with a configuration similar to the following one:
receivers:
  otlp:
    protocols:
      grpc:
        endpoint: 0.0.0.0:4317
      http:
        endpoint: 0.0.0.0:4318
processors:
  batch/traces:
    timeout: 1s
    send_batch_size: 50
  batch/metrics:
    timeout: 60s
exporters:
  aws xray: region:us-west-2
  aws emf:
    region: us-west-2
service:
  pipelines:
    traces:
      receivers: [otlp]
      processors: [batch/traces]
      exporters: [awsxray]
    metrics:
      receivers: [otlp]
      processors: [batch/metrics]
      exporters: [awsemf]
Results
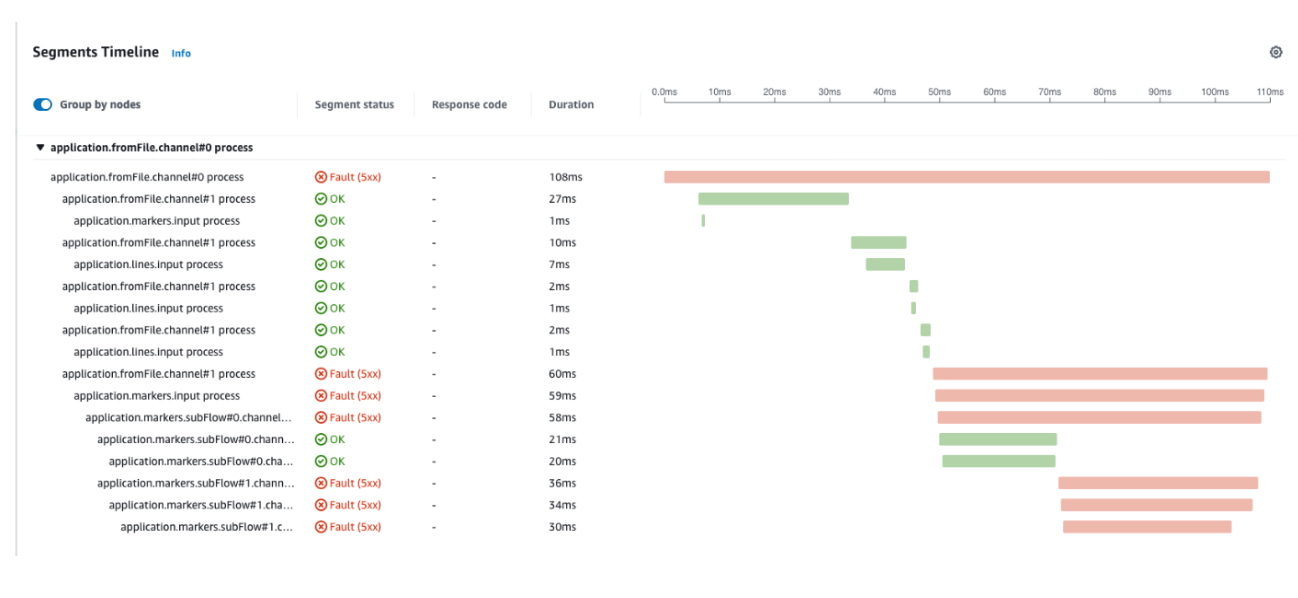
If we run the sample application and then run the following command, this is what we get:
echo 'foo123\nbar123\nfoo1234' > /tmp/in/testfile.txt

We can see that the segments above match the workflow described in the sample application. Exceptions are expected when some of the messages were processed, therefore we can see that they are being properly registered and will allow us to troubleshoot them in X-Ray.
FAQ
How do we create nested spans?
There are three mechanisms in OpenTelemetry that can be used to connect spans:
Explicitly
You need to pass the parent span to the place where the child span is created and link both of them using:
    Span childSpan = tracer.spanBuilder("child")
    .setParent(Context.current().with(parentSpan))
    .startSpan();
Implicitly
The span context will be stored in thread.local under the hood. This method is indicated when you are sure that you are creating spans in the same thread.
    void parentTwo() {
        Span parentSpan = tracer.spanBuilder("parent").startSpan();
        try(Scope scope = parentSpan.makeCurrent()) {
            childTwo();
        } finally {
        parentSpan.end();
        }
    }
    void childTwo() {
        Span childSpan = tracer.spanBuilder("child")
            // NOTE: setParent(...) is not required;
            // `Span.current()` is automatically added as the parent
            .startSpan();
        try(Scope scope = childSpan.makeCurrent()) {
            // do stuff
        } finally {
            childSpan.end();
        }
    }
Context Propagation
This method will store the context somewhere (HTTP headers or in a message) so that it can be transported to a remote location where the child span is created. It is not a strict requirement to be a remote location. This can be used in the same process as well.
How are OpenTelemetry properties translated into X-Ray properties?
Please see the following guide to view the relationship.