Operating the AWS Distro for OpenTelemetry (ADOT) Collector
The ADOT collector is a downstream distribution of the open-source OpenTelemetry Collector by CNCF.
Customers can use the ADOT Collector to collect signals such as metrics and traces from different environments including on-prem, AWS and from other cloud providers.
In order to operate the ADOT Collector in a real world environment and at scale, operators should monitor the collector health, and scale as needed. In this guide, you will learn about the actions one can take to operate the ADOT Collector in a production environment.
Deployment architecture
Depending on the your requirements, there are a few deployment options that you might want to consider.
- No Collector
- Agent
- Gateway
Check out the OpenTelemetry documentation for additional information on these concepts.
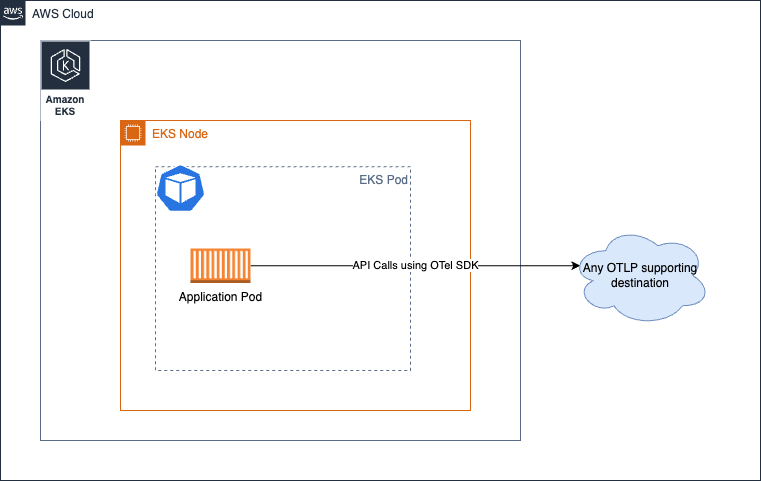
No Collector
This option essentially skips the collector from the equation completely. If you are not aware, it is possible to make the API calls to destination services directly from the OTEL SDK and send the signals. Think about you making calls to the AWS X-Ray's PutTraceSegments API directly from your application process instead of sending the spans to an out-of-process agent such as the ADOT Collector.
We strongly encourage you to take a look at the section in the upstream documentation for more specifics as there isn't any AWS specific aspect that changes the guidance for this approach.
Agent
In this approach, you will run the collector in a distributed manner and collect signals into the destinations. Unlike the No Collector option, here we separate the concerns and decouple the application from having to use its resources to make remote API calls and instead communicate to a locally accessible agent.
Essentially it will look like this below in an Amazon EKS environment running the collector as a Kubernetes sidecar:
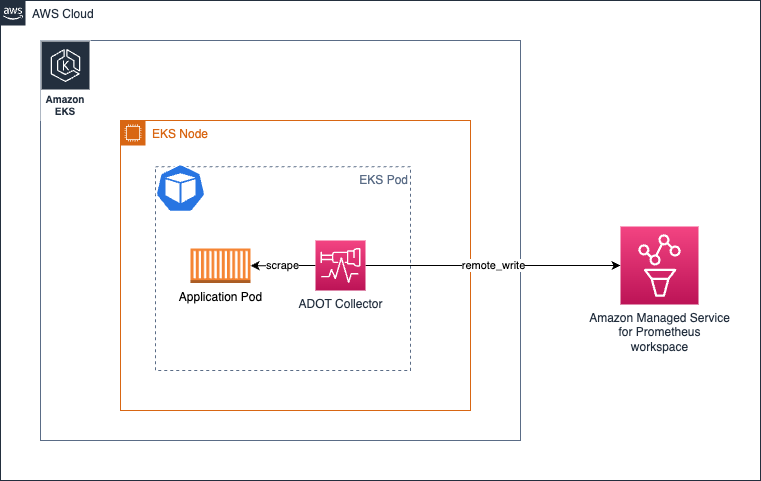
In this above architecture, your scrape configuration shouldn't really have to make use of any service discovery mechanisms at all since you will be scraping the targets from localhost given that the collector is running in the same pod as the application container.
The same architecture applies to collecting traces as well. You will simply have to create a OTEL pipeline as shown here
Pros and Cons
-
One argument advocating for this design is that you don't have to allocate extra-ordinary amount of resources (CPU, Memory) for the Collector to do its job since the targets are limited to localhost sources.
-
The disadvantage of using this approach could be that, the number of varied configurations for the collector pod configuration is directly proportional to the number of applications you are running on the cluster. This means, you will have to manage CPU, Memory and other resource allocation individually for each Pod depending on the workload that is expected for the Pod. By not being careful with this, you might over or under-allocate resources for the Collector Pod that will result in either under-performing or locking up CPU cycles and Memory which could otherwise be used by other Pods in the Node.
You could also deploy the collector in other models such as Deployments, Daemonset, Statefulset etc based on your needs.
Running the collector as a Daemonset on Amazon EKS
You can choose to run the collector as a Daemonset in case you want to evenly distribute the load (scraping and sending the metrics to Amazon Managed Service for Prometheus workspace) of the collectors across the EKS Nodes.
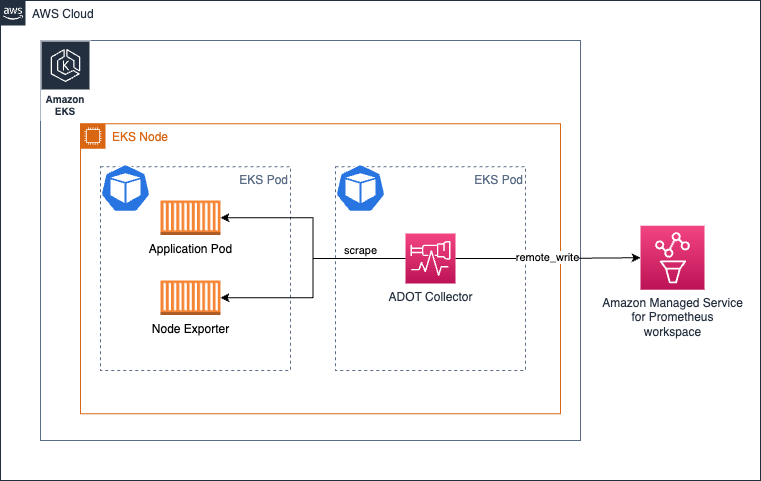
Ensure you have the keep action that makes the collector only scrape targets from its own host/Node.
See sample below for reference. Find more such configuration details here.
scrape_configs:
    - job_name: kubernetes-apiservers
    bearer_token_file: /var/run/secrets/kubernetes.io/serviceaccount/token
    kubernetes_sd_configs:
    - role: endpoints
    relabel_configs:
    - action: keep
        regex: $K8S_NODE_NAME
        source_labels: [__meta_kubernetes_endpoint_node_name]
    scheme: https
    tls_config:
        ca_file: /var/run/secrets/kubernetes.io/serviceaccount/ca.crt
        insecure_skip_verify: true
The same architecture can also be used for collecting traces. In this case, instead of the Collector reaching out to the endpoints to scrape Prometheus metrics, the trace spans will be sent to the Collector by the application pods.
Pros and Cons
Advantages
- Minimal scaling concerns
- Configuring High-Availability is a challenge
- Too many copies of Collector in use
- Can be easy for Logs support
Disadvantages
- Not the most optimal in terms of resource utilization
- Disproportionate resource allocation
Running the collector on Amazon EC2
As there is no side car approach in running the collector on EC2, you would be running the collector as an agent on the EC2 instance. You can set a static scrape configuration such as the one below to discover targets in the instance to scrape metrics from.
The config below scrapes endpoints at ports 9090 and 8081 on localhost.
Get a hands-on deep dive experience in this topic by going through our EC2 focused module in the One Observability Workshop.
global:
  scrape_interval: 15s # By default, scrape targets every 15 seconds.

scrape_configs:
- job_name: 'prometheus'
  static_configs:
  - targets: ['localhost:9090', 'localhost:8081']
Running the collector as Deployment on Amazon EKS
Running the collector as a Deployment is particularly useful when you want to also provide High Availability for your collectors. Depending on the number of targets, metrics available to scrape etc the resources for the Collector should be adjusted to ensure the collector isn't starving and hence causing issues in signal collection.
Read more about this topic in the guide here.
The following architecture shows how a collector is deployed in a separate node outside of the workload nodes to collect metrics and traces.
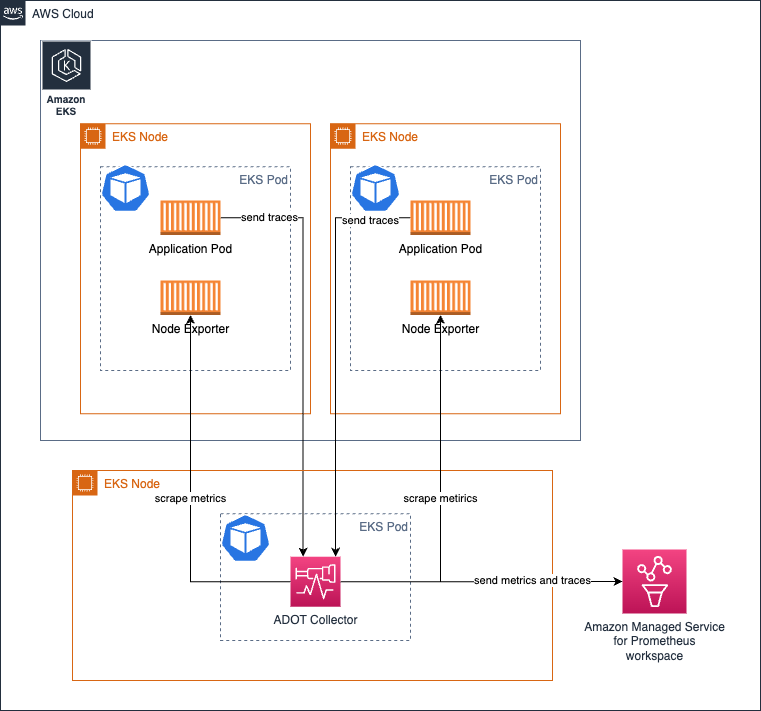
To setup High-Availability for metric collection, read our docs that provide detailed instructions on how you can set that up
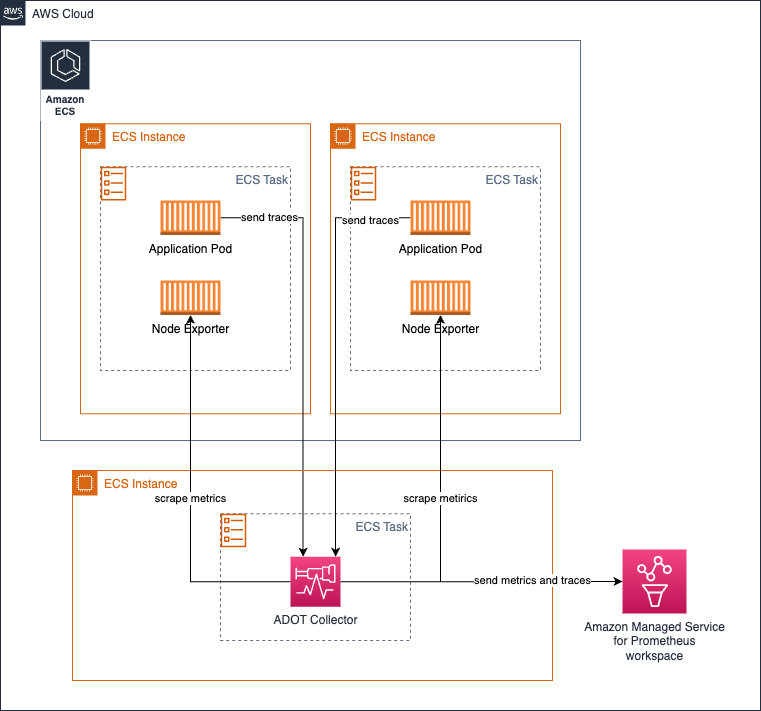
Running the collector as a central task on Amazon ECS for metrics collection
You can use the ECS Observer extension to collect Prometheus metrics across different tasks in an ECS cluster or across clusters.
Sample collector configuration for the extension:
extensions:
  ecs_observer:
    refresh_interval: 60s # format is https://golang.org/pkg/time/#ParseDuration
    cluster_name: 'Cluster-1' # cluster name need manual config
    cluster_region: 'us-west-2' # region can be configured directly or use AWS_REGION env var
    result_file: '/etc/ecs_sd_targets.yaml' # the directory for file must already exists
    services:
      - name_pattern: '^retail-.*$'
    docker_labels:
      - port_label: 'ECS_PROMETHEUS_EXPORTER_PORT'
    task_definitions:
      - job_name: 'task_def_1'
        metrics_path: '/metrics'
        metrics_ports:
          - 9113
          - 9090
        arn_pattern: '.*:task-definition/nginx:[0-9]+'
Pros and Cons
- An advantage in this model is that there are fewer collectors and configurations to manage yourself.
- When the cluster is rather large and there are thousands of targets to scrape, you will have to carefully design the architecture in such a way that the load is balanced across the collectors. Adding this to having to run near-clones of the same collectors for HA reasons should be done carefully in order to avoid operational issues.
Gateway
Managing Collector health
The OTEL Collector exposes several signals for us to keep tab of its health and performance. It is essential that the collector's health is closely monitored in order to take corrective actions such as,
- Scaling the collector horizontally
- Provisioning additional resources to the collector for it to function as desired
Collecting health metrics from the Collector
The OTEL Collector can be configured to expose metrics in Prometheus Exposition Format by simply adding the telemetry section to the service pipeline. The collector also can expose its own logs to stdout.
More details on telemetry configuration can be found in the OpenTelemetry documentation here.
Sample telemetry configuration for the collector.
service:
  telemetry:
    logs:
      level: debug
    metrics:
      level: detailed
      address: 0.0.0.0:8888
Once configured, the collector will start exporting metrics such as this below at http://localhost:8888/metrics.
# HELP otelcol_exporter_enqueue_failed_spans Number of spans failed to be added to the sending queue.
# TYPE otelcol_exporter_enqueue_failed_spans counter
otelcol_exporter_enqueue_failed_spans{exporter="awsxray",service_instance_id="523a2182-539d-47f6-ba3c-13867b60092a",service_name="aws-otel-collector",service_version="v0.25.0"} 0

# HELP otelcol_process_runtime_total_sys_memory_bytes Total bytes of memory obtained from the OS (see 'go doc runtime.MemStats.Sys')
# TYPE otelcol_process_runtime_total_sys_memory_bytes gauge
otelcol_process_runtime_total_sys_memory_bytes{service_instance_id="523a2182-539d-47f6-ba3c-13867b60092a",service_name="aws-otel-collector",service_version="v0.25.0"} 2.4462344e+07

# HELP otelcol_process_memory_rss Total physical memory (resident set size)
# TYPE otelcol_process_memory_rss gauge
otelcol_process_memory_rss{service_instance_id="523a2182-539d-47f6-ba3c-13867b60092a",service_name="aws-otel-collector",service_version="v0.25.0"} 6.5675264e+07

# HELP otelcol_exporter_enqueue_failed_metric_points Number of metric points failed to be added to the sending queue.
# TYPE otelcol_exporter_enqueue_failed_metric_points counter
otelcol_exporter_enqueue_failed_metric_points{exporter="awsxray",service_instance_id="d234b769-dc8a-4b20-8b2b-9c4f342466fe",service_name="aws-otel-collector",service_version="v0.25.0"} 0
otelcol_exporter_enqueue_failed_metric_points{exporter="logging",service_instance_id="d234b769-dc8a-4b20-8b2b-9c4f342466fe",service_name="aws-otel-collector",service_version="v0.25.0"} 0
In the above sample output, you can see that the collector is exposing a metric called otelcol_exporter_enqueue_failed_spans showing the number of spans that were failed to get added to the sending queue. This metric is one to watch out to understand if the collector is having issues in sending trace data to the destination configured. In this case, you can see that the exporter label with value awsxray indicating the trace destination in use.
The other metric otelcol_process_runtime_total_sys_memory_bytes is an indicator to understand the amount of memory being used by the collector. If this memory goes too close to the value in otelcol_process_memory_rss metric, that is an indication that the Collector is getting close to exhausting the allocated memory for the process and it might be time for you to take action such as allocating more memory for the collector to avoid issues.
Likewise, you can see that there is another counter metric called otelcol_exporter_enqueue_failed_metric_points that indicates the number of metrics that failed to be sent to the remote destination
Collector health check
There is a liveness probe that the collector exposes in-order for you to check whether the collector is live or not. It is recommended to use that endpoint to periodically check the collector's availability.
The healthcheck extension can be used to have the collector expose the endpoint. See sample configuration below:
extensions:
  health_check:
    endpoint: 0.0.0.0:13133
For the complete configuration options, refer to the GitHub repo here.
❯ curl -v http://localhost:13133
*   Trying 127.0.0.1:13133...
* Connected to localhost (127.0.0.1) port 13133 (#0)
> GET / HTTP/1.1
> Host: localhost:13133
> User-Agent: curl/7.79.1
> Accept: */*
>
* Mark bundle as not supporting multiuse
< HTTP/1.1 200 OK
< Date: Fri, 24 Feb 2023 19:09:22 GMT
< Content-Length: 0
<
* Connection #0 to host localhost left intact
Setting limits to prevent catastrophic failures
Given that resources (CPU, Memory) are finite in any environment, you should set limits to the collector components in-order to avoid failures due to unforeseen situations.
It is particularly important when you are operating the ADOT Collector to collect Prometheus metrics. Take this scenario - You are in the DevOps team and are responsible for deploying and operating the ADOT Collector in an Amazon EKS cluster. Your application teams can simply drop their application Pods at will anytime of the day, and they expect the metrics exposed from their pods to be collected into an Amazon Managed Service for Prometheus workspace.
Now it is your responsibility to ensure that this pipeline works without any hiccups. There are two ways to solve this problem at a high level:
- Scaling the collector infinitely (hence adding Nodes to the cluster if needed) to support this requirement
- Set limits on metric collection and advertise the upper threshold to the application teams
There are pros and cons to both approaches. You can argue that you want to choose option 1, if you are fully committed to supporting your ever growing business needs not considering the costs or the overhead that it might bring in. While supporting the ever growing business needs infinitely might sound like cloud is for infinite scalability point of view, this can bring in a lot of operational overhead and might lead into much more catastrophical situations if not given infinite amount of time, and people resources to ensure continual uninterrupted operations, which in most cases is not practical.
A much more pragmatic and frugal approach would be to choose option 2, where you are setting upper limits (and potentially increasing gradually based on needs progressively) at any given time to ensure the operational boundary is obvious.
Here is an example of how you can do that with using Prometheus receiver in the ADOT Collector.
In Prometheus scrape_config, you can set several limits for any particular scrape job. You could put limits on,
- The total body size of the scrape
- Limit number of labels to accept (the scrape will be discarded if this limit exceeds and you can see that in the Collector logs)
- Limit the number of targets to scrape
- ..more
You can see all available options in the Prometheus documentation.
Limiting Memory usage
The Collector pipeline can be configured to use memorylimiterprocessor to limit the amount of memory the processor component will use. It is common to see customers wanting the Collector to do complex operations that require intense Memory and CPU requirements.
While using processors such as redactionprocessor,filterprocessor,spanprocessor, are exciting and very useful, you should also remember that processors in general deal with data transformation tasks and it requires them to keep data in-memory in-order to complete the tasks. This can lead to a specific processor breaking the Collector entirely and also the Collector not having enough memory to expose its own health metrics.
You can avoid this by limiting the amount of memory the Collector can use by making use of the memorylimiterprocessor.. The recommendation for this is to provide buffer memory for the Collector to make use of for exposing health metrics and perform other tasks so the processors do not take all the allocated memory.
For example, if your EKS Pod has a memory limit of 10Gi, then set the memorylimitprocessor to less than 10Gi, for example 9Gi so the buffer of 1Gi can be used to perform other operations such as exposing health metrics, receiver and exporter tasks.
Backpressure management
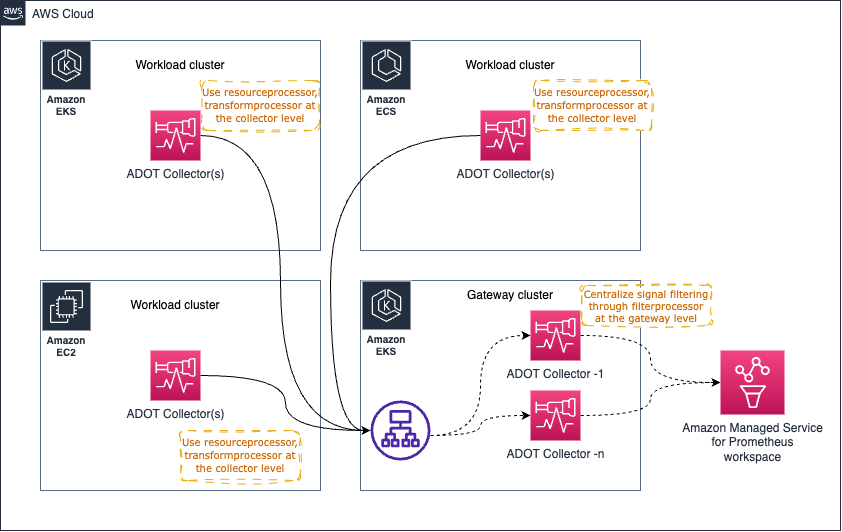
Some architecture patterns (Gateway pattern) such as the one shown below can be used to centralize some operational tasks such as (but not limited to) filtering out sensitive data out of signal data to maintain compliance requirements.
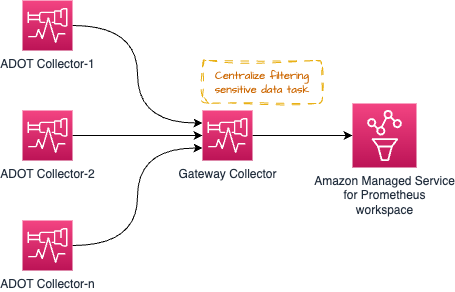
However, it is possible to overwhelm the Gateway Collector with too many such processing tasks that can cause issues. The recommended approach would be is to distribute the process/memory intense tasks between the individual collectors and the gateway so the workload is shared.
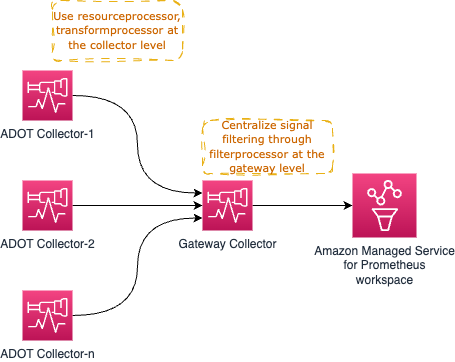
For example, you could use the resourceprocessor to process resource attributes and use the transformprocessor to transform the signal data from within the individual Collectors as soon as the signal collection happens.
Then you could use the filterprocessor to filter out certain parts of the signal data and use the redactionprocessor to redact sensitive information such as Credit Card numbers etc.
The high-level architecture diagram would look like the one below:
As you might have observed already, the Gateway Collector can soon become a single point of failure. One obvious choice there is to spin up more than one Gateway Collector and proxy requests through a load balancer like AWS Application Load Balancer (ALB) as shown below.
Handling out-of-order samples in Prometheus metric collection
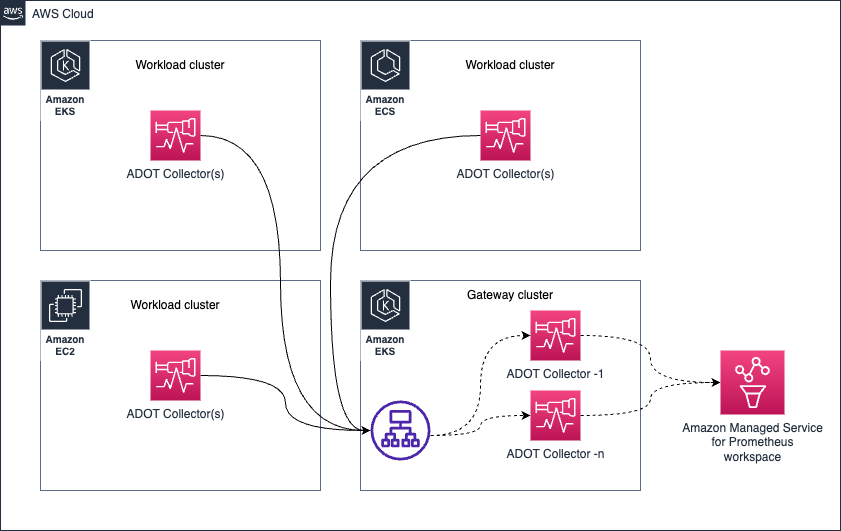
Consider the following scenario in the architecture below:
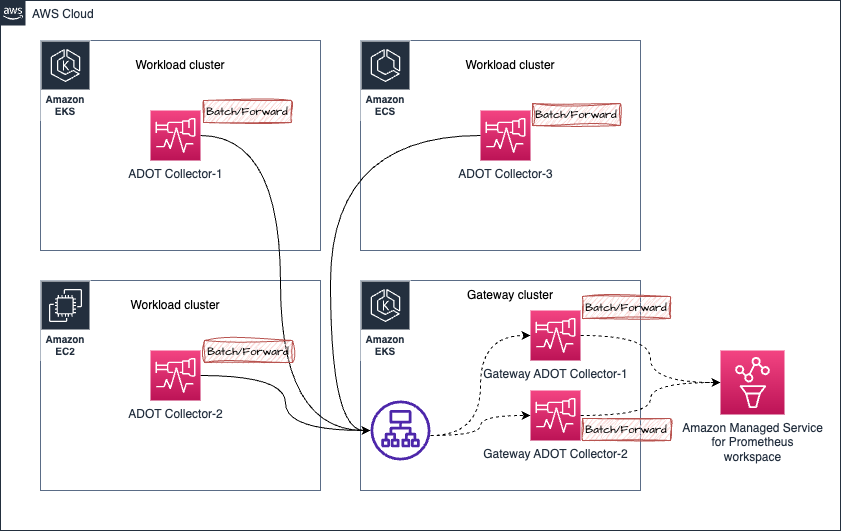
- Assume that metrics from ADOT Collector-1 in the Amazon EKS Cluster are sent to the Gateway cluster, which is being directed to the Gateway ADOT Collector-1
- In a moment, the metrics from the same ADOT Collector-1 (which is collecting the same targets, hence the same metric samples are being dealt with) is being sent to Gateway ADOT Collector-2
- Now if the Gateway ADOT Collector-2 happens to dispatch the metrics to Amazon Managed Service for Prometheus workspace first and then followed by the Gateway ADOT Collector-1 which contains older samples for the same metrics series, you will receive the
out of order sampleerror from Amazon Managed Service for Prometheus.
See example error below:
Error message:
 2023-03-02T21:18:54.447Z        error   exporterhelper/queued_retry.go:394      Exporting failed. The error is not retryable. Dropping data.    {"kind": "exporter", "data_type": "metrics", "name": "prometheusremotewrite", "error": "Permanent error: Permanent error: remote write returned HTTP status 400 Bad Request; err = %!w(<nil>): user=820326043460_ws-5f42c3b6-3268-4737-b215-1371b55a9ef2: err: out of order sample. timestamp=2023-03-02T21:17:59.782Z, series={__name__=\"otelcol_exporter_send_failed_metric_points\", exporter=\"logging\", http_scheme=\"http\", instance=\"10.195.158.91:28888\", ", "dropped_items": 6474}
go.opentelemetry.io/collector/exporter/exporterhelper.(*retrySender).send
        go.opentelemetry.io/collector@v0.66.0/exporter/exporterhelper/queued_retry.go:394
go.opentelemetry.io/collector/exporter/exporterhelper.(*metricsSenderWithObservability).send
        go.opentelemetry.io/collector@v0.66.0/exporter/exporterhelper/metrics.go:135
go.opentelemetry.io/collector/exporter/exporterhelper.(*queuedRetrySender).start.func1
        go.opentelemetry.io/collector@v0.66.0/exporter/exporterhelper/queued_retry.go:205
go.opentelemetry.io/collector/exporter/exporterhelper/internal.(*boundedMemoryQueue).StartConsumers.func1
        go.opentelemetry.io/collector@v0.66.0/exporter/exporterhelper/internal/bounded_memory_queue.go:61
Solving out of order sample error
You can solve the out of order sample error in this particular setup in a couple of ways:
-
Use a sticky load balancer to direct requests from a particular source to go to the same target based on IP address.
Refer to the link here for additional details.
-
As an alternate option, you can add an external label in the Gateway Collectors to distinguish the metric series so Amazon Managed Service for Prometheus considers these metrics are individual metric series and are not from the same.
Using this solution can will result in multiplying the metric series in proportion to the Gateway Collectors in the setup. This is might mean that you can overrun some limits such as Active time series limits
- If you are deploying ADOT Collector as a Daemonset: make sure you are using
relabel_configsto only keep samples from the same node where each ADOT Collector pod is running. Check the links below to learn more.- Advanced Collector Configuration for Amazon Managed Prometheus - Expand the Click to View section, and look for the entried similar to the following:
    relabel_configs:
    - action: keep
regex: $K8S_NODE_NAME - ADOT Add-On Advanced Configuration - Learn how to deploy ADOT Collector using the ADOT Add-On for EKS advanced configurations.
- ADOT Collector deployment strategies - Learn more about the different alternatives to deploy ADOT Collector at scale and the advantages of each approach.
- Advanced Collector Configuration for Amazon Managed Prometheus - Expand the Click to View section, and look for the entried similar to the following:
Open Agent Management Protocol (OpAMP)
OpAMP is a client/server protocol that supports communication over HTTP and over WebSockets. OpAMP is implemented in the OTel Collector and hence the OTel Collector can be used as a server as part of the control plane to manage other agents that support OpAMP, like the OTel Collector itself. The "manage" portion here involves being able to update configurations for collectors, monitoring health or even upgrading the Collectors.
The details of this protocol is well documented in the upstream OpenTelemetry website.
Horizontal Scaling
It may become necessary to horizontally scale an ADOT Collector depending on your workload. The requirement to horizontally scale is entirely dependent on your use case, Collector configuration, and telemetry throughput.
Platform specific horizontal scaling techniques can be applied to a Collector as you would any other application while being cognizant of stateful, stateless, and scraper Collector components.
Most collector components are stateless, meaning that they do not hold state in memory, and if they do it is not relevant for scaling purposes. Additional replicas of stateless Collectors can be scaled behind an
application load balancer.
Stateful Collector components are collector components that retain information in memory which is crucial for the operation of that component.
Examples of stateful components in the ADOT Collector include but are not limited to:
- Tail Sampling Processor - requires all spans for a trace to make an accurate sampling decisions. Avanced sampling scaling techniques is documented on the ADOT developer portal.
- AWS EMF Exporter - performs cummulative to delta conversions on some metric types. This conversion requires the previous metric value to be stored in memory.
- Cummulative to Delta Processor - cummulative to delta conversion requires storing the previous metric value in memory.
Collector components that are scrapers actively obtain telemetry data rather than passively receive it. Currently, the Prometheus receiver is the only scraper
type component in the ADOT Collector. Horizontally scaling a collector configuration that contains a prometheus receiver will require splitting the scraping jobs per collector to ensure
that no two Collectors scrape the same endpoint. Failure to do this may lead to Prometheus out of order sample errors.
The process of and techniques of scaling collectors is documunted in greater detail in the upstream OpenTelemetry website.