CloudWatch डैशबोर्ड
परिचय
AWS accounts में resources की inventory details, resources का performance और health checks जानना स्थिर resource management के लिए महत्वपूर्ण है। Amazon CloudWatch dashboards CloudWatch console में customizable home pages हैं जिनका उपयोग आपके resources को single view में monitor करने के लिए किया जा सकता है, भले ही वे resources cross-account हों या विभिन्न regions में फैले हों।
Amazon CloudWatch dashboards ग्राहकों को reusable graphs बनाने और cloud resources और applications को unified view में visualize करने में सक्षम बनाते हैं। CloudWatch dashboards के माध्यम से ग्राहक metrics और logs data को unified view में side by side graph कर सकते हैं ताकि quickly context प्राप्त किया जा सके और problem diagnose करने से root cause समझने और mean time to recover or resolve (MTTR) कम करने तक पहुंचा जा सके। उदाहरण के लिए, ग्राहक CPU utilization और memory जैसी key metrics के current utilization को visualize कर सकते हैं और उनकी तुलना allocated capacity से कर सकते हैं। ग्राहक किसी specific metric के log pattern को correlate भी कर सकते हैं और performance और operational issues पर alert करने के लिए alarms set कर सकते हैं। CloudWatch dashboard alarms की current status display करने में भी मदद करता है ताकि quickly visualize किया जा सके और action के लिए ध्यान आकर्षित किया जा सके। CloudWatch dashboards की sharing ग्राहकों को teams और stakeholders के साथ जो organizations के internal या external हैं, displayed dashboard information आसानी से share करने की अनुमति देती है।
Widgets
Default Widgets
Widgets CloudWatch dashboards के building blocks बनाते हैं जो AWS environment में resources और application metrics और logs की important information और near real time details display करते हैं। ग्राहक अपनी आवश्यकताओं के अनुसार widgets add, remove, rearrange, या resize करके dashboards को अपने desired experience के अनुसार customize कर सकते हैं।
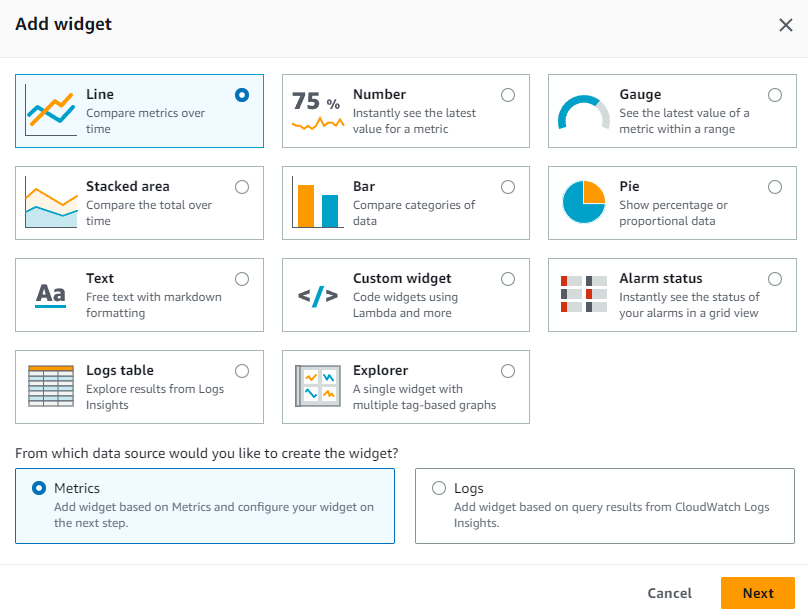
आप अपने dashboard में जो types of graphs जोड़ सकते हैं उनमें Line, Number, Gauge, Stacked area, Bar और Pie शामिल हैं।
Line, Number, Gauge, Stacked area, Bar, Pie जैसे Graph type के default widget types और Text, Alarm Status, Logs table, Explorer जैसे अन्य widgets भी ग्राहकों के लिए dashboards build करने के लिए Metrics या Logs data जोड़ने हेतु उपलब्ध हैं।
अतिरिक्त संदर्भ:
- AWS Observability Workshop पर Metric Number Widgets
- AWS Observability Workshop पर Text Widgets
- AWS Observability Workshop पर Alarm Widgets
- CloudWatch dashboards पर widgets बनाना और उनके साथ काम करना पर Documentation
Custom Widgets
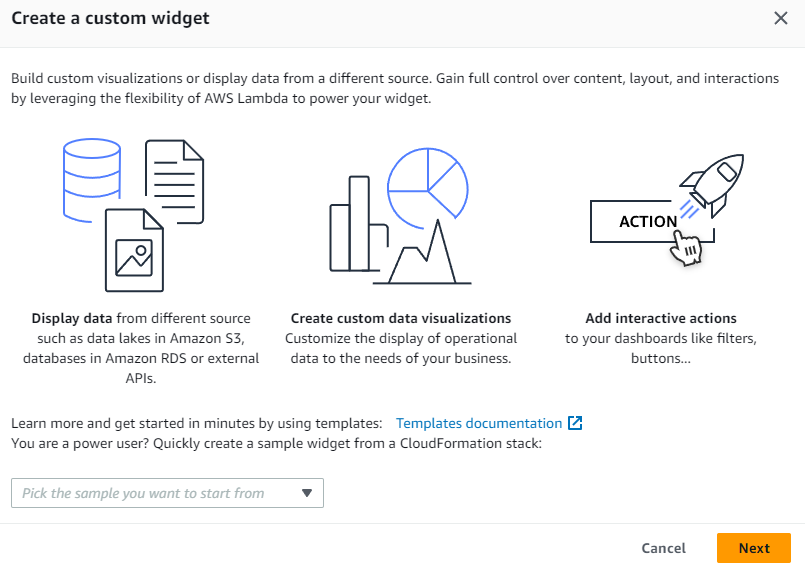
ग्राहक CloudWatch dashboards में custom widget जोड़ना भी चुन सकते हैं ताकि custom visualizations experience करें, कई sources से information display करें या CloudWatch Dashboard में directly actions लेने के लिए buttons जैसे custom controls जोड़ें। Custom Widgets पूरी तरह से serverless हैं जो Lambda functions द्वारा powered हैं, जिससे content, layout और interactions पर complete control मिलता है। Custom Widget dashboard पर custom data view या tool build करने का एक आसान तरीका है जिसमें complex web framework सीखने की आवश्यकता नहीं है। यदि आप Lambda में code लिख सकते हैं और HTML बना सकते हैं तो आप एक useful custom widget बना सकते हैं।
अतिरिक्त संदर्भ:
- AWS Observability Workshop पर custom widgets
- GitHub पर CloudWatch Custom Widgets Samples
- Blog: Using Amazon CloudWatch dashboards custom widgets
Automatic Dashboards
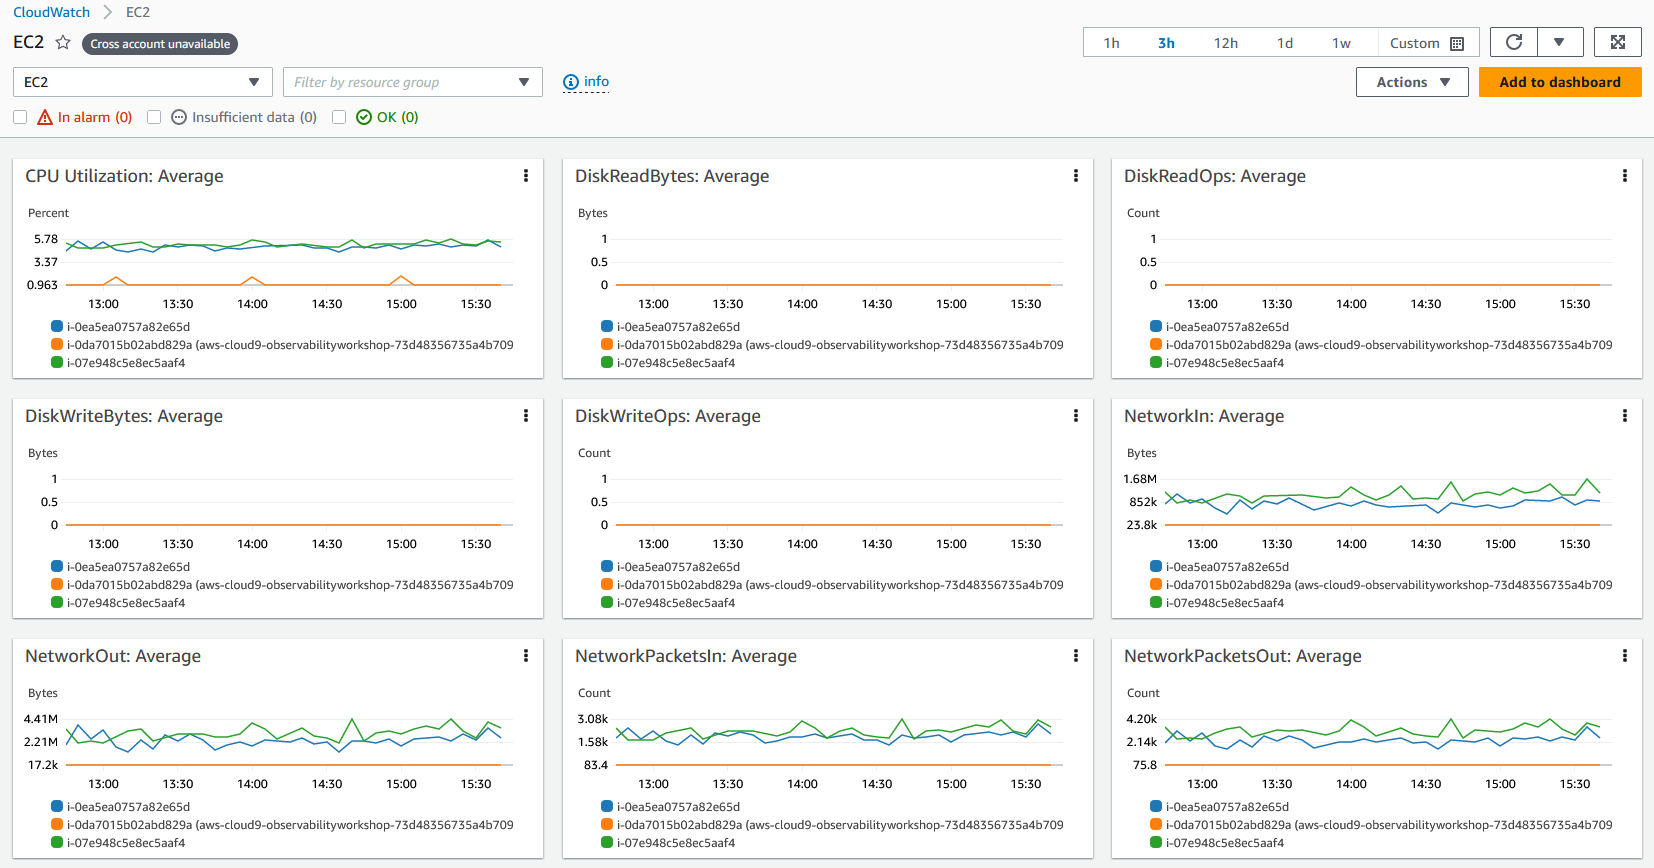
Automatic Dashboards सभी AWS public regions में उपलब्ध हैं जो Amazon CloudWatch के तहत सभी AWS resources के health और performance का aggregated view प्रदान करते हैं। यह ग्राहकों को monitoring के साथ quickly get started करने, metrics और alarms का resource-based view प्राप्त करने, और performance issues के root cause को समझने के लिए आसानी से drill-down करने में मदद करता है। Automatic Dashboards AWS service recommended बेस्ट प्रैक्टिसेज़ के साथ pre-built हैं, resource aware रहते हैं, और important performance metrics की latest state reflect करने के लिए dynamically update होते हैं। Automatic service dashboards किसी service के लिए सभी standard CloudWatch metrics display करते हैं, प्रत्येक service metric के लिए उपयोग किए गए सभी resources graph करते हैं और accounts में outlier resources quickly identify करने में मदद करते हैं जो high या low utilization वाले resources identify करने में मदद कर सकते हैं, जिससे costs optimize करने में मदद मिल सकती है।
अतिरिक्त संदर्भ:
- AWS Observability Workshop पर Automatic dashboards
- YouTube पर Monitor AWS Resources Using Amazon CloudWatch Dashboards
Automatic dashboards में Container Insights
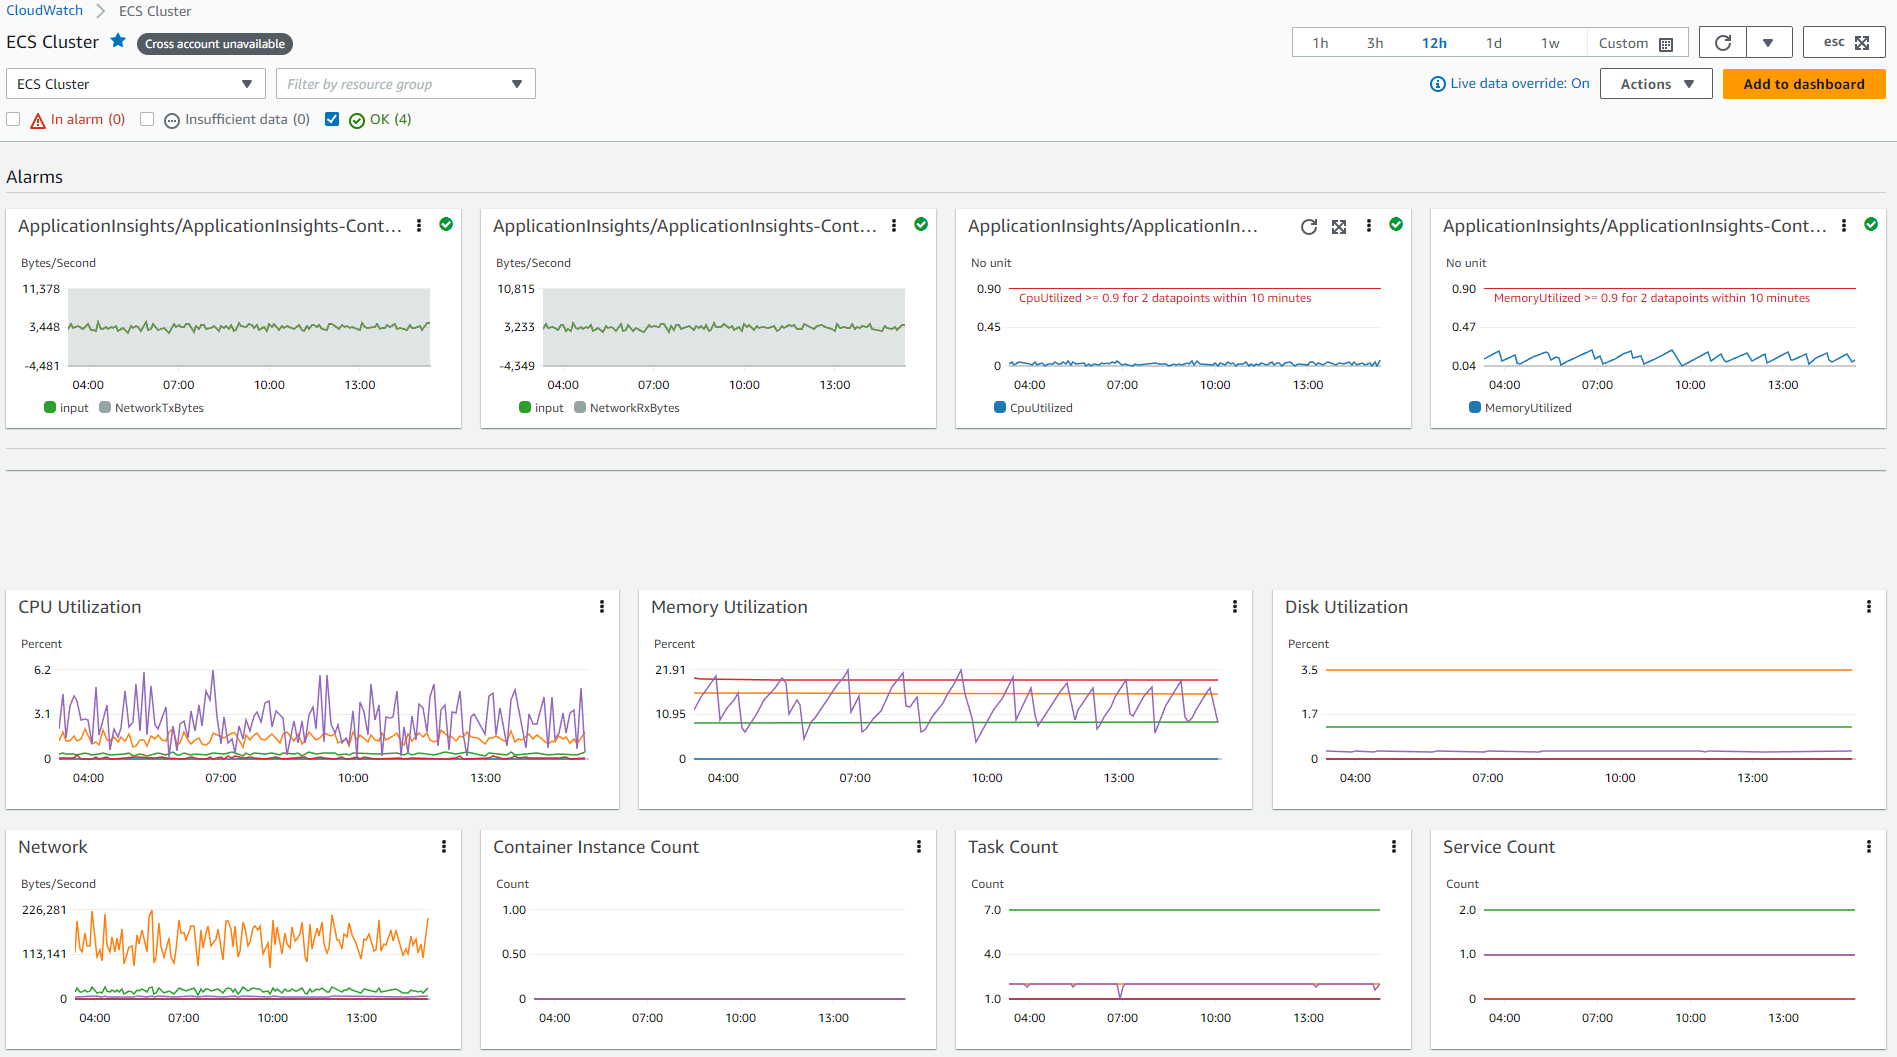
CloudWatch Container Insights containerized applications और microservices से metrics और logs collect, aggregate, और summarize करता है। Container Insights Amazon Elastic Container Service (Amazon ECS), Amazon Elastic Kubernetes Service (Amazon EKS), और Amazon EC2 पर Kubernetes platforms के लिए उपलब्ध है। Container Insights Amazon ECS और Amazon EKS दोनों के लिए Fargate पर deployed clusters से metrics collect करने को support करता है। CloudWatch CPU, memory, disk, और network जैसे कई resources के लिए स्वचालित रूप से metrics collect करता है और container restart failures जैसी diagnostic information भी प्रदान करता है, जिससे issues isolate करने और उन्हें quickly resolve करने में मदद मिलती है।
CloudWatch embedded metric format का उपयोग करके cluster, node, pod, task, और service level पर CloudWatch metrics के रूप में aggregated metrics बनाता है, जो performance log events हैं जो structured JSON schema का उपयोग करते हैं जो high-cardinality data को scale पर ingest और store करने में सक्षम बनाता है। Container Insights द्वारा collect की जाने वाली metrics CloudWatch automatic dashboards में उपलब्ध हैं, और CloudWatch console के Metrics section में भी viewable हैं।
Automatic dashboards में Lambda Insights
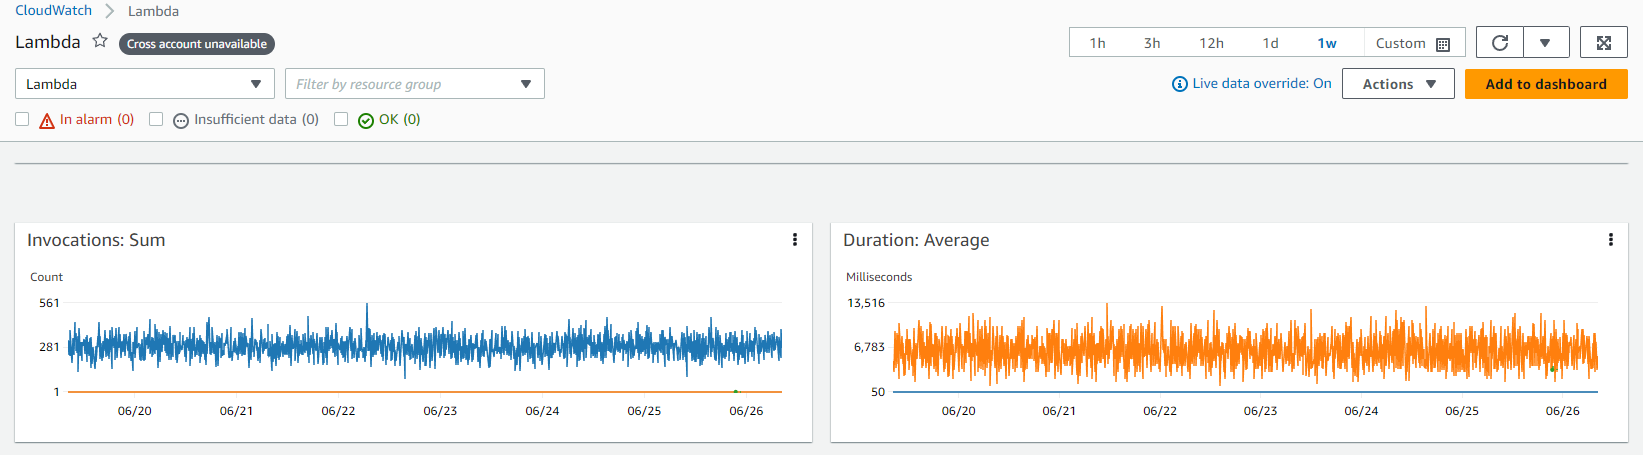
CloudWatch Lambda Insights AWS Lambda जैसे serverless applications के लिए एक monitoring और troubleshooting solution है, जो Lambda functions के लिए dynamic, automatic dashboards बनाता है। यह system-level metrics भी collect, aggregate और summarize करता है, जिसमें CPU time, memory, disk, और network और diagnostic information जैसे cold starts और Lambda worker shutdowns शामिल हैं जो Lambda functions के साथ issues isolate करने और quickly resolve करने में मदद करती हैं। Lambda Insights function level पर layer के रूप में प्रदान किया गया Lambda extension है जो enable होने पर log events से metrics extract करने के लिए embedded metric format का उपयोग करता है और किसी agents की आवश्यकता नहीं होती।
Custom Dashboards
ग्राहक जितने चाहें अतिरिक्त Custom Dashboards विभिन्न widgets के साथ भी बना सकते हैं और उसके अनुसार customize कर सकते हैं। Dashboards को cross-region और cross account view के लिए configure किया जा सकता है और favorites list में जोड़ा जा सकता है।
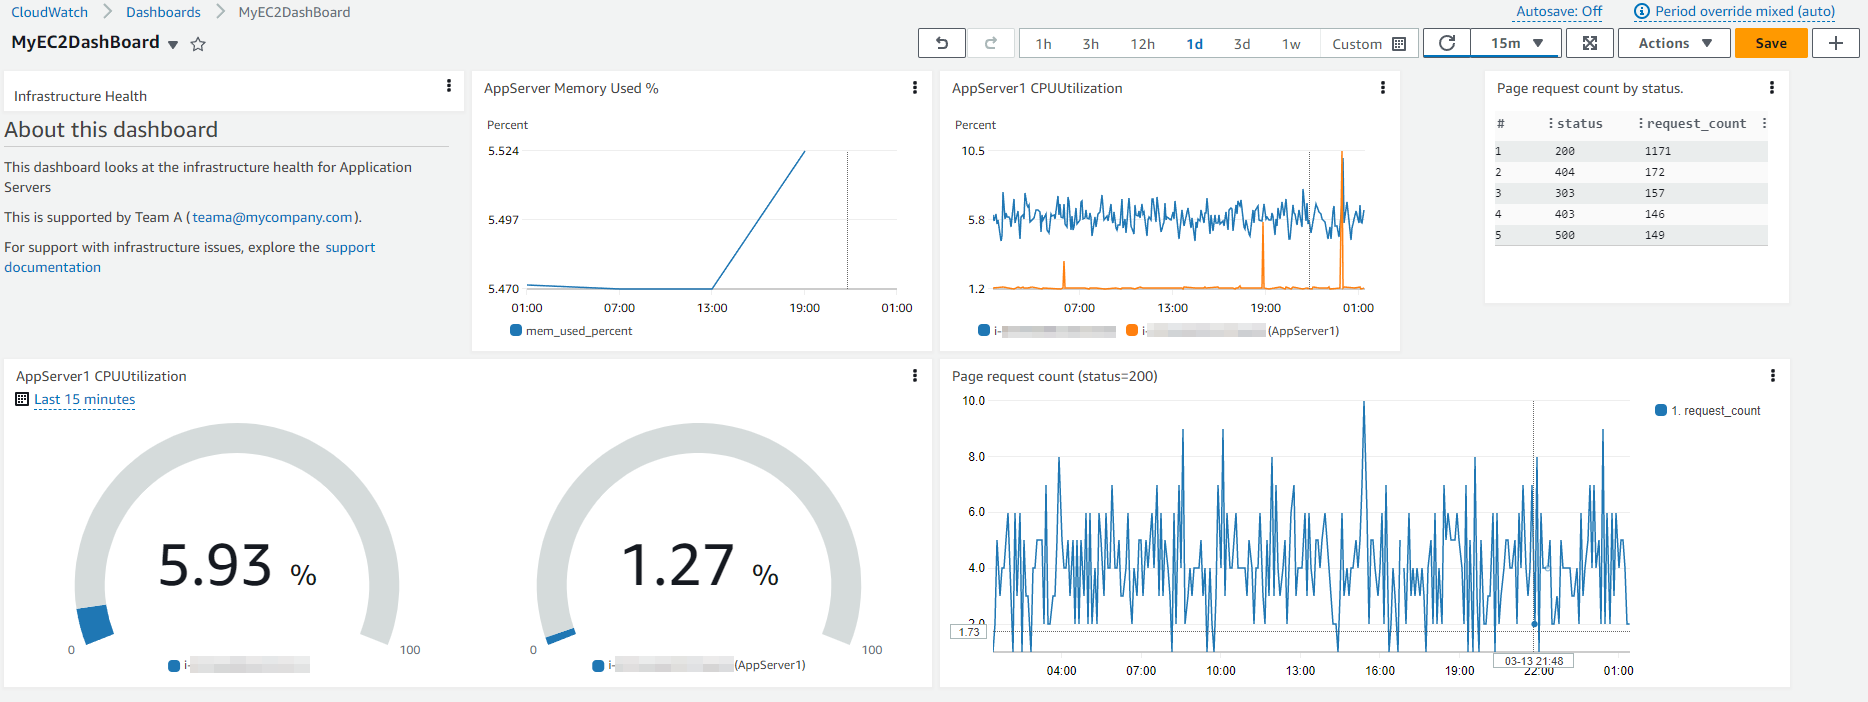
ग्राहक CloudWatch console में automatic या custom dashboards को favorite list में जोड़ सकते हैं ताकि console page में navigation pane से उन्हें quick और easy access मिल सके।
अतिरिक्त संदर्भ:
- AWS Observability Workshop पर CloudWatch dashboard
- CloudWatch Dashboards के साथ monitoring पर Performance Efficiency के लिए AWS Well-Architected Labs
CloudWatch dashboards में Contributor Insights जोड़ना
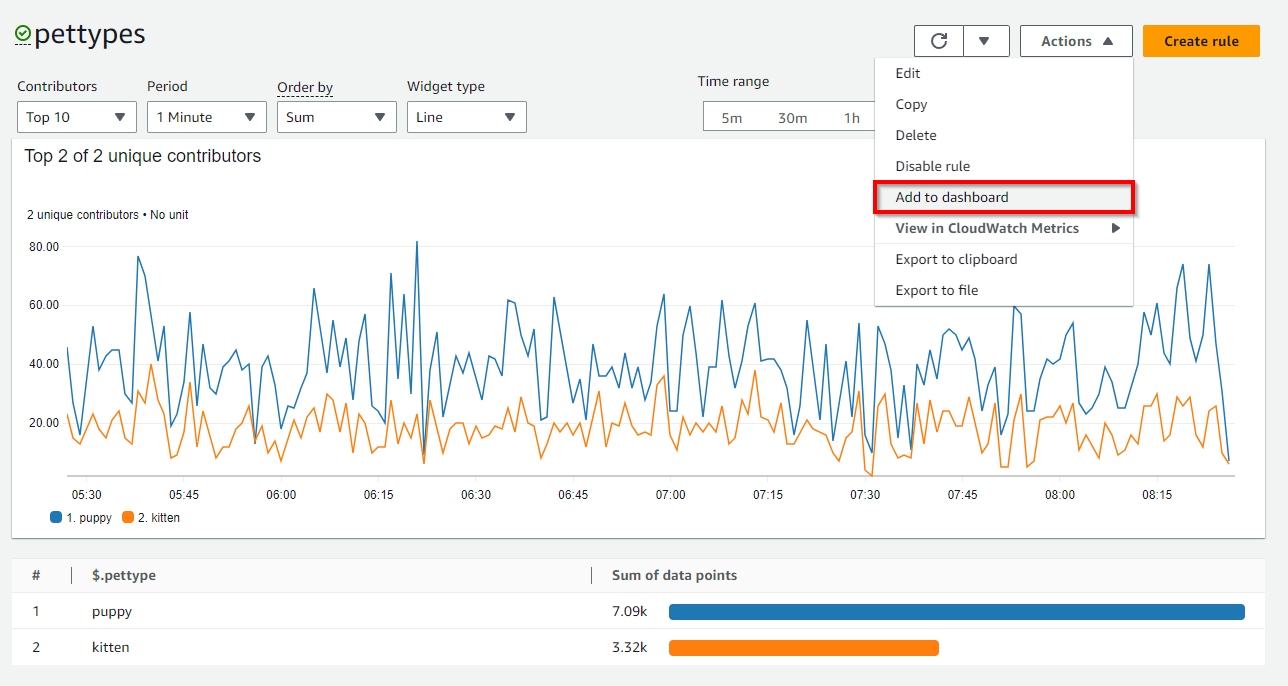
CloudWatch Contributor Insights log data analyze करने और contributor data display करने वाली time series बनाने की सुविधा प्रदान करता है, जहां आप top-N contributors, unique contributors की कुल संख्या, और उनके usage के बारे में metrics देख सकते हैं। इससे आपको top talkers खोजने और यह समझने में मदद मिलती है कि कौन या क्या system performance को प्रभावित कर रहा है। उदाहरण के लिए, ग्राहक bad hosts खोज सकते हैं, heaviest network users identify कर सकते हैं, या सबसे अधिक errors generate करने वाले URLs ढूंढ सकते हैं।
Contributor Insights reports को CloudWatch console में किसी भी new या existing Dashboards में जोड़ा जा सकता है।
CloudWatch dashboards में Application Insights जोड़ना
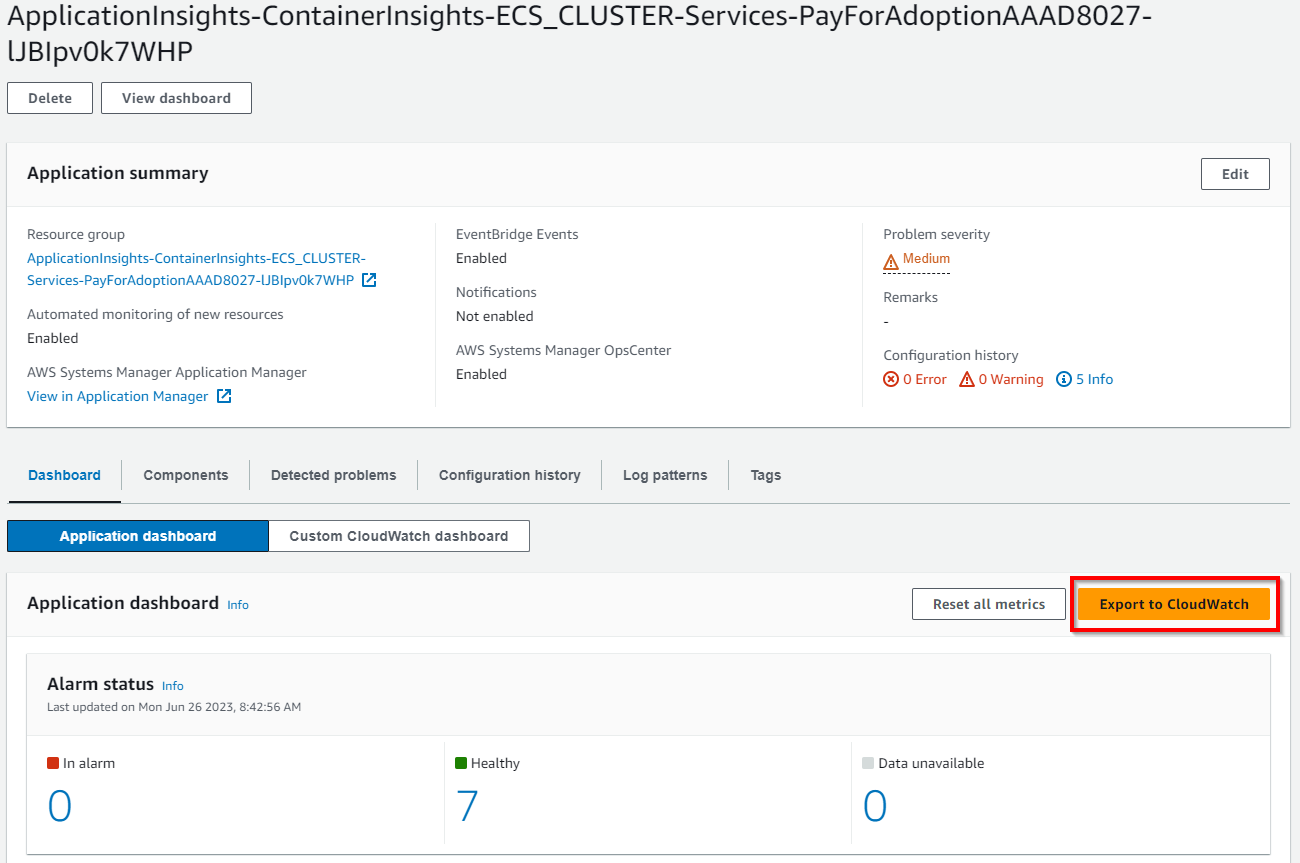
CloudWatch Application Insights AWS पर hosted applications और उनके underlying AWS resources के लिए ऑब्ज़र्वेबिलिटी facilitate करता है जो applications के health में enhanced visibility प्रदान करता है और application issues troubleshoot करने के लिए mean time to repair (MTTR) कम करने में मदद करता है। Application Insights automated dashboards प्रदान करता है जो monitored applications के साथ potential problems दिखाते हैं, जो ग्राहकों को applications और infrastructure के साथ ongoing issues quickly isolate करने में मदद करते हैं।
Application Insights के अंदर 'Export to CloudWatch' option जैसा नीचे दिखाया गया है, CloudWatch console में एक dashboard जोड़ता है जो ग्राहकों को insights के लिए अपने critical application को आसानी से monitor करने में मदद करता है।
CloudWatch dashboards में Service Map जोड़ना
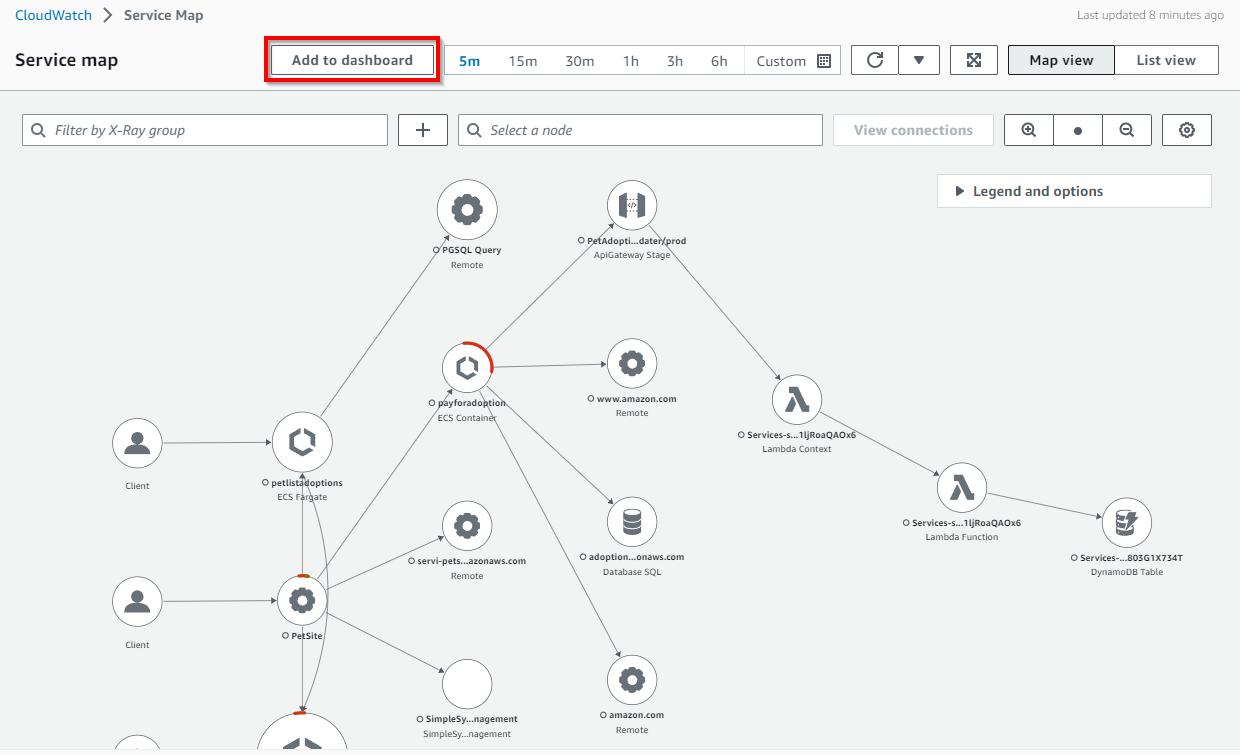
CloudWatch ServiceLens traces, metrics, logs, alarms, और अन्य resource health information को एक स्थान पर integrate करके services और applications की ऑब्ज़र्वेबिलिटी enhance करता है। ServiceLens CloudWatch को AWS X-Ray के साथ integrate करता है ताकि application का end-to-end view प्रदान किया जा सके जो ग्राहकों को performance bottlenecks अधिक efficiently pinpoint करने और impacted users identify करने में मदद करता है। एक service map service endpoints और resources को nodes के रूप में display करता है और प्रत्येक node और उसके connections के लिए traffic, latency, और errors highlight करता है। प्रत्येक displayed node उस service के हिस्से से जुड़ी correlated metrics, logs, और traces के बारे में detailed insights प्रदान करता है।
Service Map के अंदर 'Add to dashboard' option जैसा नीचे दिखाया गया है, CloudWatch console में एक new dashboard या existing dashboard में जोड़ता है जो ग्राहकों को insights के लिए अपने application को आसानी से trace करने में मदद करता है।
CloudWatch dashboards में Metrics Explorer जोड़ना
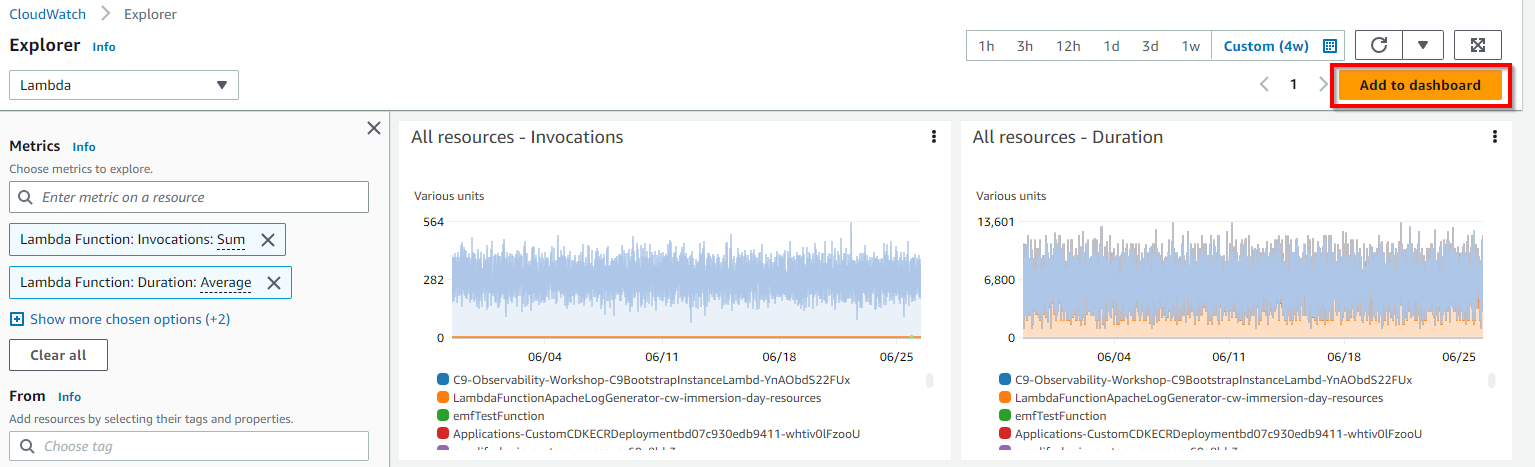
CloudWatch में Metrics explorer एक tag-based tool है जो ग्राहकों को AWS services के लिए ऑब्ज़र्वेबिलिटी enhance करने हेतु tags और resource properties द्वारा metrics filter, aggregate और visualize करने में सक्षम बनाता है। Metrics explorer flexible और dynamic troubleshooting experience देता है, ताकि ग्राहक एक बार में multiple graphs बना सकें और इन graphs का उपयोग application health dashboards build करने के लिए कर सकें। Metrics explorer visualizations dynamic हैं, इसलिए यदि metrics explorer widget बनाने और CloudWatch dashboard में जोड़ने के बाद कोई matching resource बनाया जाता है, तो new resource स्वचालित रूप से explorer widget में दिखाई देता है।
Metrics Explorer के अंदर 'Add to dashboard' option जैसा नीचे दिखाया गया है, CloudWatch console में एक new dashboard या existing dashboard में जोड़ता है जो ग्राहकों को अपने AWS Services और resources में अधिक graph insights आसानी से प्राप्त करने में मदद करता है।
CloudWatch dashboards का उपयोग करके क्या visualize करें
ग्राहक regions और accounts में workloads और applications monitor करने के लिए account और application-level पर dashboards बना सकते हैं। ग्राहक CloudWatch automatic dashboards के साथ quickly get started कर सकते हैं, जो service-specific metrics के साथ preconfigured AWS service-level dashboards हैं। application और workload-specific dashboards बनाने की अनुशंसा की जाती है जो आपके production environment में application या workload के लिए relevant और critical key metrics और resources पर focus करें।
Metrics data visualize करना
Metrics data को Line, Number, Gauge, Stacked area, Bar, Pie जैसे Graph widgets के माध्यम से CloudWatch dashboards में जोड़ा जा सकता है, जो Average, Minimum, Maximum, Sum, और SampleCount के माध्यम से metrics पर statistics द्वारा supported हैं। Statistics specified periods of time पर metric data aggregations हैं।
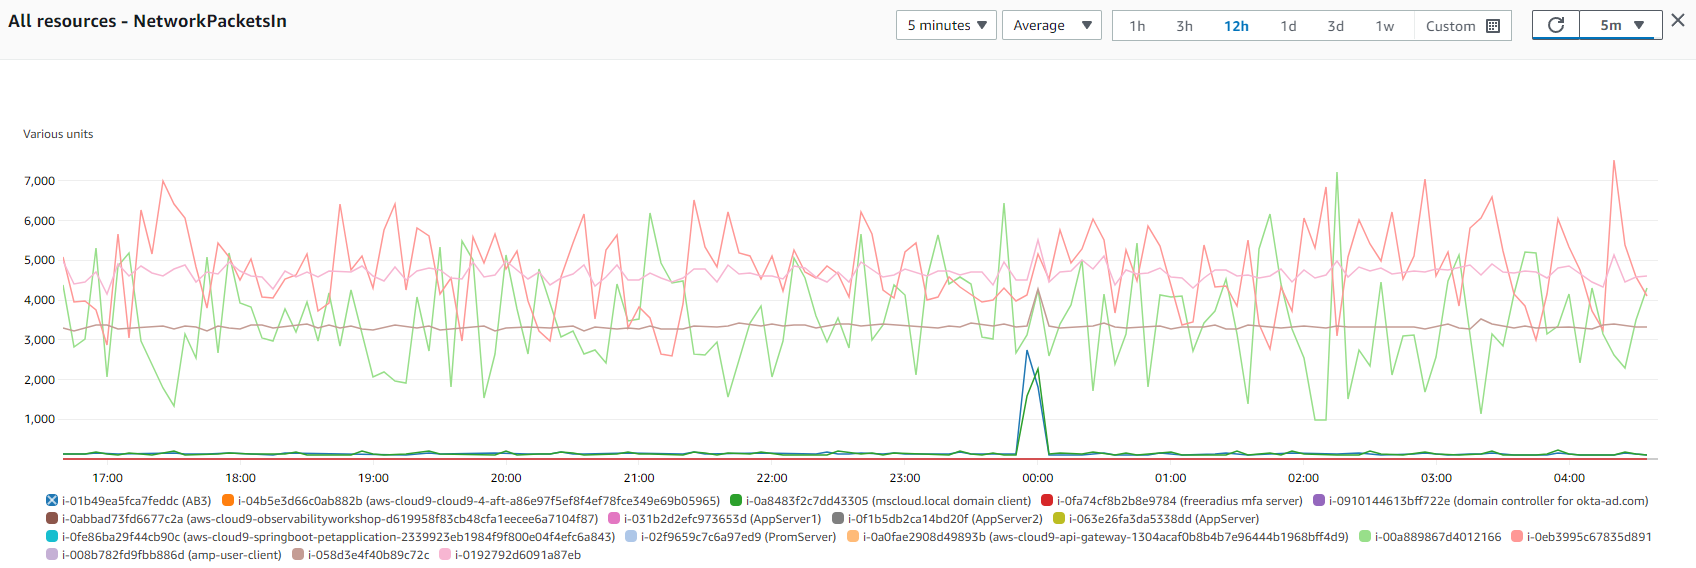
Metric math multiple CloudWatch metrics query करने और इन metrics पर आधारित new time series बनाने के लिए math expressions उपयोग करने को enable करता है। ग्राहक resulting time series को CloudWatch console पर visualize कर सकते हैं और उन्हें dashboards में जोड़ सकते हैं। ग्राहक GetMetricDataAPI operation का उपयोग करके programmatically भी metric math perform कर सकते हैं।
अतिरिक्त संदर्भ:
Logs data visualize करना
ग्राहक CloudWatch dashboards में bar charts, line charts, और stacked area charts का उपयोग करके logs data के visualizations achieve कर सकते हैं ताकि patterns अधिक efficiently identify किए जा सकें। CloudWatch Logs Insights उन queries के लिए visualizations generate करता है जो stats function और एक या अधिक aggregation functions उपयोग करते हैं जो bar charts produce कर सकते हैं। यदि query bin() function उपयोग करती है data group करने के लिए एक field द्वारा over time, तो visualization के लिए line charts और stacked area charts उपयोग किए जा सकते हैं।
Time series data की characteristics का उपयोग करके visualize किया जा सकता है यदि query में एक या अधिक aggregation of status functions हों या यदि query bin() function उपयोग करती है data group करने के लिए एक field द्वारा।
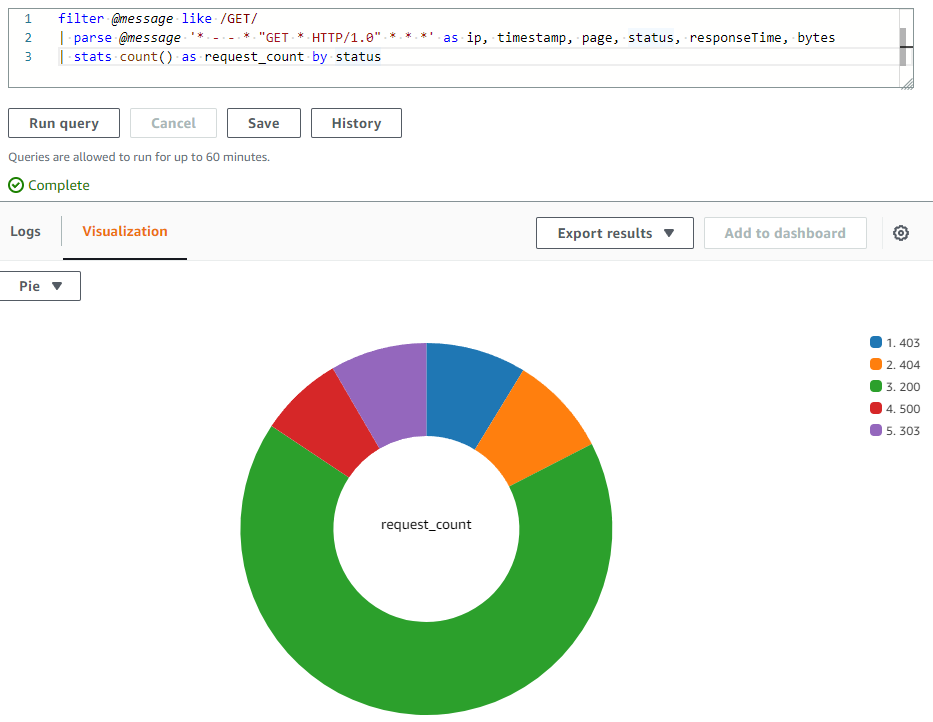
count() stats function के साथ एक sample query नीचे दिखाई गई है
filter @message like /GET/
| parse @message '_ - - _ "GET _ HTTP/1.0" .*.*.*' as ip, timestamp, page, status, responseTime, bytes
| stats count() as request_count by status
ऊपर दी गई query के लिए, results CloudWatch Logs Insights में नीचे दिखाए गए हैं।
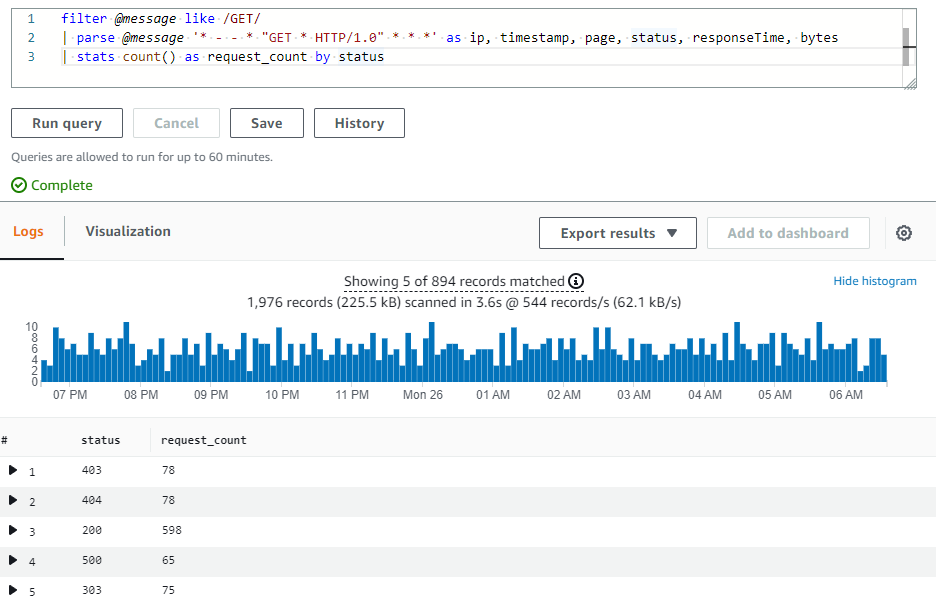
query results का pie chart के रूप में visualization नीचे दिखाया गया है।
अतिरिक्त संदर्भ:
- CloudWatch dashboard में log results display करना पर AWS Observability Workshop।
- Amazon CloudWatch dashboard के साथ AWS WAF logs Visualize करें
Alarms visualize करना
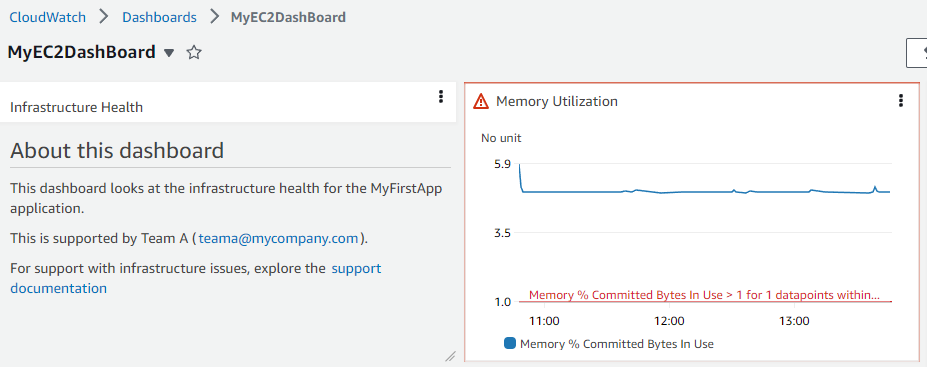
CloudWatch में Metric alarm एक single metric या CloudWatch metrics पर आधारित math expression के result को watch करता है। alarm एक time period में threshold के relative metric या expression की value के आधार पर एक या अधिक actions perform करता है। CloudWatch dashboards में एक widget में single alarm जोड़ा जा सकता है, जो alarm की metric का graph display करता है और alarm status भी display करता है। साथ ही, एक alarm status widget CloudWatch dashboard में जोड़ा जा सकता है जो grid में multiple alarms की status display करता है। केवल alarm names और current status display होती हैं, Graphs display नहीं होते।
CloudWatch dashboard के अंदर alarm widget में capture किया गया sample metric alarm status नीचे दिखाया गया है।
Cross-account और Cross-region
कई AWS accounts रखने वाले ग्राहक CloudWatch cross-account ऑब्ज़र्वेबिलिटी set up कर सकते हैं और फिर central monitoring accounts में rich cross-account dashboards बना सकते हैं, जिसके माध्यम से वे account boundaries के बिना seamlessly metrics, logs, और traces search, visualize, और analyze कर सकते हैं।
ग्राहक cross-account cross-region dashboards भी बना सकते हैं, जो कई AWS accounts और कई regions से CloudWatch data को एक single dashboard में summarize करते हैं। इस high-level dashboard से ग्राहक पूरे application का unified view प्राप्त कर सकते हैं, और accounts से sign in और out या regions switch किए बिना अधिक specific dashboards में drill down भी कर सकते हैं।
अतिरिक्त संदर्भ:
- Central Amazon CloudWatch dashboard में new cross-account Amazon EC2 instances auto add कैसे करें
- Multi-Account Amazon CloudWatch Dashboards Deploy करें
- YouTube पर Cross Account और Cross Region CloudWatch Dashboards बनाएं
Dashboards share करना
CloudWatch dashboards को teams के लोगों, stakeholders और आपके organization के बाहर के लोगों के साथ share किया जा सकता है जिनके पास आपके AWS account तक direct access नहीं है। ये shared dashboards team areas, monitoring या network operations centers (NOC) में big screens पर display किए जा सकते हैं या Wikis या public webpages में embed किए जा सकते हैं।
Dashboards share करने के तीन तरीके हैं जो इसे आसान और secure बनाते हैं।
- dashboard publicly share किया जा सकता है ताकि link रखने वाला कोई भी dashboard देख सके।
- dashboard specific email addresses के लोगों के साथ share किया जा सकता है जो dashboard देख सकते हैं। इनमें से प्रत्येक user dashboard देखने के लिए अपना password बनाता है।
- dashboards AWS accounts के भीतर single sign-on (SSO) provider के माध्यम से access के साथ share किए जा सकते हैं।
Dashboards publicly share करते समय ध्यान देने योग्य बातें
CloudWatch dashboards को publicly share करने की अनुशंसा नहीं की जाती यदि dashboard में कोई sensitive या confidential information हो। जब भी संभव हो, dashboards share करते समय username/password या single sign-on (SSO) के माध्यम से authentication का उपयोग करने की अनुशंसा की जाती है।
जब dashboards publicly accessible बनाए जाते हैं, CloudWatch dashboard host करने वाले एक web page का link generate करता है। web page देखने वाला कोई भी publicly shared dashboard की contents देख सकेगा। web page link के माध्यम से temporary credentials प्रदान करता है APIs call करने के लिए alarms और contributor insights rules query करने के लिए Dashboard में जो आप share करते हैं, और आपके account में सभी metrics और सभी EC2 instances के names और tags के लिए भले ही वे Dashboard में नहीं दिखाए गए हों। हम अनुशंसा करते हैं कि आप विचार करें कि क्या यह information publicly available करना उचित है।
कृपया ध्यान दें कि जब आप dashboards publicly share करना enable करते हैं, तो आपके account में निम्नलिखित Amazon Cognito resources बनाए जाएंगे: Cognito user pool; Cognito app client; Cognito Identity pool और IAM role।
Credentials (Username और password protected dashboard) का उपयोग करके dashboards share करते समय ध्यान देने योग्य बातें
CloudWatch dashboards share करने की अनुशंसा नहीं की जाती यदि dashboard में कोई sensitive या confidential information हो जो आप उन users के साथ share नहीं करना चाहेंगे जिनके साथ आप dashboard share कर रहे हैं।
जब dashboards share करने के लिए enable किए जाते हैं, CloudWatch dashboard host करने वाले एक web page का link generate करता है। ऊपर specify किए गए users को निम्नलिखित permissions grant किए जाएंगे: Dashboard में alarms और contributor insights rules के लिए CloudWatch read-only permissions जो आप share करते हैं, और आपके account में सभी metrics और सभी EC2 instances के names और tags के लिए भले ही वे Dashboard में नहीं दिखाए गए हों। हम अनुशंसा करते हैं कि आप विचार करें कि क्या यह information उन users को available करना उचित है जिनके साथ आप share कर रहे हैं।
कृपया ध्यान दें कि जब आप specify किए गए users के लिए web page access हेतु dashboards share करना enable करते हैं, तो आपके account में निम्नलिखित Amazon Cognito resources बनाए जाएंगे: Cognito user pool; Cognito users; Cognito app client; Cognito Identity pool और IAM role।
SSO Provider का उपयोग करके dashboards share करते समय ध्यान देने योग्य बातें
जब CloudWatch dashboards Single Sign-on (SSO) का उपयोग करके share किए जाते हैं, तो selected SSO provider के साथ registered users को उस account में सभी dashboards access करने की permissions grant की जाएंगी जहां यह share किया गया है। साथ ही, जब इस method में dashboards की sharing disable की जाती है, तो सभी dashboards स्वचालित रूप से unshare हो जाते हैं।
अतिरिक्त संदर्भ:
- AWS Observability Workshop पर dashboards share करना
- Blog: AWS Single Sign-On का उपयोग करके किसी के साथ भी अपने Amazon CloudWatch Dashboards share करें
- Blog: Amazon CloudWatch dashboards share करके monitoring information communicate करें
Live data
CloudWatch dashboards metric widgets के माध्यम से live data भी display करते हैं यदि आपके workloads से metrics constantly publish हो रही हैं। ग्राहक पूरे dashboard के लिए या dashboard पर individual widgets के लिए live data enable करना चुन सकते हैं।
यदि live data off है, तो केवल past में कम से कम एक minute की aggregation period वाले data points दिखाए जाते हैं। उदाहरण के लिए, 5-minute periods उपयोग करते समय, 12:35 का data point 12:35 से 12:40 तक aggregate होगा, और 12:41 पर display होगा।
यदि live data on है, तो most recent data point दिखाया जाता है जैसे ही corresponding aggregation interval में कोई data publish होता है। हर बार जब आप display refresh करते हैं, तो most recent data point बदल सकता है क्योंकि उस aggregation period में new data publish होता है।
Animated Dashboard
Animated dashboard over time capture किए गए CloudWatch metric data को replay करता है, जो ग्राहकों को trends देखने, presentations करने, या issues occur होने के बाद analyze करने में मदद करता है। Dashboard में animated widgets में line widgets, stacked area widgets, number widgets, और metrics explorer widgets शामिल हैं। Pie graphs, bar charts, text widgets, और logs widgets dashboard में display होते हैं लेकिन animated नहीं होते।
CloudWatch Dashboard के लिए API/CLI support
AWS Management Console के माध्यम से CloudWatch dashboard access करने के अलावा ग्राहक API, AWS command-line interface (CLI) और AWS SDKs के माध्यम से भी service access कर सकते हैं। dashboards के लिए CloudWatch API AWS CLI के माध्यम से automating या software/products के साथ integrating में मदद करता है ताकि आप resources और applications manage या administer करने में कम समय लगा सकें।
- ListDashboards: आपके account के dashboards की list return करता है
- GetDashboard: आपके specify किए गए dashboard की details display करता है।
- DeleteDashboards: आपके specify किए गए सभी dashboards delete करता है।
- PutDashboard: यदि dashboard पहले से exist नहीं करता तो बनाता है, या existing dashboard update करता है। यदि आप dashboard update करते हैं, तो पूरी contents आपके यहां specify किए गए से replace हो जाती हैं।
Dashboard Body Structure and Syntax के लिए CloudWatch API Reference
AWS Command Line Interface (AWS CLI) एक open source tool है जो ग्राहकों को command-line shell में commands का उपयोग करके AWS services के साथ interact करने में सक्षम बनाता है, जो browser-based AWS Management Console द्वारा terminal program में command prompt से प्रदान की जाने वाली functionality के equivalent functionality implement करता है।
CLI Support:
अतिरिक्त संदर्भ: AWS Observability Workshop पर CloudWatch dashboards और AWS CLI
CloudWatch Dashboard का Automation
CloudWatch dashboards के creation को automate करने के लिए, ग्राहक CloudFormation या Terraform जैसे Infrastructure as a Code (IaaC) tools का उपयोग कर सकते हैं जो AWS resources set up करने में मदद करते हैं ताकि ग्राहक उन resources manage करने में कम समय लगाएं और AWS में चलने वाले applications पर अधिक focus कर सकें।
AWS CloudFormation templates के माध्यम से dashboards बनाने को support करता है। AWS::CloudWatch::Dashboard resource एक Amazon CloudWatch dashboard specify करता है।
Terraform में भी modules हैं जो IaaC automation के माध्यम से CloudWatch dashboards बनाने को support करते हैं।
Desired widgets का उपयोग करके manually dashboards बनाना straight forward है। हालांकि, यदि content dynamic information पर आधारित है, जैसे Auto Scaling group में scale-out और scale-in events के दौरान बनाए या remove किए गए EC2 instances, तो resource sources update करने में कुछ effort लग सकता है। कृपया blog post देखें यदि आप Amazon EventBridge और AWS Lambda का उपयोग करके अपने Amazon CloudWatch dashboards automatically create और update करना चाहते हैं।
अतिरिक्त संदर्भ Blogs:
- Amazon EBS volume KPIs के लिए Amazon CloudWatch dashboard creation Automate करना
- AWS Systems Manager और Ansible के साथ Amazon CloudWatch alarms और dashboards का creation Automate करें
- AWS CDK का उपयोग करके AWS Outposts के लिए automated Amazon CloudWatch dashboard Deploy करना
CloudWatch dashboard पर Product FAQs