AWS WAF Security Analysis with CloudWatch
AWS WAF generates detailed JSON logs for every web request evaluated by a web ACL. When you send these logs to Amazon CloudWatch Logs, you unlock three complementary analysis capabilities: CloudWatch Logs Insights for ad-hoc investigation, metric filters for near-real-time alerting, and Contributor Insights for continuous top-N threat identification. Together, these capabilities form a complete security operations workflow for detecting, investigating, and responding to web application threats.
This guide covers best practices for configuring WAF logging to CloudWatch Logs, building effective security queries, creating metric filters and alarms for automated threat detection, and using Contributor Insights rules to continuously identify your top unauthorized actors and most-targeted endpoints.
Setup WAF Logging for CloudWatch
WAF log groups must be prefixed with aws-waf-logs-. For example: aws-waf-logs-production. This is an AWS-enforced naming convention, and log delivery will fail silently if the prefix is missing. See Sending web ACL traffic logs to a CloudWatch Logs log group for details.
Before analyzing WAF logs in CloudWatch, you must configure your web ACL to send logs to a CloudWatch Logs log group. The recommended approach is to use CloudWatch telemetry enablement rules (part of CloudWatch Unified Data Sources) to automatically enable WAF logging across your accounts and organization.
Enable WAF Log Ingestion via CloudWatch Telemetry Enablement Rules (Console)
Telemetry enablement rules automatically discover WAF web ACLs in your account or organization and enable log delivery to CloudWatch Logs. This is the preferred method for consistent, scalable WAF log collection. The rule will enable logging for both existing web ACLs that do not already have CloudWatch Logs logging configured, and any new web ACLs created in the future.
- Open the CloudWatch console.
- In the navigation pane, choose Ingestion.
- Choose the Enablement rules tab.
- Choose Add rule.
- Choose Configure telemetry for AWS WAFV2.
- Under the Specify scope screen, for Rule name, enter a descriptive name (for example,
WAFv2-WebACL-TurnOnLogging-20260708-2119). Note that the rule name cannot be modified once created. - For Select source accounts, choose one of the following:
- All accounts in your organization: Applies the rule across your entire AWS Organizations
- Filter accounts: Applies the rule to specific accounts
- (Optional) Under Select data source scope, add tags to filter which web ACLs the rule affects. For example, add
Environment = prodto only enable logging for production web ACLs. CloudWatch will automatically enable telemetry for existing and new resources that match your tag criteria. - Under Target regions, select the Regions where you want this rule to apply. The home Region is included by default. Toggle All regions to automatically include new Regions when you opt in to them.
- Choose Next.
- Under the Specify destination screen, for Log group name pattern, enter a pattern for the log group name. The pattern must begin with
aws-waf-logs-. You can use the<resourceId>and<accountId>macros for flexibility (for example,aws-waf-logs-<resourceId>). - For Retention setting, choose the retention period for newly created log groups. If an existing log group with the same name exists, CloudWatch will not update its retention.
- (Optional) Under Assign tag to rule, add key-value pairs to help identify, organize, or search for data sources.
- Choose Next.
- Under the Select data options screen, for Redacted fields, select any data fields you want to omit from the logs (HTTP method, Query string, URI path, or Single header).
- (Optional) Under Filter logs, add filters to control which web requests are logged. If you add multiple filters, AWS WAF evaluates them starting from the top.
- Choose Next.
- Under the Review and create screen, review the configuration summary showing your scope, destination, and data options. The review page displays the data source type (AWS WAFV2), telemetry type (Logs), rule name, enablement status, source accounts, destination log group, and any redacted fields or filters.
- Choose Create rule.
- The log group created will always be prefixed with
aws-waf-logs-(this is enforced by the rule) - Rule updates only affect new web ACLs or existing web ACLs that do not already have logging enabled to CloudWatch Logs
- If you need a specific log group name, pre-create the log group before creating the enablement rule
- Rules are evaluated hierarchically: organization → OU → account. Higher-level rules provide the baseline; lower-level rules can add additional telemetry but cannot reduce it
Understanding WAF Log Structure
Each WAF log event is a JSON object containing the request details, rule evaluation outcomes, and metadata. Understanding the key fields enables effective query construction and metric filter design.
| Field | Description | Security Use |
|---|---|---|
action | ALLOW, BLOCK, CAPTCHA, CHALLENGE | Filter by enforcement outcome |
httpRequest.clientIp | Source IP of the request | Identify unauthorized source IPs |
httpRequest.country | Geo-location country code | Geo-based threat detection |
httpRequest.uri | Requested URI path | Identify targeted endpoints |
terminatingRuleId | Rule that terminated evaluation | Which rules are firing most |
terminatingRuleType | RATE_BASED, REGULAR, MANAGED_RULE_GROUP | Category of enforcement |
ruleGroupList[].terminatingRule | Specific rule within a managed group | Drill into managed rule triggers |
labels[].name | Labels applied by rules | Categorize and correlate events |
httpRequest.headers[] | Request headers (User-Agent, etc.) | Bot and tool fingerprinting |
timestamp | Event time (epoch ms) | Time-based correlation |
For the complete field reference, see Log fields for web ACL traffic.
The rule IDs used in this guide (such as SQLInjectionRule, XSSRule, GeoBlockRule, and BlockAdminPathsRule) are example placeholders. Your actual terminatingRuleId values will depend on how you named your custom rules and which managed rule groups you use. AWS Managed Rules use names like AWS-AWSManagedRulesSQLiRuleSet. Check your WAF web ACL configuration or run the Security Posture Overview query to discover the rule IDs active in your environment.
View sample WAF log event
{
  "timestamp": 1719936000000,
  "formatVersion": 1,
  "webaclId": "arn:aws:wafv2:us-east-1:123456789012:regional/webacl/my-webacl/abc123",
  "terminatingRuleId": "SQLInjectionRule",
  "terminatingRuleType": "REGULAR",
  "action": "BLOCK",
  "httpSourceName": "ALB",
  "httpSourceId": "123456789012-app/my-alb/abc123",
  "ruleGroupList": [],
  "rateBasedRuleList": [],
  "nonTerminatingMatchingRules": [],
  "httpRequest": {
    "clientIp": "203.0.113.42",
    "country": "US",
    "headers": [
      {"name": "host", "value": "app.example.com"},
      {"name": "user-agent", "value": "Mozilla/5.0 (Windows NT 10.0; Win64; x64)"}
    ],
    "uri": "/search?q=' OR '1'='1",
    "args": "q=' OR '1'='1",
    "httpVersion": "HTTP/1.1",
    "httpMethod": "GET",
    "requestId": "1-abc-123"
  },
  "labels": [{"name": "awswaf:managed:aws:sql-database:SQLi_Body"}]
}
CloudWatch Logs Insights Queries for WAF Security Analysis
CloudWatch Logs Insights enables ad-hoc investigation and forensic analysis of WAF events. Use these queries in the CloudWatch console by selecting your aws-waf-logs-* log group and setting an appropriate time range.
For production WAF log groups with high volume, narrow your time range to control query cost. Logs Insights charges per GB of data scanned. A 1-hour window is usually sufficient for active investigations.
Security Posture Overview
Get a quick snapshot of how many requests are being blocked versus allowed. This is the first query to run when you open a WAF investigation, and it tells you at a glance whether your WAF is actively blocking threats or if something has changed in your traffic pattern.
fields @timestamp, action, terminatingRuleId
| stats count(*) as requestCount by action
| sort requestCount desc
Top Blocked IPs: Unauthorized Source Identification
Identify source IPs generating the most blocked requests, potentially from unauthorized actors or compromised hosts. Use this to build IP block lists or to cross-reference with threat intelligence feeds for attribution. The country field helps identify whether attacks are concentrated geographically or distributed.
fields httpRequest.clientIp, httpRequest.country, terminatingRuleId
| filter action = "BLOCK"
| stats count(*) as blockCount by httpRequest.clientIp, httpRequest.country
| sort blockCount desc
| limit 20
SQL Injection Attack Analysis
Deep-dive into SQLi attempts to see exact payloads, source IPs, and targeted URIs. Examining the args field reveals the actual injection strings unauthorized actors are using, which helps you understand whether they are automated scanners or targeted attacks against your specific application logic.
fields @timestamp, httpRequest.clientIp, httpRequest.uri, httpRequest.args
| filter terminatingRuleId = "SQLInjectionRule"
    or terminatingRuleId like /(?i)sql/
| sort @timestamp desc
| limit 50
Rule Effectiveness Analysis
Understand which rules carry the heaviest blocking load to validate rule configuration. If a single rule is responsible for the majority of blocks, it may indicate a highly effective rule, or a rule that is too broad and generating false positives that need investigation.
fields terminatingRuleId, terminatingRuleType
| filter action = "BLOCK"
| stats count(*) as triggers by terminatingRuleId, terminatingRuleType
| sort triggers desc
Managed Rule Group Drill-Down
See which specific rules within AWS Managed Rule Groups are triggering blocks. This is essential for tuning. AWS Managed Rules contain dozens of individual rules, and knowing which specific signatures fire helps you decide whether to set exceptions or adjust rule action overrides.
fields @timestamp, httpRequest.clientIp, httpRequest.uri
| parse @message '"terminatingRule":{"ruleId":"*"' as managedRuleId
| filter terminatingRuleType = "MANAGED_RULE_GROUP"
| stats count(*) as hits by managedRuleId, terminatingRuleId
| sort hits desc
Geographic Threat Analysis
Identify which countries generate the most unwanted traffic. This data informs geo-blocking decisions and helps you understand whether attacks originate from regions where you have no legitimate users, making IP reputation and geo-restriction rules lower risk to implement.
fields httpRequest.country, action
| filter action = "BLOCK"
| stats count(*) as blockedRequests by httpRequest.country
| sort blockedRequests desc
| limit 15
Rate-Limited IPs: DDoS and Brute-Force Detection
Find IPs that were rate-limited, indicating potential DDoS or brute-force activity. The firstSeen and lastSeen timestamps reveal whether rate limiting is catching short bursts or sustained campaigns, which influences whether you should escalate to permanent IP blocking.
fields @timestamp, httpRequest.clientIp, httpRequest.uri
| filter terminatingRuleType = "RATE_BASED"
| stats count(*) as rateLimited, earliest(@timestamp) as firstSeen, latest(@timestamp) as lastSeen
  by httpRequest.clientIp
| sort rateLimited desc
XSS Attack Patterns
Analyze cross-site scripting attempts to identify payload patterns and targeted endpoints. XSS attacks often target forms, search fields, and user input endpoints, and correlating by HTTP method helps distinguish GET-based reflected XSS from POST-based stored XSS attempts.
fields @timestamp, httpRequest.clientIp, httpRequest.uri, httpRequest.httpMethod
| filter terminatingRuleId = "XSSRule"
    or @message like /(?i)xss/
| stats count(*) as attempts by httpRequest.clientIp, httpRequest.httpMethod
| sort attempts desc
Admin Path Probing Detection
Detect reconnaissance activity, with unauthorized actors scanning for admin panels, config files, and sensitive paths. Path probing is typically an early-stage attack indicator; seeing it from a specific IP suggests the unauthorized actor is mapping your application before launching a targeted attempt.
fields @timestamp, httpRequest.clientIp, httpRequest.uri, action
| filter httpRequest.uri like /admin/
    or httpRequest.uri like /wp-admin/
    or httpRequest.uri like /phpmyadmin/
    or httpRequest.uri like /\.env/
| stats count(*) as probeCount by httpRequest.clientIp, httpRequest.uri, action
| sort probeCount desc
Block Rate Timeline: Anomaly Detection
Visualize block rate over time to spot attack spikes and campaigns (use as a line chart widget). Sudden step-function increases often indicate the start of an automated attack campaign, while gradual increases may signal growing bot traffic that warrants a new rate-based rule.
fields @timestamp, action
| filter action = "BLOCK"
| stats count(*) as blockedPerMinute by bin(5m)
| sort @timestamp asc
User-Agent Analysis: Bot Detection
Fingerprint tools and bots used in attacks by examining User-Agent headers. Automated attack tools like sqlmap, nikto, and curl often leave distinctive User-Agent signatures that help you categorize threats and build targeted bot control rules.
fields @timestamp, httpRequest.clientIp, action
| parse @message '"name":"user-agent","value":"*"' as userAgent
| filter action = "BLOCK"
| stats count(*) as requests by userAgent
| sort requests desc
| limit 20
Multi-Vector Unauthorized Actors
Find IPs triggering multiple different rules, indicating sophisticated unauthorized actors running diverse attack techniques. An IP that triggers SQLi, XSS, and path traversal rules simultaneously is likely running an automated vulnerability scanner and warrants immediate blocking at the IP level rather than relying on individual rule defenses.
fields httpRequest.clientIp, terminatingRuleId
| filter action = "BLOCK"
| stats count_distinct(terminatingRuleId) as rulesTriggered,
    count(*) as totalBlocks
  by httpRequest.clientIp
| filter rulesTriggered > 2
| sort rulesTriggered desc, totalBlocks desc
SSRF and Log4j Attempts
Detect Server-Side Request Forgery and Log4Shell attempts. These are critical vulnerability classes: SSRF attempts targeting the metadata service (169.254.169.254) can lead to unauthorized credential access, while Log4j JNDI injection can achieve remote code execution on unpatched servers.
fields @timestamp, httpRequest.clientIp, httpRequest.uri, terminatingRuleId
| filter httpRequest.uri like /169\.254/
    or httpRequest.uri like /jndi:/
    or httpRequest.uri like /\$\{/
    or @message like /Log4JRCE/
| sort @timestamp desc
| limit 30
Metric Filters and Alarms for Near Real-Time Threat Detection
Metric filters continuously extract numeric values from WAF logs as they arrive and publish them as CloudWatch metrics. These metrics power near-real-time alarms and dashboard widgets without requiring manual query execution.
A metric filter matches a JSON pattern in each log event as it arrives. When the pattern matches, CloudWatch increments a custom metric. CloudWatch Alarms can then trigger Amazon SNS notifications, Lambda functions, or other automated responses when the metric crosses a threshold.
Total Blocked Requests
Track overall block rate; sudden spikes indicate active attacks. This is your primary early-warning metric; when combined with an alarm, it provides immediate notification when your WAF shifts from normal background scanning to active attack mitigation.
aws logs put-metric-filter \
  --log-group-name "aws-waf-logs-production" \
  --filter-name "WAFBlockedRequests" \
  --filter-pattern '{ $.action = "BLOCK" }' \
  --metric-transformations \
    metricName=BlockedRequests,\
    metricNamespace=WAF/Security,\
    metricValue=1,\
    defaultValue=0
Alarm:
aws cloudwatch put-metric-alarm \
  --alarm-name "WAF-HighBlockRate" \
  --metric-name BlockedRequests \
  --namespace WAF/Security \
  --statistic Sum \
  --period 300 \
  --threshold 100 \
  --comparison-operator GreaterThanThreshold \
  --evaluation-periods 2 \
  --alarm-actions arn:aws:sns:us-east-1:123456789012:security-alerts \
  --alarm-description "Alert when WAF blocks exceed 100 in 5 minutes"
SQL Injection Attempts
Dedicated metric for SQLi, critical for detecting database attack campaigns. SQL injection remains one of the most critical web attack vectors because a successful attempt can lead to full database unauthorized access; this metric lets you set a lower, more sensitive alarm threshold than general blocks.
aws logs put-metric-filter \
  --log-group-name "aws-waf-logs-production" \
  --filter-name "WAFSQLiAttempts" \
  --filter-pattern '{ $.terminatingRuleId = "SQLInjectionRule" }' \
  --metric-transformations \
    metricName=SQLiAttempts,\
    metricNamespace=WAF/Security,\
    metricValue=1,\
    defaultValue=0
Alarm:
aws cloudwatch put-metric-alarm \
  --alarm-name "WAF-SQLiAttack" \
  --metric-name SQLiAttempts \
  --namespace WAF/Security \
  --statistic Sum \
  --period 300 \
  --threshold 10 \
  --comparison-operator GreaterThanThreshold \
  --evaluation-periods 1 \
  --treat-missing-data notBreaching \
  --alarm-actions arn:aws:sns:us-east-1:123456789012:security-alerts \
  --alarm-description "SQL Injection attack detected - more than 10 attempts in 5 min"
XSS Attack Attempts
Track cross-site scripting attacks that may indicate form or input field attempts. Persistent XSS spikes often correlate with unauthorized actors probing for stored XSS vulnerabilities that could compromise other users' sessions when unwanted content gets rendered.
aws logs put-metric-filter \
  --log-group-name "aws-waf-logs-production" \
  --filter-name "WAFXSSAttempts" \
  --filter-pattern '{ $.terminatingRuleId = "XSSRule" }' \
  --metric-transformations \
    metricName=XSSAttempts,\
    metricNamespace=WAF/Security,\
    metricValue=1,\
    defaultValue=0
Rate-Limited Requests
Monitor rate-limiting activity that indicates DDoS attempts or brute-force attacks. A sustained increase in rate-limited requests suggests your rate threshold is correctly protecting your origin, but if the volume continues growing you may need to lower the threshold or add the offending IPs to a block list.
aws logs put-metric-filter \
  --log-group-name "aws-waf-logs-production" \
  --filter-name "WAFRateLimited" \
  --filter-pattern '{ $.terminatingRuleType = "RATE_BASED" }' \
  --metric-transformations \
    metricName=RateLimitedRequests,\
    metricNamespace=WAF/Security,\
    metricValue=1,\
    defaultValue=0
Geo-Blocked Traffic
Track traffic from blocked geographies; sudden spikes may indicate coordinated campaigns. If your application only serves specific regions, this metric validates that your geo-restriction rules are working and helps you quantify how much unwanted traffic is being shed before it reaches your origin.
aws logs put-metric-filter \
  --log-group-name "aws-waf-logs-production" \
  --filter-name "WAFGeoBlocked" \
  --filter-pattern '{ $.terminatingRuleId = "GeoBlockRule" }' \
  --metric-transformations \
    metricName=GeoBlockedRequests,\
    metricNamespace=WAF/Security,\
    metricValue=1,\
    defaultValue=0
Admin Path Probing
Detect reconnaissance activity targeting admin panels and sensitive files. Admin path probing is a precursor to targeted attacks; unauthorized actors first find exposed admin interfaces, then attempt credential stuffing or known attack techniques against them.
aws logs put-metric-filter \
  --log-group-name "aws-waf-logs-production" \
  --filter-name "WAFAdminProbing" \
  --filter-pattern '{ $.terminatingRuleId = "BlockAdminPathsRule" }' \
  --metric-transformations \
    metricName=AdminProbingAttempts,\
    metricNamespace=WAF/Security,\
    metricValue=1,\
    defaultValue=0
Allowed Requests (for Ratio-Based Analysis)
Track allowed request volume alongside blocks for ratio-based anomaly detection. Monitoring the block-to-allow ratio is more meaningful than absolute block counts alone; a sudden ratio change (even without a block spike) can indicate that legitimate traffic dropped while attacks continue, or that a new attack vector is bypassing your rules.
aws logs put-metric-filter \
  --log-group-name "aws-waf-logs-production" \
  --filter-name "WAFAllowedRequests" \
  --filter-pattern '{ $.action = "ALLOW" }' \
  --metric-transformations \
    metricName=AllowedRequests,\
    metricNamespace=WAF/Security,\
    metricValue=1,\
    defaultValue=0
Combine metric filters with composite alarms for nuanced alerting. For example, fire only when SQLi attempts exceed threshold AND the overall block rate spikes. reducing noise from isolated events during normal scanning activity.
Contributor Insights Rules for Continuous Top-N Analysis
CloudWatch Contributor Insights creates near-real-time top-N reports from log data. Unlike Logs Insights queries (ad-hoc) or metric filters (aggregate counts), Contributor Insights continuously ranks the top contributors, making it perfect for identifying top unauthorized actors, most-targeted URIs, and busiest rules without writing queries.
| Capability | Best For | Latency | Cost Model |
|---|---|---|---|
| Logs Insights Queries | Ad-hoc investigation, forensics, custom analysis | Seconds (on-demand) | Per query (data scanned) |
| Metric Filters | Near-real-time metrics, alarms, dashboards | ~1 minute | Per custom metric |
| Contributor Insights | Top-N ranking, heavy hitters, trends | Near real-time | Per rule (matched events) |
Contributor Insights only analyzes log events ingested after the rule is created. It cannot process historical logs. Create rules early in your WAF deployment to begin accumulating data.
Top Blocked Source IPs
Near-real-time leaderboard of IPs generating the most blocked requests, identifying your active unauthorized actors. This rule continuously updates without manual query execution, making it ideal for SOC dashboards where analysts need at-a-glance visibility into who is currently attacking your application.
aws cloudwatch put-insight-rule \
  --rule-name "WAF-TopBlockedIPs" \
  --rule-state "ENABLED" \
  --rule-definition '{
    "Schema": {"Name": "CloudWatchLogRule", "Version": 1},
    "LogGroupNames": ["aws-waf-logs-production"],
    "LogFormat": "JSON",
    "Contribution": {
      "Keys": ["$.httpRequest.clientIp"],
      "Filters": [{"Match": "$.action", "In": ["BLOCK"]}]
    },
    "AggregateOn": "Count"
  }'
Top Targeted URIs
See which endpoints unauthorized actors target most, revealing attack focus areas in your application. When specific URIs consistently appear at the top, it signals that unauthorized actors have identified high-value targets in your app (login pages, APIs with sensitive data, or endpoints with known vulnerabilities).
aws cloudwatch put-insight-rule \
  --rule-name "WAF-TopTargetedURIs" \
  --rule-state "ENABLED" \
  --rule-definition '{
    "Schema": {"Name": "CloudWatchLogRule", "Version": 1},
    "LogGroupNames": ["aws-waf-logs-production"],
    "LogFormat": "JSON",
    "Contribution": {
      "Keys": ["$.httpRequest.uri"],
      "Filters": [{"Match": "$.action", "In": ["BLOCK"]}]
    },
    "AggregateOn": "Count"
  }'
Top Terminating Rules
Near-real-time view of which WAF rules are doing the most work, validating rule effectiveness. If a managed rule group dominates the top list, your investment in AWS Managed Rules is paying off. If custom rules lead, it confirms your application-specific protections are well-targeted.
aws cloudwatch put-insight-rule \
  --rule-name "WAF-TopTerminatingRules" \
  --rule-state "ENABLED" \
  --rule-definition '{
    "Schema": {"Name": "CloudWatchLogRule", "Version": 1},
    "LogGroupNames": ["aws-waf-logs-production"],
    "LogFormat": "JSON",
    "Contribution": {
      "Keys": ["$.terminatingRuleId"],
      "Filters": [{"Match": "$.action", "In": ["BLOCK"]}]
    },
    "AggregateOn": "Count"
  }'
Top Attack Source Countries
Geographic distribution of attacks that helps identify regional threat campaigns. Sudden shifts in country rankings (a new country appearing in the top 5 that wasn't there yesterday) can indicate a newly compromised botnet or a coordinated campaign from a specific region.
aws cloudwatch put-insight-rule \
  --rule-name "WAF-TopAttackCountries" \
  --rule-state "ENABLED" \
  --rule-definition '{
    "Schema": {"Name": "CloudWatchLogRule", "Version": 1},
    "LogGroupNames": ["aws-waf-logs-production"],
    "LogFormat": "JSON",
    "Contribution": {
      "Keys": ["$.httpRequest.country"],
      "Filters": [{"Match": "$.action", "In": ["BLOCK"]}]
    },
    "AggregateOn": "Count"
  }'
IP + Rule Combinations (Attack Fingerprinting)
Composite key showing which IPs trigger which rules, fingerprinting multi-vector unauthorized actors. This two-dimensional view reveals unauthorized actor sophistication: an IP appearing with multiple different rule IDs is running diverse techniques, while many IPs paired with the same rule suggests a distributed campaign using identical payloads.
aws cloudwatch put-insight-rule \
  --rule-name "WAF-IPRuleCombinations" \
  --rule-state "ENABLED" \
  --rule-definition '{
    "Schema": {"Name": "CloudWatchLogRule", "Version": 1},
    "LogGroupNames": ["aws-waf-logs-production"],
    "LogFormat": "JSON",
    "Contribution": {
      "Keys": ["$.httpRequest.clientIp", "$.terminatingRuleId"],
      "Filters": [{"Match": "$.action", "In": ["BLOCK"]}]
    },
    "AggregateOn": "Count"
  }'
Top Allowed Source IPs (Baseline Monitoring)
Track top legitimate traffic sources to detect anomalies when unexpected IPs appear in the top contributors. By establishing a baseline of normal traffic sources, you can quickly spot when a new unknown IP suddenly enters the top-N list, which may indicate credential stuffing from a previously unseen source that hasn't yet triggered block rules.
aws cloudwatch put-insight-rule \
  --rule-name "WAF-TopAllowedIPs" \
  --rule-state "ENABLED" \
  --rule-definition '{
    "Schema": {"Name": "CloudWatchLogRule", "Version": 1},
    "LogGroupNames": ["aws-waf-logs-production"],
    "LogFormat": "JSON",
    "Contribution": {
      "Keys": ["$.httpRequest.clientIp"],
      "Filters": [{"Match": "$.action", "In": ["ALLOW"]}]
    },
    "AggregateOn": "Count"
  }'
Building a Unified WAF Security Dashboard
Combine all three capabilities into a single CloudWatch Dashboard for near-real-time WAF security monitoring. The dashboard below includes every query, alarm, and Contributor Insights rule from this guide as individual widgets.
Complete Dashboard JSON
The following creates the comprehensive WAF security operations dashboard incorporating all metric filter widgets, alarm widgets, Contributor Insights widgets, and Logs Insights query widgets from this guide.
aws cloudwatch put-dashboard \
  --dashboard-name "WAF-Security-Operations" \
  --dashboard-body file://waf-dashboard.json
View complete dashboard JSON (waf-dashboard.json)
{
  "widgets": [
    {
      "type": "metric",
      "x": 0,
      "y": 0,
      "width": 12,
      "height": 6,
      "properties": {
        "title": "WAF Block vs Allow Rate (5-min intervals)",
        "metrics": [
          ["WAF/Security", "BlockedRequests", {"stat": "Sum", "period": 300, "color": "#d13212"}],
          ["WAF/Security", "AllowedRequests", {"stat": "Sum", "period": 300, "color": "#1b660f"}]
        ],
        "view": "timeSeries",
        "region": "us-east-1",
        "yAxis": {
          "left": {"label": "Request Count"}
        },
        "period": 300
      }
    },
    {
      "type": "metric",
      "x": 12,
      "y": 0,
      "width": 12,
      "height": 6,
      "properties": {
        "title": "Attack Types Over Time",
        "metrics": [
          ["WAF/Security", "SQLiAttempts", {"stat": "Sum", "period": 300, "color": "#d13212"}],
          ["WAF/Security", "XSSAttempts", {"stat": "Sum", "period": 300, "color": "#ff9900"}],
          ["WAF/Security", "RateLimitedRequests", {"stat": "Sum", "period": 300, "color": "#8c4fff"}],
          ["WAF/Security", "GeoBlockedRequests", {"stat": "Sum", "period": 300, "color": "#0073bb"}],
          ["WAF/Security", "AdminProbingAttempts", {"stat": "Sum", "period": 300, "color": "#1b660f"}]
        ],
        "view": "timeSeries",
        "stacked": true,
        "region": "us-east-1",
        "yAxis": {
          "left": {"label": "Attempts"}
        },
        "period": 300
      }
    },
    {
      "type": "metric",
      "x": 0,
      "y": 6,
      "width": 12,
      "height": 3,
      "properties": {
        "title": "Alarm: WAF High Block Rate",
        "annotations": {
          "alarms": ["arn:aws:cloudwatch:us-east-1:ACCOUNT_ID:alarm:WAF-HighBlockRate"]
        },
        "view": "timeSeries",
        "region": "us-east-1",
        "period": 300
      }
    },
    {
      "type": "metric",
      "x": 12,
      "y": 6,
      "width": 12,
      "height": 3,
      "properties": {
        "title": "Alarm: WAF SQL Injection Attack",
        "annotations": {
          "alarms": ["arn:aws:cloudwatch:us-east-1:ACCOUNT_ID:alarm:WAF-SQLiAttack"]
        },
        "view": "timeSeries",
        "region": "us-east-1",
        "period": 300
      }
    },
    {
      "type": "metric",
      "x": 0,
      "y": 9,
      "width": 8,
      "height": 6,
      "properties": {
        "title": "Contributor Insights: Top Blocked IPs",
        "metrics": [
          [{"expression": "INSIGHT_RULE_METRIC('WAF-TopBlockedIPs', 'UniqueContributors')", "label": "Unique Blocked IPs", "period": 300}],
          [{"expression": "INSIGHT_RULE_METRIC('WAF-TopBlockedIPs', 'MaxContributorValue')", "label": "Top IP Block Count", "period": 300}]
        ],
        "view": "timeSeries",
        "region": "us-east-1",
        "period": 300
      }
    },
    {
      "type": "metric",
      "x": 8,
      "y": 9,
      "width": 8,
      "height": 6,
      "properties": {
        "title": "Contributor Insights: Top Terminating Rules",
        "metrics": [
          [{"expression": "INSIGHT_RULE_METRIC('WAF-TopTerminatingRules', 'UniqueContributors')", "label": "Active Rules", "period": 300}],
          [{"expression": "INSIGHT_RULE_METRIC('WAF-TopTerminatingRules', 'MaxContributorValue')", "label": "Top Rule Triggers", "period": 300}]
        ],
        "view": "timeSeries",
        "region": "us-east-1",
        "period": 300
      }
    },
    {
      "type": "metric",
      "x": 16,
      "y": 9,
      "width": 8,
      "height": 6,
      "properties": {
        "title": "Contributor Insights: Top Attack Countries",
        "metrics": [
          [{"expression": "INSIGHT_RULE_METRIC('WAF-TopAttackCountries', 'UniqueContributors')", "label": "Unique Countries", "period": 300}],
          [{"expression": "INSIGHT_RULE_METRIC('WAF-TopAttackCountries', 'MaxContributorValue')", "label": "Top Country Blocks", "period": 300}]
        ],
        "view": "timeSeries",
        "region": "us-east-1",
        "period": 300
      }
    },
    {
      "type": "metric",
      "x": 0,
      "y": 15,
      "width": 8,
      "height": 6,
      "properties": {
        "title": "Contributor Insights: Top Targeted URIs",
        "metrics": [
          [{"expression": "INSIGHT_RULE_METRIC('WAF-TopTargetedURIs', 'UniqueContributors')", "label": "Unique URIs Targeted", "period": 300}],
          [{"expression": "INSIGHT_RULE_METRIC('WAF-TopTargetedURIs', 'MaxContributorValue')", "label": "Top URI Hits", "period": 300}]
        ],
        "view": "timeSeries",
        "region": "us-east-1",
        "period": 300
      }
    },
    {
      "type": "metric",
      "x": 8,
      "y": 15,
      "width": 8,
      "height": 6,
      "properties": {
        "title": "Contributor Insights: IP + Rule Combos",
        "metrics": [
          [{"expression": "INSIGHT_RULE_METRIC('WAF-IPRuleCombinations', 'UniqueContributors')", "label": "Unique IP+Rule Pairs", "period": 300}],
          [{"expression": "INSIGHT_RULE_METRIC('WAF-IPRuleCombinations', 'MaxContributorValue')", "label": "Top Combo Count", "period": 300}]
        ],
        "view": "timeSeries",
        "region": "us-east-1",
        "period": 300
      }
    },
    {
      "type": "metric",
      "x": 16,
      "y": 15,
      "width": 8,
      "height": 6,
      "properties": {
        "title": "Contributor Insights: Top Allowed IPs (Baseline)",
        "metrics": [
          [{"expression": "INSIGHT_RULE_METRIC('WAF-TopAllowedIPs', 'UniqueContributors')", "label": "Unique Allowed IPs", "period": 300}],
          [{"expression": "INSIGHT_RULE_METRIC('WAF-TopAllowedIPs', 'MaxContributorValue')", "label": "Top IP Request Count", "period": 300}]
        ],
        "view": "timeSeries",
        "region": "us-east-1",
        "period": 300
      }
    },
    {
      "type": "log",
      "x": 0,
      "y": 21,
      "width": 12,
      "height": 6,
      "properties": {
        "title": "Security Posture Overview",
        "query": "SOURCE \"aws-waf-logs-production\"\n| fields @timestamp, action, terminatingRuleId\n| stats count(*) as requestCount by action\n| sort requestCount desc",
        "region": "us-east-1",
        "view": "table"
      }
    },
    {
      "type": "log",
      "x": 12,
      "y": 21,
      "width": 12,
      "height": 6,
      "properties": {
        "title": "Top Blocked IPs",
        "query": "SOURCE \"aws-waf-logs-production\"\n| fields httpRequest.clientIp, httpRequest.country, terminatingRuleId\n| filter action = \"BLOCK\"\n| stats count(*) as blockCount by httpRequest.clientIp, httpRequest.country\n| sort blockCount desc\n| limit 20",
        "region": "us-east-1",
        "view": "table"
      }
    },
    {
      "type": "log",
      "x": 0,
      "y": 27,
      "width": 12,
      "height": 6,
      "properties": {
        "title": "Recent SQL Injection Attempts",
        "query": "SOURCE \"aws-waf-logs-production\"\n| fields @timestamp, httpRequest.clientIp, httpRequest.uri, httpRequest.args\n| filter terminatingRuleId = \"SQLInjectionRule\" or terminatingRuleId like /(?i)sql/\n| sort @timestamp desc\n| limit 50",
        "region": "us-east-1",
        "view": "table"
      }
    },
    {
      "type": "log",
      "x": 12,
      "y": 27,
      "width": 12,
      "height": 6,
      "properties": {
        "title": "Top Terminating Rules",
        "query": "SOURCE \"aws-waf-logs-production\"\n| fields terminatingRuleId, terminatingRuleType\n| filter action = \"BLOCK\"\n| stats count(*) as triggers by terminatingRuleId, terminatingRuleType\n| sort triggers desc",
        "region": "us-east-1",
        "view": "table"
      }
    },
    {
      "type": "log",
      "x": 0,
      "y": 33,
      "width": 12,
      "height": 6,
      "properties": {
        "title": "Managed Rule Group Drill-Down",
        "query": "SOURCE \"aws-waf-logs-production\"\n| fields @timestamp, httpRequest.clientIp, httpRequest.uri\n| parse @message '\"terminatingRule\":{\"ruleId\":\"*\"' as managedRuleId\n| filter terminatingRuleType = \"MANAGED_RULE_GROUP\"\n| stats count(*) as hits by managedRuleId, terminatingRuleId\n| sort hits desc",
        "region": "us-east-1",
        "view": "table"
      }
    },
    {
      "type": "log",
      "x": 12,
      "y": 33,
      "width": 12,
      "height": 6,
      "properties": {
        "title": "Geographic Threat Distribution",
        "query": "SOURCE \"aws-waf-logs-production\"\n| fields httpRequest.country, action\n| filter action = \"BLOCK\"\n| stats count(*) as blockedRequests by httpRequest.country\n| sort blockedRequests desc\n| limit 15",
        "region": "us-east-1",
        "view": "table"
      }
    },
    {
      "type": "log",
      "x": 0,
      "y": 39,
      "width": 12,
      "height": 6,
      "properties": {
        "title": "Rate-Limited IPs (DDoS/Brute-Force)",
        "query": "SOURCE \"aws-waf-logs-production\"\n| fields @timestamp, httpRequest.clientIp, httpRequest.uri\n| filter terminatingRuleType = \"RATE_BASED\"\n| stats count(*) as rateLimited, earliest(@timestamp) as firstSeen, latest(@timestamp) as lastSeen by httpRequest.clientIp\n| sort rateLimited desc",
        "region": "us-east-1",
        "view": "table"
      }
    },
    {
      "type": "log",
      "x": 12,
      "y": 39,
      "width": 12,
      "height": 6,
      "properties": {
        "title": "XSS Attack Patterns",
        "query": "SOURCE \"aws-waf-logs-production\"\n| fields @timestamp, httpRequest.clientIp, httpRequest.uri, httpRequest.httpMethod\n| filter terminatingRuleId = \"XSSRule\" or @message like /(?i)xss/\n| stats count(*) as attempts by httpRequest.clientIp, httpRequest.httpMethod\n| sort attempts desc",
        "region": "us-east-1",
        "view": "table"
      }
    },
    {
      "type": "log",
      "x": 0,
      "y": 45,
      "width": 12,
      "height": 6,
      "properties": {
        "title": "Admin Path Probing Detection",
        "query": "SOURCE \"aws-waf-logs-production\"\n| fields @timestamp, httpRequest.clientIp, httpRequest.uri, action\n| filter httpRequest.uri like /admin/ or httpRequest.uri like /wp-admin/ or httpRequest.uri like /phpmyadmin/ or httpRequest.uri like /\\.env/\n| stats count(*) as probeCount by httpRequest.clientIp, httpRequest.uri, action\n| sort probeCount desc",
        "region": "us-east-1",
        "view": "table"
      }
    },
    {
      "type": "log",
      "x": 12,
      "y": 45,
      "width": 12,
      "height": 6,
      "properties": {
        "title": "SSRF and Log4j Attempts",
        "query": "SOURCE \"aws-waf-logs-production\"\n| fields @timestamp, httpRequest.clientIp, httpRequest.uri, terminatingRuleId\n| filter httpRequest.uri like /169\\.254/ or httpRequest.uri like /jndi:/ or httpRequest.uri like /\\$\\{/ or @message like /Log4JRCE/\n| sort @timestamp desc\n| limit 30",
        "region": "us-east-1",
        "view": "table"
      }
    },
    {
      "type": "log",
      "x": 0,
      "y": 51,
      "width": 12,
      "height": 6,
      "properties": {
        "title": "Multi-Vector Unauthorized Actors (IPs triggering 3+ rules)",
        "query": "SOURCE \"aws-waf-logs-production\"\n| fields httpRequest.clientIp, terminatingRuleId\n| filter action = \"BLOCK\"\n| stats count_distinct(terminatingRuleId) as rulesTriggered, count(*) as totalBlocks by httpRequest.clientIp\n| filter rulesTriggered > 2\n| sort rulesTriggered desc, totalBlocks desc",
        "region": "us-east-1",
        "view": "table"
      }
    },
    {
      "type": "log",
      "x": 12,
      "y": 51,
      "width": 12,
      "height": 6,
      "properties": {
        "title": "User-Agent Analysis (Bot Detection)",
        "query": "SOURCE \"aws-waf-logs-production\"\n| fields @timestamp, httpRequest.clientIp, action\n| parse @message '\"name\":\"user-agent\",\"value\":\"*\"' as userAgent\n| filter action = \"BLOCK\"\n| stats count(*) as requests by userAgent\n| sort requests desc\n| limit 20",
        "region": "us-east-1",
        "view": "table"
      }
    },
    {
      "type": "log",
      "x": 0,
      "y": 57,
      "width": 12,
      "height": 6,
      "properties": {
        "title": "Top Targeted URIs",
        "query": "SOURCE \"aws-waf-logs-production\"\n| fields httpRequest.uri, terminatingRuleId\n| filter action = \"BLOCK\"\n| stats count(*) as hits by httpRequest.uri\n| sort hits desc\n| limit 20",
        "region": "us-east-1",
        "view": "table"
      }
    },
    {
      "type": "log",
      "x": 12,
      "y": 57,
      "width": 12,
      "height": 6,
      "properties": {
        "title": "Block Rate Timeline (5-min bins)",
        "query": "SOURCE \"aws-waf-logs-production\"\n| fields @timestamp, action\n| filter action = \"BLOCK\"\n| stats count(*) as blockedPerInterval by bin(5m)\n| sort @timestamp asc",
        "region": "us-east-1",
        "view": "timeSeries"
      }
    }
  ]
}
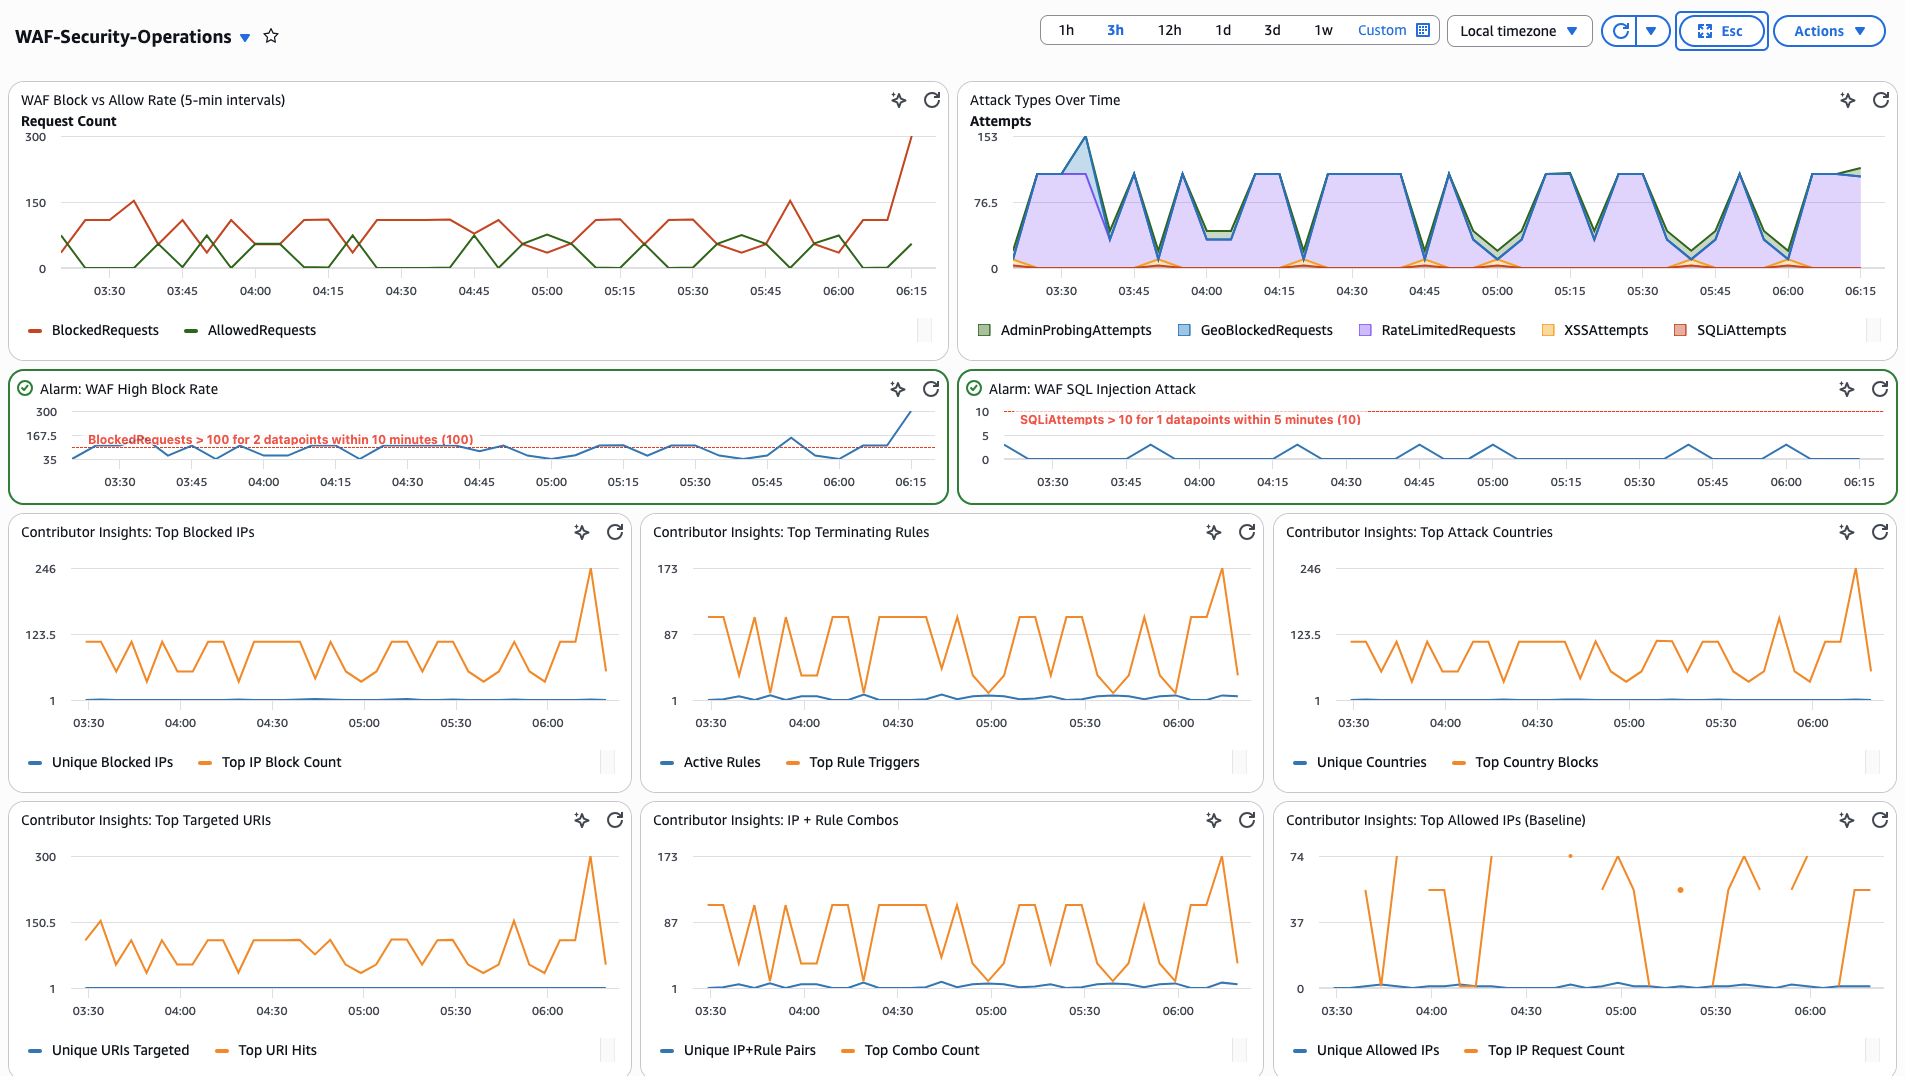
Replace aws-waf-logs-production with your actual WAF log group name throughout the dashboard JSON. Replace ACCOUNT_ID with your 12-digit AWS account ID in the alarm ARNs. If you have multiple WAF log groups, you can add them as additional SOURCE values in each query (for example, SOURCE "aws-waf-logs-production", "aws-waf-logs-staging").
Security Operations Workflow
These CloudWatch capabilities map to specific security operations workflows:
| Security Use Case | Primary Tool | Supporting Tool |
|---|---|---|
| Detect active attack campaigns | Metric Filter + Alarm | Contributor Insights (top IPs) |
| Identify unauthorized actors | Contributor Insights | Logs Insights (deep-dive) |
| Validate rule effectiveness | Contributor Insights (top rules) | Metric Filters (trend) |
| Incident investigation | Logs Insights Queries | Contributor Insights (context) |
| Compliance reporting | Metric Filters (metrics) | Logs Insights (evidence) |
| Anomaly detection | Metric Filters + CloudWatch Anomaly Detection | Contributor Insights (new actors) |
| Geographic threat analysis | Contributor Insights (countries) | Logs Insights (country details) |
| Bot/scanner identification | Logs Insights (User-Agent) | Metric Filter (bad bot count) |
Typical Incident Response Flow
- Alarm fires (metric filter detects spike) → Check the WAF Security Dashboard
- Identify top IPs (Contributor Insights) → See who is generating the most blocks
- Deep-dive investigation (Logs Insights query) → Examine exact payloads, paths, and timing
- Take action → Update WAF rules to block IPs, tighten rate limits, or add IP sets
Ongoing Operational Practices
- Weekly review: Check Contributor Insights trends to identify gradual attack pattern changes and tune WAF rules accordingly
- Rule tuning: Use the Rule Effectiveness query to identify rules that fire frequently on false positives (high COUNT actions)
- Baseline monitoring: Track the Top Allowed IPs rule to detect anomalies when unexpected sources suddenly appear
- Geo-awareness: Monitor geographic distribution for sudden shifts indicating coordinated campaigns from new regions
Cleanup
To prevent additional cost, delete the resources created from the guide such as metric filters, Contributor Insights rules, alarms, and dashboard.
# Delete metric filters
aws logs delete-metric-filter --log-group-name "aws-waf-logs-production" --filter-name "WAFBlockedRequests"
aws logs delete-metric-filter --log-group-name "aws-waf-logs-production" --filter-name "WAFSQLiAttempts"
aws logs delete-metric-filter --log-group-name "aws-waf-logs-production" --filter-name "WAFXSSAttempts"
aws logs delete-metric-filter --log-group-name "aws-waf-logs-production" --filter-name "WAFRateLimited"
aws logs delete-metric-filter --log-group-name "aws-waf-logs-production" --filter-name "WAFGeoBlocked"
aws logs delete-metric-filter --log-group-name "aws-waf-logs-production" --filter-name "WAFAdminProbing"
aws logs delete-metric-filter --log-group-name "aws-waf-logs-production" --filter-name "WAFAllowedRequests"

# Delete alarms
aws cloudwatch delete-alarms --alarm-names "WAF-HighBlockRate" "WAF-SQLiAttack"

# Delete Contributor Insights rules
aws cloudwatch delete-insight-rules --rule-names "WAF-TopBlockedIPs" "WAF-TopTargetedURIs" "WAF-TopTerminatingRules" "WAF-TopAttackCountries" "WAF-IPRuleCombinations" "WAF-TopAllowedIPs"

# Delete dashboard
aws cloudwatch delete-dashboards --dashboard-names "WAF-Security-Operations"
Deleting these analysis resources does not affect WAF logging itself. Your WAF logs will continue flowing to the CloudWatch Logs log group. To fully stop WAF log ingestion, you must also delete the telemetry enablement rule and disable logging on your WAF web ACLs separately. You can re-create the analysis resources at any time without data loss.
Additional Resources
- Filter pattern syntax for metric filters: JSON metric filter pattern reference
- Contributor Insights rule syntax: Rule definition syntax
- Security best practices for Contributor Insights: IAM condition keys for restricting rule access
- Analyzing AWS WAF Logs in Amazon CloudWatch Logs: AWS Blog post with detailed analysis patterns
- Deploy a dashboard for AWS WAF with minimal effort: Pre-built WAF dashboard guidance
- AWS WAF Console adds new top insights visualizations: Built-in WAF console insights (February 2025)
- Amazon CloudWatch and Amazon OpenSearch Service integrated analytics: Pre-built OpenSearch dashboards for WAF logs (December 2024)