EC2 पर EKS में Amazon Managed Service for Prometheus के साथ AWS Distro for OpenTelemetry का उपयोग
इस रेसिपी में हम आपको दिखाते हैं कि कैसे instrument a sample Go application and use AWS Distro for OpenTelemetry (ADOT) to ingest metrics into Amazon Managed Service for Prometheus (AMP) . Then we're using Amazon Managed Grafana (AMG) to visualize the metrics.
We will be setting up an Amazon Elastic Kubernetes Service (EKS) on EC2 cluster and Amazon Elastic Container Registry (ECR) repository to demonstrate a complete scenario.
इस गाइड को पूरा करने में लगभग 1 hour लगेंगे।
इंफ्रास्ट्रक्चर
निम्नलिखित अनुभाग में हम इस रेसिपी के लिए इंफ्रास्ट्रक्चर सेट करेंगे।
आर्किटेक्चर
The ADOT pipeline enables us to use the ADOT Collector to scrape a Prometheus-instrumented application, and ingest the scraped metrics to Amazon Managed Service for Prometheus.
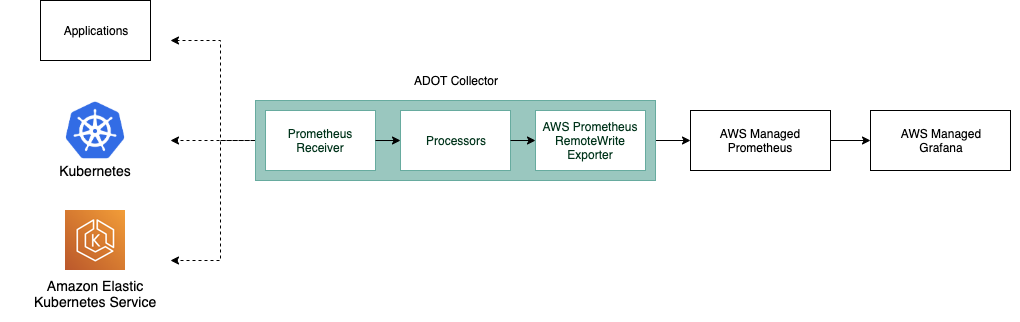
The ADOT Collector includes two components specific to Prometheus:
- the Prometheus Receiver, and
- the AWS Prometheus Remote Write Exporter.
अधिक जानकारी के लिए on Prometheus Remote Write Exporter देखें: Getting Started with Prometheus Remote Write Exporter for AMP
पूर्वापेक्षाएँ
- The AWS CLI is installed and configured in your environment.
- You need to install the eksctl command in your environment.
- You need to install kubectl in your environment.
- You have docker installed into your environment.
EC2 पर EKS क्लस्टर बनाएं
इस रेसिपी में हमारा डेमो एप्लिकेशन चलेगा EKS. You can either use an existing EKS cluster or create one using cluster-config.yaml.
This template will create a new cluster with two EC2 t2.large nodes.
Edit the template file and set <YOUR_REGION> to one of the
supported regions for AMP.
Make sure to overwrite <YOUR_REGION> in your session, for example in bash:
export AWS_DEFAULT_REGION=<YOUR_REGION>
निम्नलिखित कमांड का उपयोग करके अपना क्लस्टर बनाएं.
eksctl create cluster -f cluster-config.yaml
ECR रिपॉजिटरी सेट करें
EKS पर हमारे एप्लिकेशन को डिप्लॉय करने के लिए हमें एक कंटेनर registry.
You can use the following command to create a new ECR registry in your account.
सेट करना सुनिश्चित करें <YOUR_REGION> as well.
aws ecr create-repository \
    --repository-name prometheus-sample-app \
    --image-scanning-configuration scanOnPush=true \
    --region <YOUR_REGION>
AMP सेट करें
create a workspace using the AWS CLI
aws amp create-workspace --alias prometheus-sample-app
निम्नलिखित का उपयोग करके सत्यापित करें कि वर्कस्पेस बनाया गया है:
aws amp list-workspaces
For more details देखें the AMP Getting started guide.
ADOT Collector सेट करें
Download adot-collector-ec2.yaml and edit this YAML doc with the parameters described in the next steps.
In this example, the ADOT Collector configuration uses an annotation (scrape=true)
to tell which target endpoints to scrape. This allows the ADOT Collector to distinguish
the sample app endpoint from kube-system endpoints in your cluster.
You can remove this from the re-label configurations if you want to scrape a different sample app.
Use the following steps to edit the downloaded file for your environment:
1. Replace <YOUR_REGION> with your current region.
2. Replace <YOUR_ENDPOINT> with the remote write URL of your workspace.
Get your AMP remote write URL endpoint by executing the following queries.
First, get the workspace ID like so:
YOUR_WORKSPACE_ID=$(aws amp list-workspaces \
                    --alias prometheus-sample-app \
                    --query 'workspaces[0].workspaceId' --output text)
Now get the remote write URL endpoint URL for your workspace using:
YOUR_ENDPOINT=$(aws amp describe-workspace \
                --workspace-id $YOUR_WORKSPACE_ID  \
                --query 'workspace.prometheusEndpoint' --output text)api/v1/remote_write
Make sure that YOUR_ENDPOINT is in fact the remote write URL, that is,
the URL should end in /api/v1/remote_write.
After creating deployment file we can now apply this to our cluster by using the following command:
kubectl apply -f adot-collector-ec2.yaml
अधिक जानकारी के लिए देखें the AWS Distro for OpenTelemetry (ADOT) Collector Setup.
AMG सेट करें
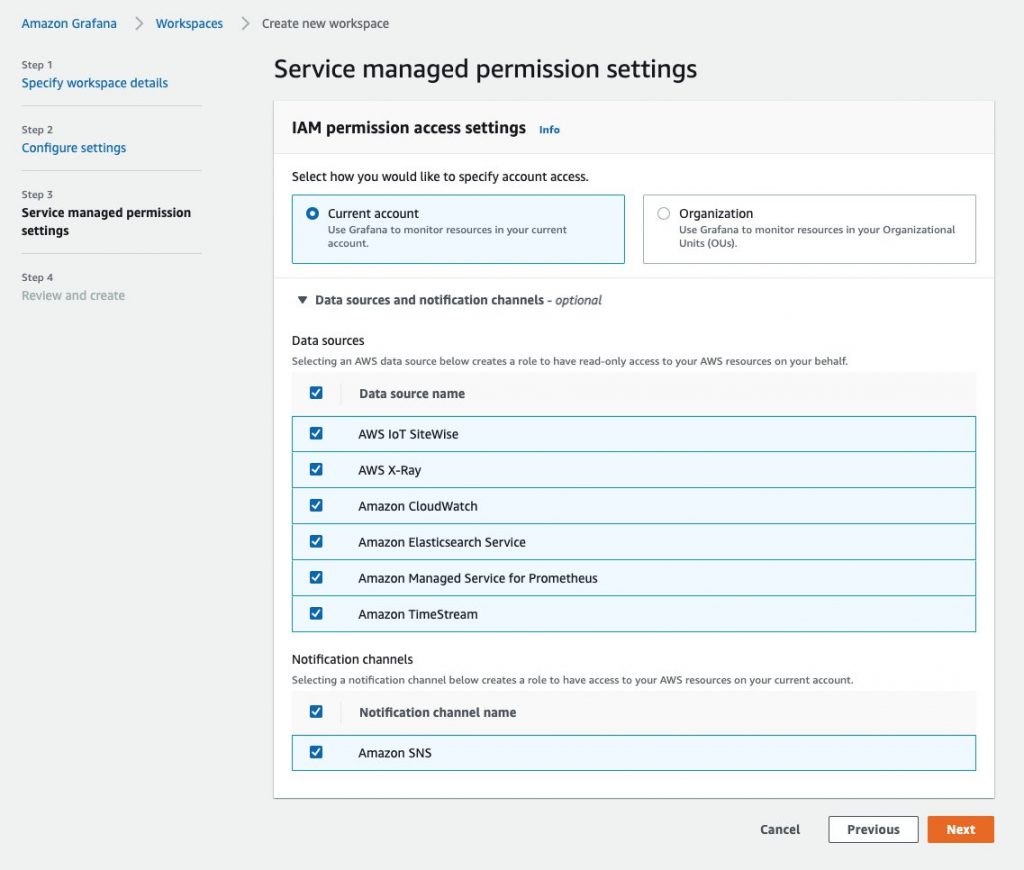
Setup a new AMG workspace using the Amazon Managed Grafana – Getting Started guide.
Make sure to add "Amazon Managed Service for Prometheus" as a datasource during creation.
एप्लिकेशन
इस रेसिपी में हम उपयोग करेंगे एक sample application from the AWS ऑब्ज़र्वेबिलिटी repository.
This Prometheus sample app generates all four Prometheus metric types
(counter, gauge, histogram, summary) and exposes them at the /metrics endpoint.
कंटेनर इमेज बिल्ड करें
कंटेनर इमेज बिल्ड करने के लिए, पहले Git रिपॉजिटरी क्लोन करें और निम्नानुसार डायरेक्टरी में जाएं:
git clone https://github.com/aws-observability/aws-otel-community.git && \
cd ./aws-otel-community/sample-apps/prometheus
First, set the region (if not already done above) and account ID to what is applicable in your case.
Replace <YOUR_REGION> with your current region. For
example, in the Bash shell this would look as follows:
export AWS_DEFAULT_REGION=<YOUR_REGION>
export ACCOUNTID=`aws sts get-caller-identity --query Account --output text`
अगला, कंटेनर इमेज बिल्ड करें:
docker build . -t "$ACCOUNTID.dkr.ecr.$AWS_DEFAULT_REGION.amazonaws.com/prometheus-sample-app:latest"
If go mod fails in your environment due to a proxy.golang.or i/o timeout,
you are able to bypass the go mod proxy by editing the Dockerfile.
Change the following line in the Docker file:
RUN GO111MODULE=on go mod download
to:
RUN GOPROXY=direct GO111MODULE=on go mod download
अब आप पहले बनाई गई ECR रिपॉजिटरी में कंटेनर इमेज पुश कर सकते हैं।
उसके लिए, पहले डिफ़ॉल्ट ECR रजिस्ट्री में लॉग इन करें:
aws ecr get-login-password --region $AWS_DEFAULT_REGION | \
    docker login --username AWS --password-stdin \
    "$ACCOUNTID.dkr.ecr.$AWS_DEFAULT_REGION.amazonaws.com"
और अंत में, ऊपर बनाई गई ECR रिपॉजिटरी में कंटेनर इमेज पुश करें:
docker push "$ACCOUNTID.dkr.ecr.$AWS_DEFAULT_REGION.amazonaws.com/prometheus-sample-app:latest"
सैंपल ऐप डिप्लॉय करें
Edit prometheus-sample-app.yaml
to contain your ECR image path. That is, replace ACCOUNTID and AWS_DEFAULT_REGION in the
file with your own values:
    # change the following to your container image:
    image: "ACCOUNTID.dkr.ecr.AWS_DEFAULT_REGION.amazonaws.com/prometheus-sample-app:latest"
अब आप निम्नलिखित का उपयोग करके अपने क्लस्टर में सैंपल ऐप डिप्लॉय कर सकते हैं:
kubectl apply -f prometheus-sample-app.yaml
एंड-टू-एंड
अब जब आपके पास इंफ्रास्ट्रक्चर और एप्लिकेशन तैयार हैं, हम सेटअप का परीक्षण करेंगे, sending metrics from the Go app running in EKS to AMP and visualize it in AMG.
सत्यापित करें कि आपकी पाइपलाइन काम कर रही है
To verify if the ADOT collector is scraping the pod of the sample app and ingests the metrics into AMP, we look at the collector logs.
Enter the following command to follow the ADOT collector logs:
kubectl -n adot-col logs adot-collector -f
One example output in the logs of the scraped metrics from the sample app should look like the following:
...
Resource labels:
     -> service.name: STRING(kubernetes-service-endpoints)
     -> host.name: STRING(192.168.16.238)
     -> port: STRING(8080)
     -> scheme: STRING(http)
InstrumentationLibraryMetrics #0
Metric #0
Descriptor:
     -> Name: test_gauge0
     -> Description: This is my gauge
     -> Unit:
     -> DataType: DoubleGauge
DoubleDataPoints #0
StartTime: 0
Timestamp: 1606511460471000000
Value: 0.000000
...
To verify if AMP received the metrics, you can use awscurl.
This tool enables you to send HTTP requests from the command line with AWS Sigv4 authentication,
so you must have AWS credentials set up locally with the correct permissions to query from AMP.
In the following command replace $AMP_ENDPOINT with the endpoint for your AMP workspace:
$ awscurl --service="aps" \
        --region="$AWS_DEFAULT_REGION" "https://$AMP_ENDPOINT/api/v1/query?query=adot_test_gauge0"
{"status":"success","data":{"resultType":"vector","result":[{"metric":{"__name__":"adot_test_gauge0"},"value":[1606512592.493,"16.87214000011479"]}]}}
Grafana डैशबोर्ड बनाएं
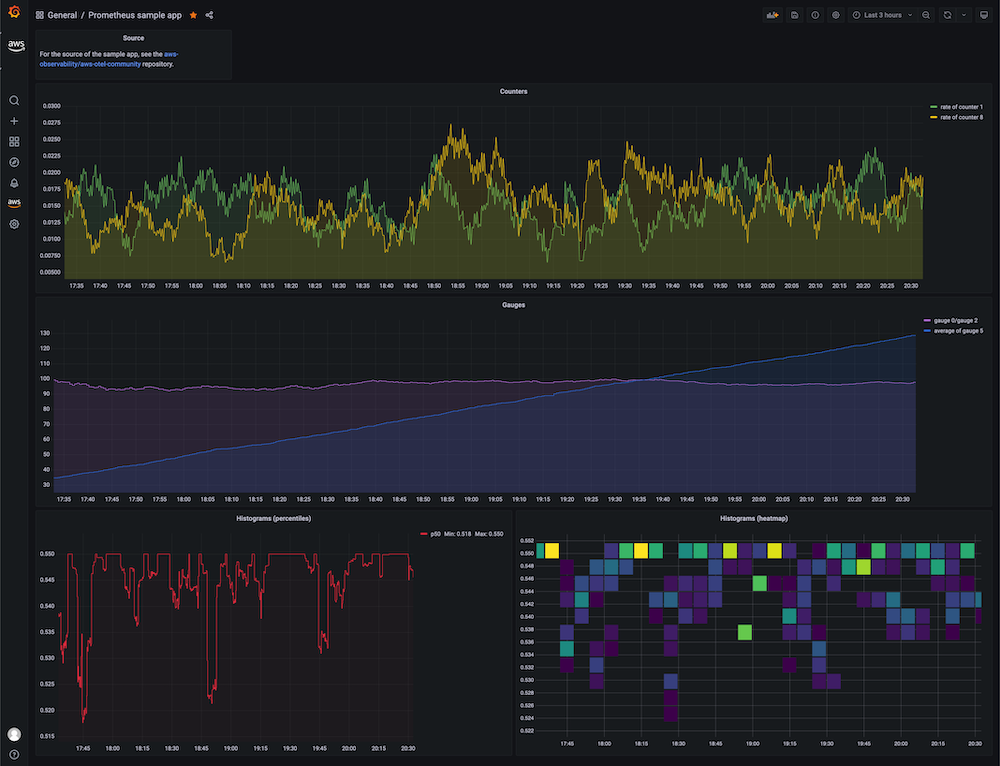
आप एक उदाहरण डैशबोर्ड आयात कर सकते हैं, जो उपलब्ध है prometheus-sample-app-dashboard.json, सैंपल ऐप के लिए जो इस प्रकार दिखता है:
Further, use the following guides to create your own dashboard in Amazon Managed Grafana में:
बस इतना ही, बधाई हो आपने सीख लिया कि कैसे उपयोग करें ADOT in EKS on EC2 to ingest metrics.
सफाई
- Remove the resources and cluster
kubectl delete all --all
eksctl delete cluster --name amp-eks-ec2
- Remove the AMP workspace
aws amp delete-workspace --workspace-id `aws amp list-workspaces --alias prometheus-sample-app --query 'workspaces[0].workspaceId' --output text`
- Remove the amp-iamproxy-ingest-role IAM role
aws delete-role --role-name amp-iamproxy-ingest-role
- Remove the AMG workspace by removing it from the console.