GenAI テレメトリのカスタムダッシュボードの作成
カスタムダッシュボードを使用する理由
Bedrock Model Invocation Logging を有効にして ADOT 自動インストルメンテーションエージェントをデプロイすると、AWS はすぐに使えるダッシュボードを提供してくれます。Bedrock は自動的に呼び出し回数、レイテンシー、トークン数、スロットルメトリクスを提供します。Application Signals はサービスマップと SLO ビューを自動生成します。これは確かな基盤ですが、全体像ではありません。
すぐに使えるダッシュボードは「AI は今正常に動作しているか?」という問いに答えるものです。しかし、DevOps、FinOps、セキュリティチームが実際に問いかける質問には答えてくれません。
- Bedrock 予算の 80% を消費しているのはどの呼び出し元か?
- 午後 3 時のデプロイ後にコンプリート率が低下したのはなぜか?
- クロスリージョン推論は実際に役立っているのか、それともレイテンシーを増加させているのか?
- キャッシュの恩恵を最も受けるプロンプトはどれか?
- PII を返したモデル呼び出しを行ったのは誰で、何を尋ねたのか?
- エージェントはツールレイヤーで失敗しているのか、それともモデルレイヤーで失敗しているのか?
これらの問いに答えるには、ロググループを結合し、トークンからコストを計算し、IAM ロール別にセグメント化し、スパンツリーを詳細に分析するカスタムクエリが必要です。生のテレメトリはすでに流れています — 価値はそれをどのように切り分けるかによって生まれます。
1 つのパイプライン、異なるオーディエンス
GenAI テレメトリは 3 つのロググループに記録されます。 bedrock-model-invocation-logging, aws/spans、および /aws/bedrock-agentcore/runtimes/<agent>データ自体は変わりませんが、表示方法は変わります。同じ呼び出しデータが次のようになります。
- DevOps ダッシュボード — 完了率、コンポーネントのレイテンシー、エージェントエラーのドリルダウンを表示し、「システムは正常に動作しているか?」に焦点を当てています。
- FinOps ダッシュボード — モデルごとのコスト、上位の消費者、キャッシュの最適化機会を表示し、「効率的に支出しているか?」に焦点を当てています。
このガイドでは、両方を構築するためのクエリを提供します。対象読者に関連するセクションを選択してください。各クエリには、ソースロググループ、ビュータイプ、クエリ言語、および回答する質問が記載されています。
基盤となるデータパイプラインの概要と、それぞれを有効にするタイミングについては、AWS での GenAI Observability を参照してください。
DevOps ペルソナダッシュボード
DevOps チームは、自分の GenAI ワークロードは正常か、ボトルネックはどこにあるか? という問いに答える必要があります。これらのクエリは、呼び出しの健全性、エージェントワークフローの信頼性、およびパフォーマンスのボトルネックに焦点を当てています。
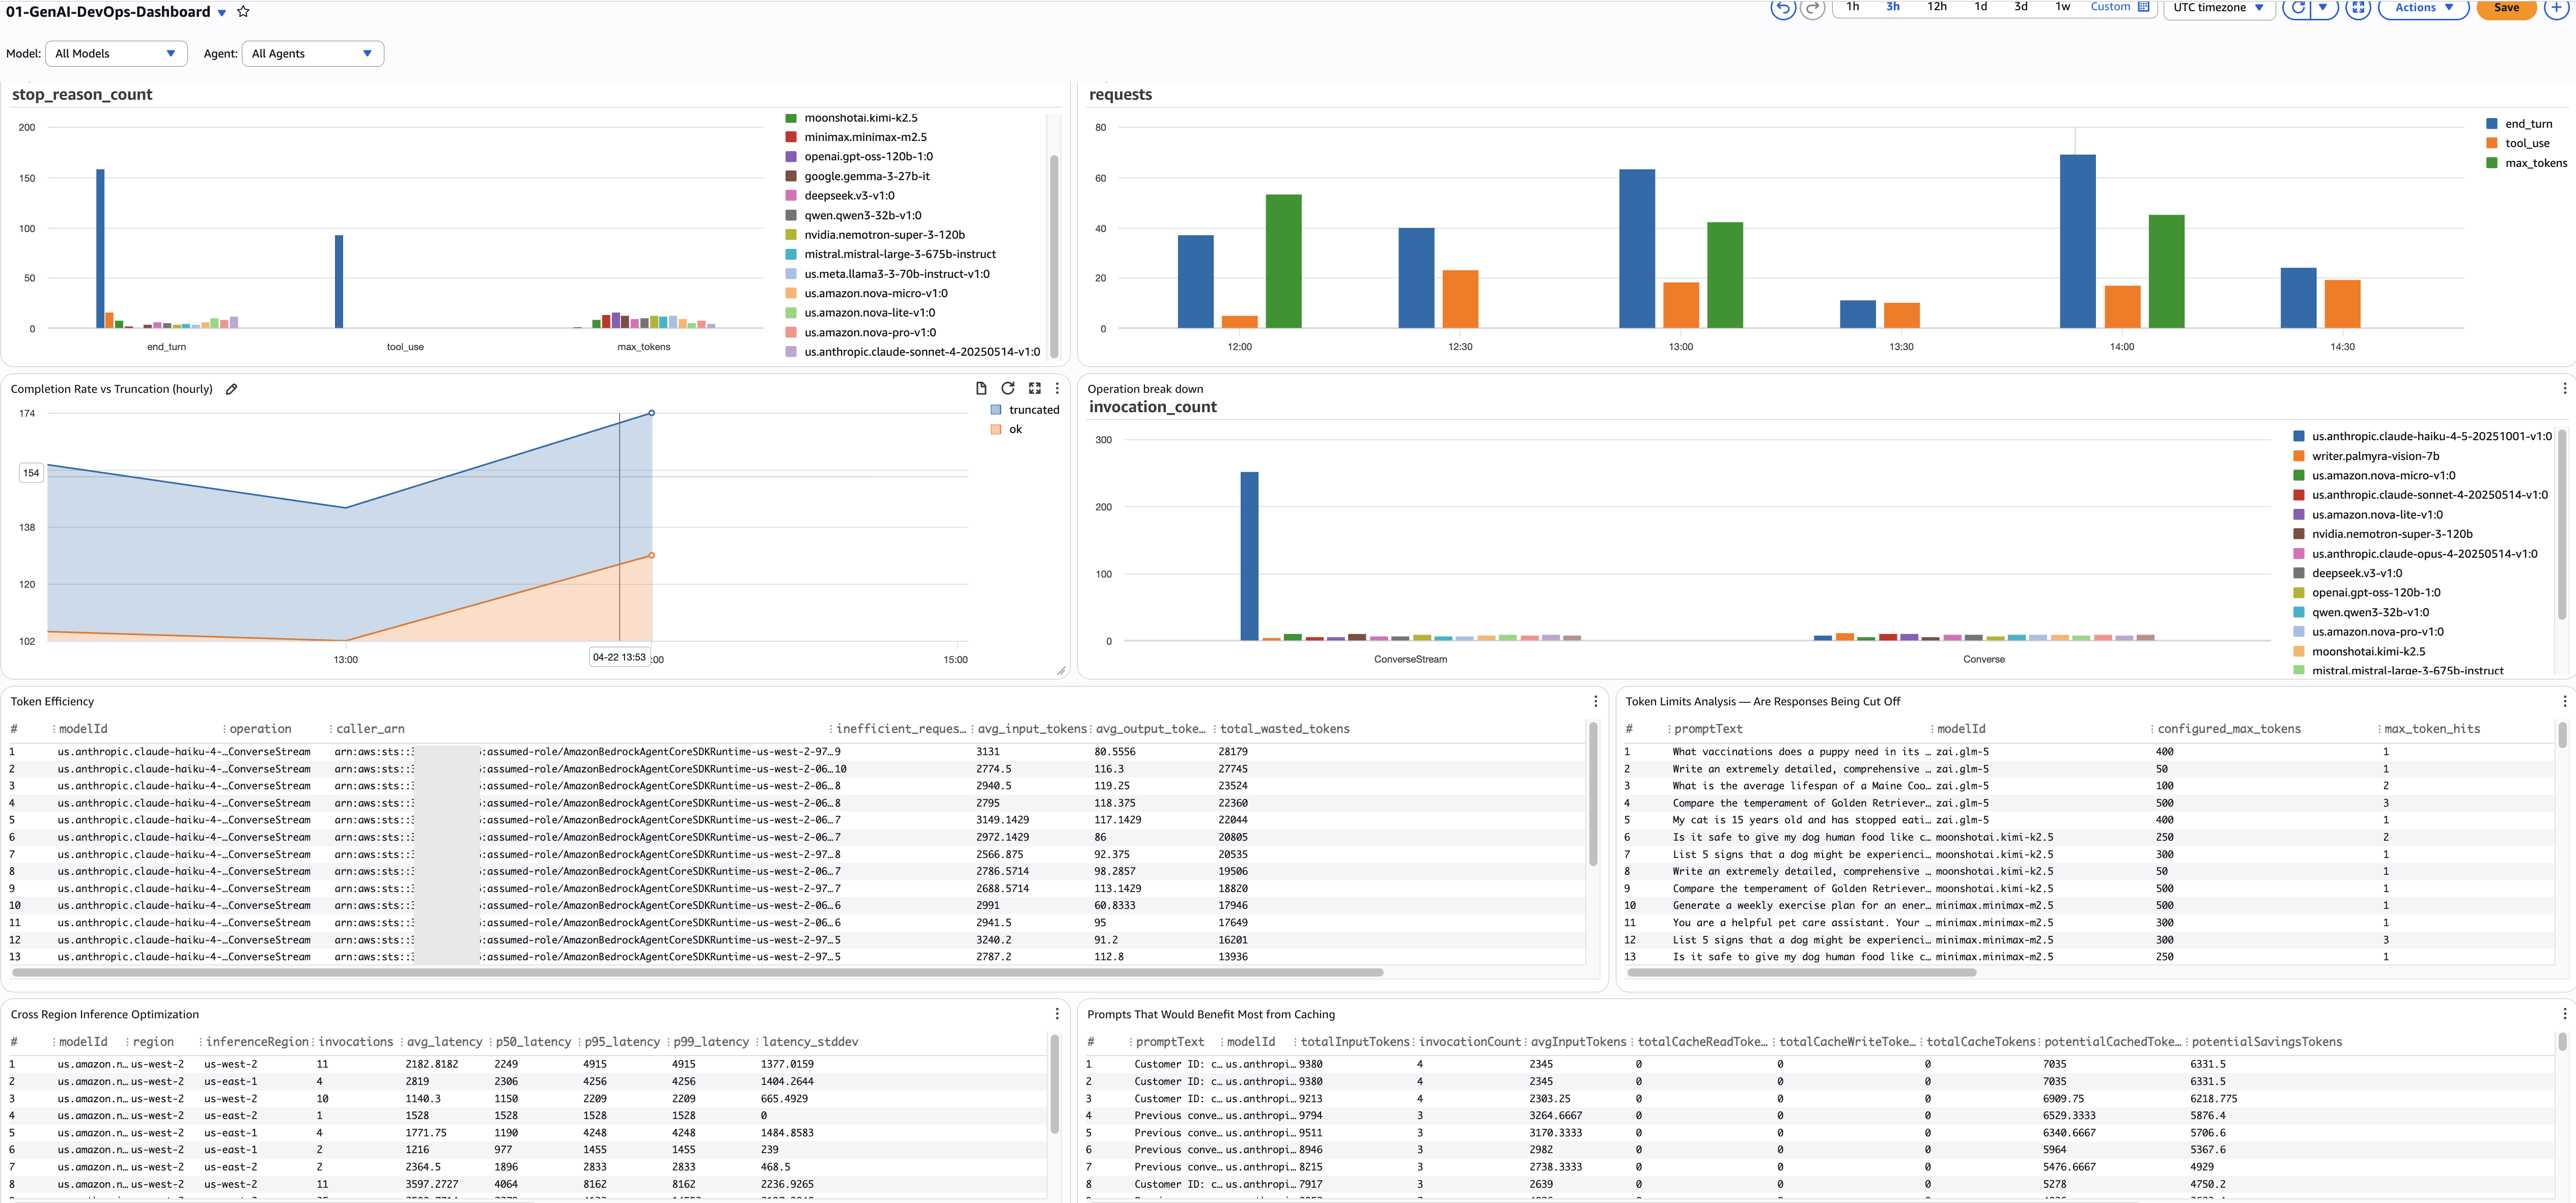
モデル呼び出しの健全性
1. モデル別の停止理由の内訳
- 目的: すべてのモデルにわたるすべての停止理由の分布を表示します。すべての Bedrock 呼び出しは停止理由で終了します —
end_turn(自然な完了)、tool_use(ツールを呼び出す)、max_tokens(truncated),stop_sequence(境界に達した場合)、またはエラーが発生した場合。例: 要約モデルの呼び出しの 15% がで終わることがわかる場合があります。max_tokens— つまり、ユーザーが途切れたレスポンスを受け取っている — 一方で分類モデルは 100%end_turn. - ソース:
bedrock-model-invocation-logging - 表示: 棒グラフ
- クエリ言語: CloudWatch Logs Insights
- クエリ:
fields @timestamp, modelId, operation, requestId,
       output.outputBodyJson.stopReason as stop_reason
| filter schemaType = "ModelInvocationLog"
| filter ispresent(output.outputBodyJson.stopReason)
        or ispresent(output.outputBodyJson.error)
| stats count() as stop_reason_count by stop_reason, modelId
- アラーム: 正常でない停止理由(not
end_turn,tool_use、またはstop_sequence) モデルの総呼び出し数の 10% を超える場合。
2. 完了率と切り捨て率の比較(時間別)
- 目的: 成功した完了の時間ごとの比率を追跡します (
end_turn+tool_use) と切り捨てられたレスポンス (max_tokens)。これは SLA メトリクスです — 完了率 95% 以上を目標とします。例:午後 3 時から午後 4 時の間に完了率が 97% から 88% に低下した場合、何かが変化しています — 新しいプロンプトテンプレート、モデルの更新、または設定変更によってトランケーションが増加しています。 - ソース:
bedrock-model-invocation-logging - 表示: 時系列 (スタック)
- クエリ言語: CloudWatch Logs Insights
- クエリ:
fields @timestamp, modelId,
       output.outputBodyJson.stopReason as stop_reason
| filter schemaType = "ModelInvocationLog"
| filter ispresent(output.outputBodyJson.stopReason)
| stats sum(stop_reason = "end_turn" or stop_reason = "tool_use") as ok,
        sum(stop_reason = "max_tokens") as truncated
  by bin(@timestamp, 1h) as hour
| sort hour desc
- アラーム:
ok / (ok + truncated)2 時間連続で 95% を下回っています。
3. トークン効率 — 無駄なトークンを見つける
- 目的: 入力トークンが多く(2000 以上)、出力が少ない(200 未満)呼び出し元を検出します。これはトークンの無駄遣いのサインです。例: 分類パイプラインが製品カタログ全体(8000 トークン)を送信して、1 単語のラベル(3 トークン)を取得する場合。The
caller_arn列には、どのサービスまたはロールが責任を持つかが正確に示されているため、プロンプトの再構成について的を絞った会話ができます。 - ソース:
bedrock-model-invocation-logging - 表示: テーブル
- クエリ言語: CloudWatch Logs Insights
- クエリ:
fields @timestamp, modelId, operation,
       input.inputTokenCount as input_tokens,
       output.outputTokenCount as output_tokens,
       identity.arn as caller_arn
| filter schemaType = "ModelInvocationLog"
| filter input_tokens > 2000 and output_tokens < 200
| stats count() as inefficient_requests,
        avg(input_tokens) as avg_input_tokens,
        avg(output_tokens) as avg_output_tokens,
        sum(input_tokens) as total_wasted_tokens
  by modelId, operation, caller_arn
| sort total_wasted_tokens desc
- アラーム: 呼び出し元が
total_wasted_tokens24 時間以内に 100K を超えた場合。
4. クロスリージョン推論のレイテンシー
- 目的: 各モデルの推論リージョン間でレイテンシーパーセンタイルを比較します。クロスリージョン推論を有効にしている場合、一部のリクエストはレイテンシーが高い遠隔リージョンにルーティングされます。例: 要約モデルの P95 が us-west-2 では 12 秒、us-east-1 では 4 秒の場合、us-east-1 を優先するように推論プロファイルを設定することで P95 を 40% 削減できます。
- ソース:
bedrock-model-invocation-logging - 表示: テーブル
- クエリ言語: CloudWatch Logs Insights
- クエリ:
fields @timestamp, modelId, region, inferenceRegion,
       output.outputBodyJson.metrics.latencyMs as latency
| filter schemaType = "ModelInvocationLog"
| filter ispresent(inferenceRegion)
| filter latency > 0
| stats count() as invocations,
        avg(latency) as avg_latency,
        pct(latency, 50) as p50_latency,
        pct(latency, 95) as p95_latency,
        pct(latency, 99) as p99_latency,
        stddev(latency) as latency_stddev
  by modelId, region, inferenceRegion
| sort modelId asc, avg_latency asc
- アラーム: 特定のリージョンでいずれかのモデルの P95 が 10 秒を超えた場合。
5. プロンプトキャッシングの機会
- 目的: キャッシュヒットがゼロまたは低い状態で繰り返し呼び出されているプロンプトを検出します。これはキャッシュ導入による ROI が最も高い機会です。例: システムプロンプトが 500 回使用されているにもかかわらずキャッシュ読み取りがゼロの場合、毎回フル料金を支払っていることになります。キャッシュを有効にすることで、入力トークンのコストを 90% 削減できる可能性があります。
- ソース:
bedrock-model-invocation-logging - 表示: テーブル
- クエリ言語: CloudWatch Logs Insights
- クエリ:
fields @timestamp,
       input.inputBodyJson.messages.0.content.0.text as promptText,
       input.inputTokenCount as inputTokens,
       input.cacheReadInputTokenCount as cacheReadTokens,
       input.cacheWriteInputTokenCount as cacheWriteTokens,
       modelId
| filter input.inputTokenCount > 0
| stats sum(input.inputTokenCount) as totalInputTokens,
        count(*) as invocationCount,
        avg(input.inputTokenCount) as avgInputTokens,
        sum(input.cacheReadInputTokenCount) as totalCacheReadTokens,
        sum(input.cacheWriteInputTokenCount) as totalCacheWriteTokens
  by promptText, modelId
| filter invocationCount > 1
| sort totalInputTokens desc
- アラーム: なし(最適化レビュー、週次実行)。
エージェントワークフローの健全性
6. エージェントトレースとエラー(1 時間ごと)
- 目的: エラースパンと並行したエージェントトレースの合計時間単位カウント — エージェントレベルの信頼性メトリクスです。例: total_traces が 500/時間であっても、午後 3 時に error_spans が 5 から 80 に急増した場合、エージェントワークフローで何らかの問題が発生しています。これはモデルレベルのメトリクスでは検出できない問題を捉えます — モデルが成功していても、ツールのタイムアウトやガードレールの拒否によってエージェントが失敗する場合があります。
- ソース:
aws/spans - 表示: 時系列
- クエリ言語: CloudWatch Logs Insights
- クエリ:
fields attributes.session.id as sessionId, traceId,
       status.code as statusCode, durationNano/1000000 as durationMs
| filter ispresent(sessionId)
| stats count_distinct(traceId) as total_traces,
        sum(statusCode = "ERROR") as error_spans
  by bin(@timestamp, 1h) as hour
| sort hour desc
- アラーム:
error_spans / total_traces15 分間で 10% を超えた場合。
7. スパンエラーのドリルダウン
- 目的: エージェントエラーが発生していることがわかっている場合、これによりどのコンポーネントが失敗しているかを正確に特定できます。ナレッジベースの取得、ガードレールチェック、ツールの実行、またはモデルの呼び出しのいずれかです。例: エラーの 70% が HTTP 503 の KB 取得スパンで発生している場合、これはモデルの問題ではなく、OpenSearch クラスターが負荷によってスロットリングされていることを示しています。
- ソース:
aws/spans - 表示: テーブル
- クエリ言語: CloudWatch Logs Insights
- クエリ:
fields name as spanName,
       resource.attributes.service.name as serviceName,
       status.code as statusCode,
       status.message as statusMessage,
       attributes.http.response.status_code as httpStatus,
       durationNano/1000000 as durationMs,
       traceId, spanId, parentSpanId
| filter resource.attributes.aws.service.type = "gen_ai_agent"
| filter status.code = "ERROR"
        or attributes.http.response.status_code >= 400
| stats count() as error_count,
        count_distinct(traceId) as affected_traces,
        avg(durationMs) as avg_error_duration_ms,
        earliest(statusMessage) as error_message
  by spanName, serviceName, httpStatus
| sort error_count desc
- アラーム: 15 分間に 10 件を超えるエラーが発生したコンポーネント。
8. コンポーネントパフォーマンスの内訳(時間別)
- 目的: エージェントコンポーネントごとの時間単位のパフォーマンスを、完全なパーセンタイル分布(P50、P95、P99)で表示します。エージェントの処理時間がどこで費やされているか、どのコンポーネントがボトルネックになっているかを示します。例: ガードレールチェックの平均が 2.8 秒(P95: 4.1 秒)、モデル呼び出しの平均が 1.2 秒(P95: 2.0 秒)の場合、ガードレールを先に最適化してください。モデルの最適化よりも効果が大きいです。
- ソース:
aws/spans - 表示: テーブル
- クエリ言語: CloudWatch Logs Insights
- クエリ:
fields name as spanName,
       resource.attributes.service.name as serviceName,
       durationNano/1000000 as durationMs,
       traceId
| filter resource.attributes.aws.service.type = "gen_ai_agent"
| filter ispresent(spanName)
| stats count() as invocations,
        avg(durationMs) as avg_duration_ms,
        pct(durationMs, 50) as p50_duration_ms,
        pct(durationMs, 95) as p95_duration_ms,
        pct(durationMs, 99) as p99_duration_ms,
        sum(durationMs) as total_time_ms
  by bin(1h), spanName, serviceName
| sort total_time_ms desc
- アラーム: いずれかのコンポーネントの P95 が 5000ms を超えた場合。
FinOps ペルソナダッシュボード
FinOps チームは、GenAI の支出はどこに向かっているのか、どのように最適化するのか? という問いに答える必要があります。これらのクエリは、トークン使用量からコストを計算し、チームやロールへの支出を帰属させ、プロンプトキャッシングなどの最適化の機会を明らかにします。
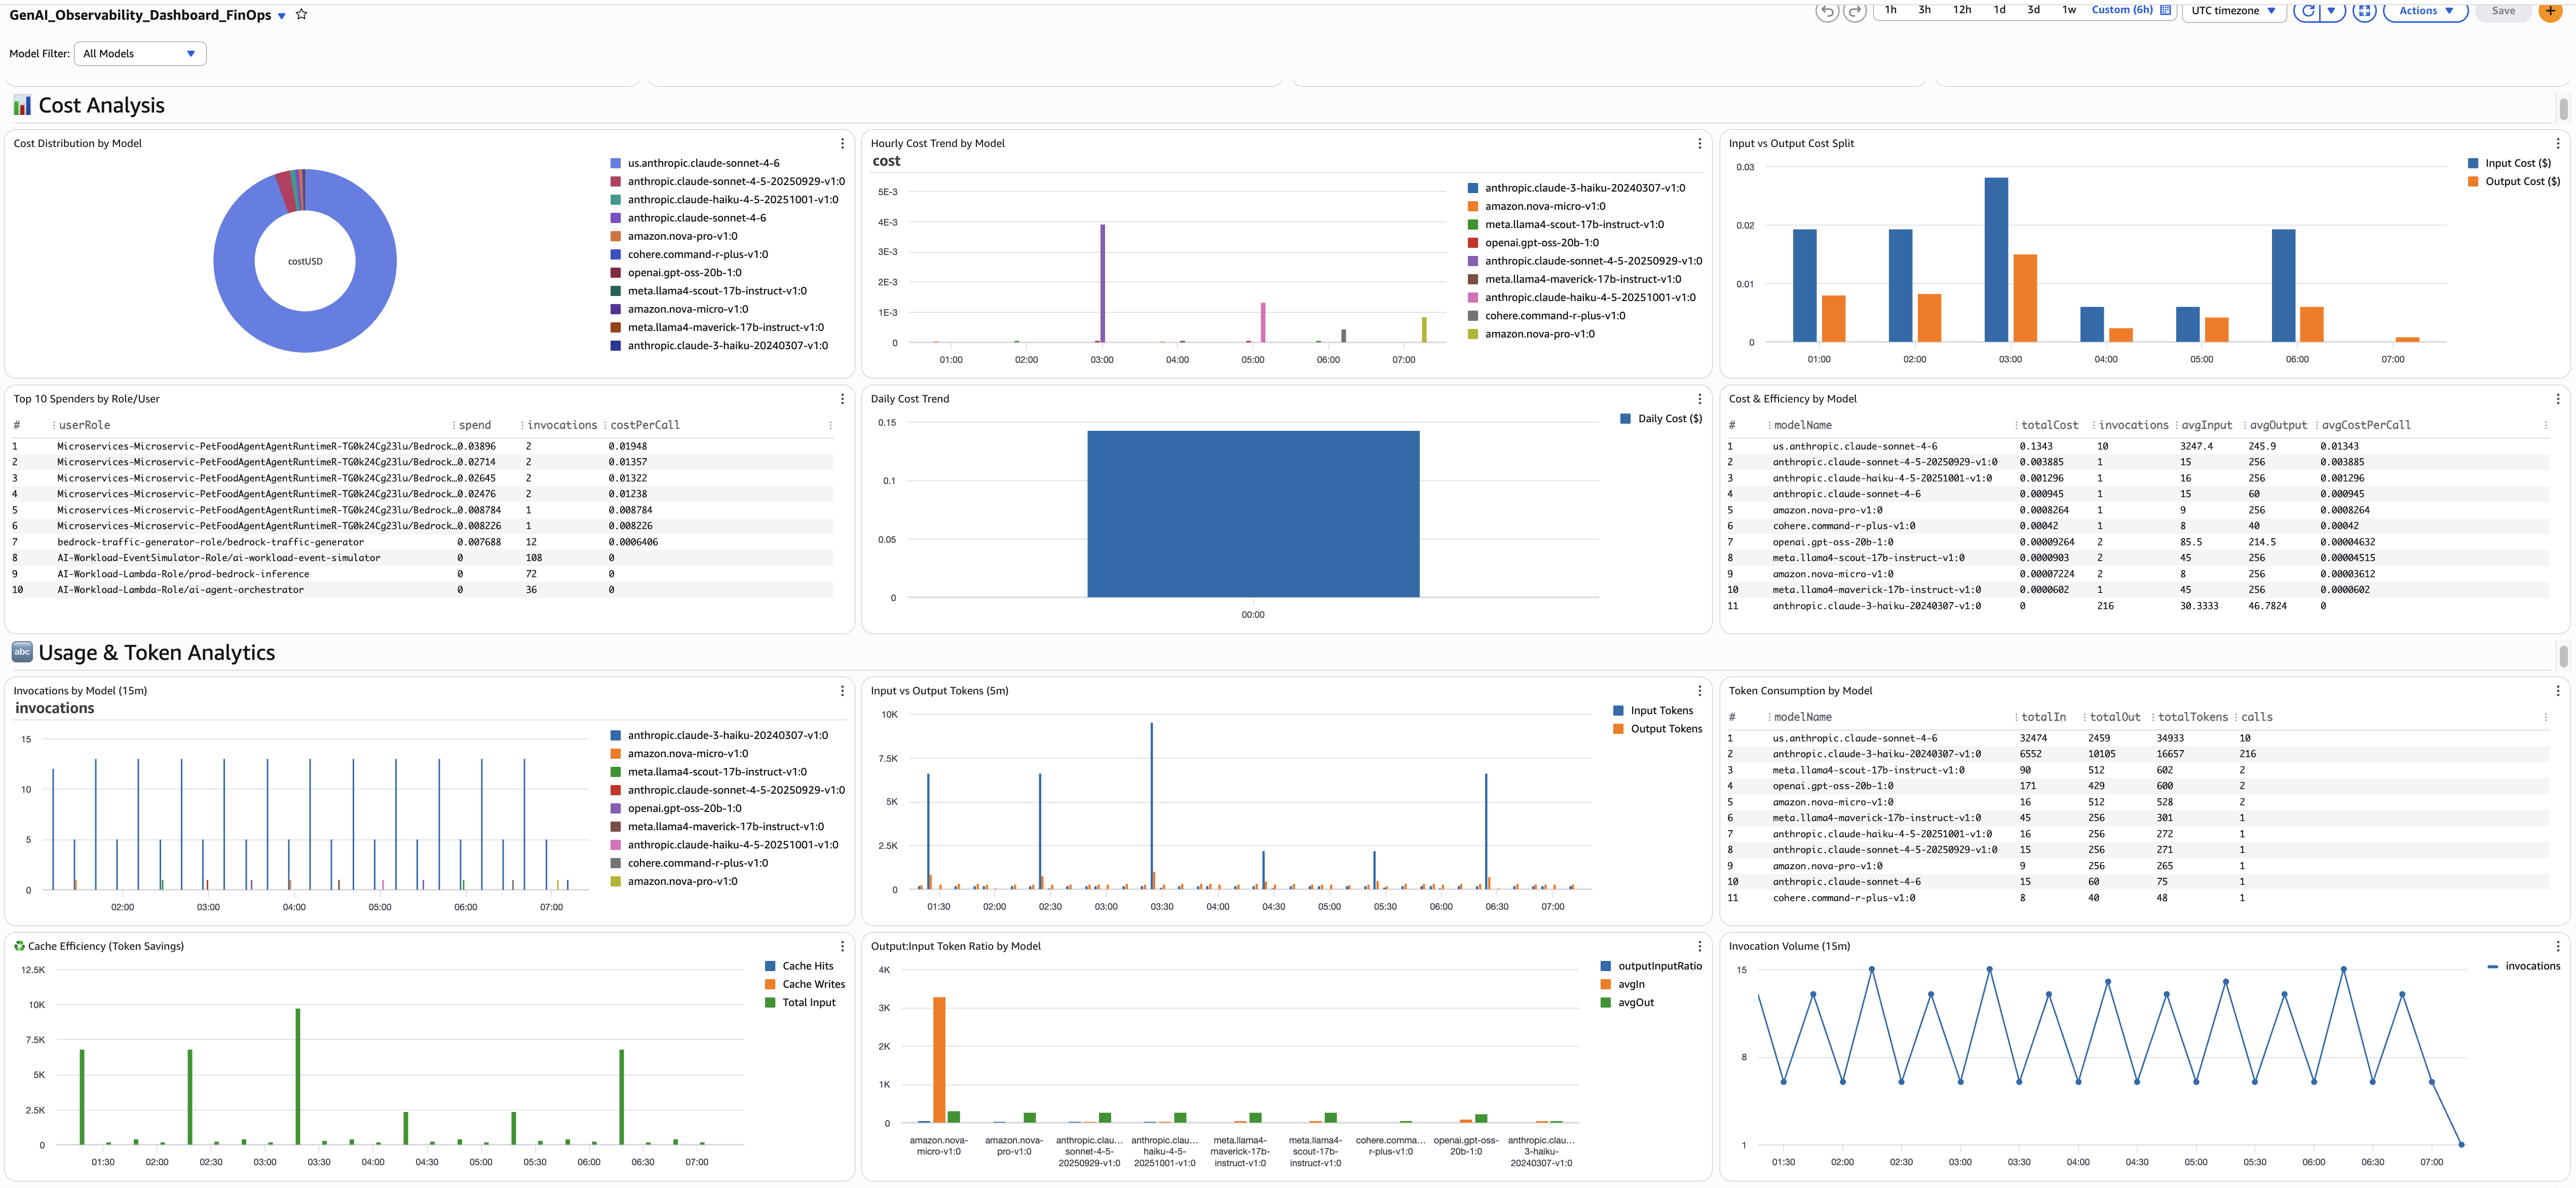
すべての FinOps クエリは、トークンごとの料金に基づくコスト計算パターンを使用しています。 strcontains 乗算パターンは各モデルをトークンごとのレートにマッピングします。Bedrock の料金が変更された場合は、料金の値を更新してください。
エグゼクティブサマリー
9. 推定総支出
- 目的: 選択した時間範囲内のすべてのモデルにわたる GenAI の総支出を表示する単一値ウィジェットです。これはヘッドライン KPI であり、CFO が注目する数値です。
- ソース:
bedrock-model-invocation-logging - 表示: 単一の値
- クエリ言語: CloudWatch Logs Insights
- クエリ:
fields coalesce(output.outputBodyJson.usage.inputTokens,
    output.outputBodyJson.usage.prompt_tokens,
    output.outputBodyJson.usage.input_tokens,
    input.inputTokenCount) as inputTokens,
  coalesce(output.outputBodyJson.usage.outputTokens,
    output.outputBodyJson.usage.completion_tokens,
    output.outputBodyJson.usage.output_tokens,
    output.outputTokenCount) as outputTokens
| fields (inputTokens *
    ((strcontains(modelId, "nova-micro") * 0.000000035) +
    (strcontains(modelId, "nova-lite") * 0.00000006) +
    (strcontains(modelId, "nova-pro") * 0.0000008) +
    (strcontains(modelId, "claude-sonnet-4-6") * 0.000003) +
    (strcontains(modelId, "claude-sonnet-4-5") * 0.000003) +
    (strcontains(modelId, "claude-haiku") * 0.000001) +
    (strcontains(modelId, "llama4-maverick") * 0.0000002) +
    (strcontains(modelId, "llama4-scout") * 0.00000015) +
    (strcontains(modelId, "command-r-plus") * 0.0000025) +
    (strcontains(modelId, "command-r-v") * 0.00000015) +
    (strcontains(modelId, "gpt-oss-120b") * 0.00000009) +
    (strcontains(modelId, "gpt-oss-20b") * 0.00000004))) +
  (outputTokens *
    ((strcontains(modelId, "nova-micro") * 0.00000014) +
    (strcontains(modelId, "nova-lite") * 0.00000024) +
    (strcontains(modelId, "nova-pro") * 0.0000032) +
    (strcontains(modelId, "claude-sonnet-4-6") * 0.000015) +
    (strcontains(modelId, "claude-sonnet-4-5") * 0.000015) +
    (strcontains(modelId, "claude-haiku") * 0.000005) +
    (strcontains(modelId, "llama4-maverick") * 0.0000002) +
    (strcontains(modelId, "llama4-scout") * 0.00000015) +
    (strcontains(modelId, "command-r-plus") * 0.00001) +
    (strcontains(modelId, "command-r-v") * 0.0000006) +
    (strcontains(modelId, "gpt-oss-120b") * 0.00000045) +
    (strcontains(modelId, "gpt-oss-20b") * 0.0000002))) as totalCostUSD
| stats sum(totalCostUSD) as TotalSpendUSD
- アラーム: 1 日の支出が 7 日間平均の 150% を超えた場合。
コスト分析
10. モデル別コスト分布
- 目的: 支出を占めるモデルの割合を示す円グラフです。例: Claude Sonnet 4.6 が請求額の 70% を占め、Nova Lite が 5% であることが判明した場合、一部のユースケースを Nova に移行できるなら、プロンプト移行の機会となります。
- ソース:
bedrock-model-invocation-logging - ビュー: 円グラフ
- クエリ言語: CloudWatch Logs Insights
- クエリ (Query 9 のコスト計算パターンに追記):
| stats sum(totalCostUSD) as costUSD by modelName
| sort costUSD desc
- アラーム: なし(情報提供のみ)。
11. ロール/ユーザー別上位 10 件の支出者
- 目的: どの IAM ロールまたはユーザーがコストを発生させているかを特定します。呼び出し回数とコール単価と組み合わせることで、チームのコストが増加している原因が、ボリュームによるものか、それともコールのコストが高いためかを把握できます。例:
data-science-explorationロールには 100K 回の呼び出しがあり、それぞれ $0.002 で、prod-chatbot10K を $0.05 ずつ持っている場合、最適化の方向性は大きく異なります。 - ソース:
bedrock-model-invocation-logging - 表示: テーブル
- クエリ言語: CloudWatch Logs Insights
- クエリ:
fields replace(`identity.arn`, "arn:aws:sts::ACCOUNT_ID:assumed-role/", "") as userRole
| fields coalesce(output.outputBodyJson.usage.inputTokens,
    output.outputBodyJson.usage.prompt_tokens,
    output.outputBodyJson.usage.input_tokens,
    input.inputTokenCount) as inputTokens,
  coalesce(output.outputBodyJson.usage.outputTokens,
    output.outputBodyJson.usage.completion_tokens,
    output.outputBodyJson.usage.output_tokens,
    output.outputTokenCount) as outputTokens
| fields (inputTokens *
    ((strcontains(modelId, "nova-micro") * 0.000000035) +
    (strcontains(modelId, "nova-lite") * 0.00000006) +
    (strcontains(modelId, "nova-pro") * 0.0000008) +
    (strcontains(modelId, "claude-sonnet-4-6") * 0.000003) +
    (strcontains(modelId, "claude-sonnet-4-5") * 0.000003) +
    (strcontains(modelId, "claude-haiku") * 0.000001))) +
  (outputTokens *
    ((strcontains(modelId, "nova-micro") * 0.00000014) +
    (strcontains(modelId, "nova-lite") * 0.00000024) +
    (strcontains(modelId, "nova-pro") * 0.0000032) +
    (strcontains(modelId, "claude-sonnet-4-6") * 0.000015) +
    (strcontains(modelId, "claude-sonnet-4-5") * 0.000015) +
    (strcontains(modelId, "claude-haiku") * 0.000005))) as totalCostUSD
| stats sum(totalCostUSD) as spend,
        count(*) as invocations,
        (sum(totalCostUSD) / count(*)) as costPerCall
  by userRole
| sort spend desc
| limit 10
- アラーム: いずれかのロールの 1 日の支出が 7 日間平均の 2 倍を超えた場合。
12. 入力と出力のコスト分割(時間単位)
- 目的: 入力トークン(プロンプト)と出力トークン(補完)のどちらにより多くのコストがかかっているかを示します。入力コストが支配的な場合は、プロンプトを最適化してキャッシュを有効にしてください。出力コストが支配的な場合は、max_tokens を削減するか、より安価なモデルに切り替えてください。
- ソース:
bedrock-model-invocation-logging - 表示: 棒グラフ(積み上げ)
- クエリ言語: CloudWatch Logs Insights
- クエリ(コスト計算パターンに追加し、入力/出力を分割):
| stats sum(inputCostUSD) as InputCost, sum(outputCostUSD) as OutputCost
  by bin(1h) as hour
| sort hour asc
- アラーム: なし(分析ウィジェット)。
トークン消費
13. 呼び出し回数(15 分間隔)
- 目的: 15 分間のウィンドウにおけるトラフィック量のベースライン。通常、ウィンドウあたりの呼び出し回数が 2〜4 回であるのに突然 10 回に急増した場合、何かが変化したことを示します。新機能のリリース、負荷テスト、または暴走したリトライループなどが考えられます。コストの急増がボリュームの急増によるものか、モデル選択の変更によるものかを確認するために、時間単位のコストトレンドと比較してください。
- ソース:
bedrock-model-invocation-logging - 表示: 時系列
- クエリ言語: CloudWatch Logs Insights
- クエリ:
stats count(*) as invocations by bin(15m) as period
| sort period asc
- アラーム: 2 回連続して、通常の 15 分間平均の 3 倍を超える呼び出し数。
14. 入力トークンと出力トークン
- 目的: 5 分間のウィンドウにおける入力トークンと出力トークンの消費量を表示します。この比率からワークロードのプロファイルを把握できます。例: 入力トークンが常に出力トークンの 10 倍である場合、短い応答に対して大きなコンテキスト(RAG、システムプロンプト)を送信していることを示しており、プロンプトキャッシングの有力な候補となります。出力トークンが突然急増した場合は、モデルの更新またはプロンプトの変更によって、より長い応答が生成されている可能性があります。
- ソース:
bedrock-model-invocation-logging - 表示: 棒グラフ(積み上げ)
- クエリ言語: CloudWatch Logs Insights
- クエリ:
fields
  coalesce(output.outputBodyJson.usage.inputTokens,
    output.outputBodyJson.usage.prompt_tokens,
    output.outputBodyJson.usage.input_tokens,
    input.inputTokenCount) as inputTokens,
  coalesce(output.outputBodyJson.usage.outputTokens,
    output.outputBodyJson.usage.completion_tokens,
    output.outputBodyJson.usage.output_tokens,
    output.outputTokenCount) as outputTokens
| stats sum(inputTokens) as totalInputTokens,
        sum(outputTokens) as totalOutputTokens
  by bin(5m) as period
| sort period asc
- アラーム: 入力対出力の比率が 20:1 を超える状態が 1 時間継続した場合は、プロンプトの最適化を調査してください。
15. 合計トークン数
- 目的: 5 分間のウィンドウにおける(入力 + 出力)トークンの合計消費量。使用量を把握するための最もシンプルなビューです。例:総トークン数が週ごとに増加しているにもかかわらず、呼び出し回数が増えていない場合、個々のリクエストが大きくなっています(プロンプトまたはレスポンスが長くなっている)。「リクエスト数の増加」と「リクエストサイズの増大」を区別するために、呼び出し回数と比較してください。
- ソース:
bedrock-model-invocation-logging - 表示: 棒グラフ
- クエリ言語: CloudWatch Logs Insights
- クエリ:
fields
  coalesce(output.outputBodyJson.usage.inputTokens,
    output.outputBodyJson.usage.prompt_tokens,
    output.outputBodyJson.usage.input_tokens,
    input.inputTokenCount) as inputTokens,
  coalesce(output.outputBodyJson.usage.outputTokens,
    output.outputBodyJson.usage.completion_tokens,
    output.outputBodyJson.usage.output_tokens,
    output.outputTokenCount) as outputTokens
| stats sum(inputTokens) + sum(outputTokens) as totalTokens by bin(5m) as period
| sort period asc
- アラーム: 5 分間のウィンドウで、トークンの合計が 7 日間の平均の 200% を超えた場合。
呼び出しの詳細
16. 呼び出しごとの詳細テーブル
- 目的: 最新 200 件の呼び出しの詳細情報(モデル名、temperature、maxTokens 設定、入力/出力/合計トークン数、キャッシュ読み取り/書き込みトークン数、および呼び出しごとの推定コスト)。特定の呼び出しを調査するためのドリルダウンテーブルです。例:入力トークン 12,000、出力トークン 50、キャッシュ読み取りゼロ、コスト $0.04 の呼び出しを発見した場合、それはドキュメント全体を送信している分類タスクです。
- ソース:
bedrock-model-invocation-logging - 表示: テーブル
- クエリ言語: CloudWatch Logs Insights
- クエリ:
fields @timestamp, modelId,
  replace(replace(replace(modelId,
    "arn:aws:bedrock:us-east-1:ACCOUNT_ID:inference-profile/us.", ""),
    "arn:aws:bedrock:us-east-1:ACCOUNT_ID:inference-profile/", ""),
    "arn:aws:bedrock:us-east-1:ACCOUNT_ID:", "") as modelName,
  coalesce(input.inputBodyJson.inferenceConfig.temperature,
    input.inputBodyJson.temperature) as temperature,
  coalesce(input.inputBodyJson.inferenceConfig.maxTokens,
    input.inputBodyJson.max_completion_tokens,
    input.inputBodyJson.max_tokens) as maxTokens,
  coalesce(output.outputBodyJson.usage.inputTokens,
    output.outputBodyJson.usage.prompt_tokens,
    output.outputBodyJson.usage.input_tokens,
    input.inputTokenCount) as inputTokens,
  coalesce(output.outputBodyJson.usage.outputTokens,
    output.outputBodyJson.usage.completion_tokens,
    output.outputBodyJson.usage.output_tokens,
    output.outputTokenCount) as outputTokens,
  coalesce(output.outputBodyJson.usage.totalTokens,
    output.outputBodyJson.usage.total_tokens,
    floor(inputTokens + outputTokens)) as totalTokens,
  coalesce(output.outputBodyJson.usage.cache_read_input_tokens,
    output.outputBodyJson.usage.cacheReadInputTokenCount) as cacheReadTokens,
  coalesce(output.outputBodyJson.usage.cache_creation_input_tokens,
    output.outputBodyJson.usage.cacheWriteInputTokenCount) as cacheWriteTokens
| display @timestamp, modelName, temperature, maxTokens,
          inputTokens, outputTokens, totalTokens,
          cacheReadTokens, cacheWriteTokens
| sort @timestamp desc
| limit 200
- アラーム: なし(ドリルダウンテーブル — 調査に使用)。
17. トークン数が多い上位 10 件のプロンプト
- 目的: トークン消費量が最も多い上位 10 件の呼び出しで、完全なリクエスト/レスポンスボディ、モデル名、トークン数、レイテンシーを含みます。これらは最もコストのかかる個別の呼び出しです。例: 上位のプロンプトが 15,000 トークンを使用し、レイテンシーが 8 秒の場合、実際のプロンプトテキストを確認すると、検索を使用する代わりにナレッジベース全体をコンテキストに詰め込んでいることがわかります。Bedrock モデル呼び出しログ設定で「リクエストおよびレスポンスボディのログ記録」を有効にする必要があります。
- ソース:
bedrock-model-invocation-logging - 表示: テーブル
- クエリ言語: CloudWatch Logs Insights
- クエリ:
filter !isPresent(errorCode)
| fields jsonParse(@message) as json_message,
    replace(replace(replace(modelId,
      "arn:aws:bedrock:us-east-1:ACCOUNT_ID:inference-profile/us.", ""),
      "arn:aws:bedrock:us-east-1:ACCOUNT_ID:inference-profile/", ""),
      "arn:aws:bedrock:us-east-1:ACCOUNT_ID:", "") as modelName
| unnest json_message.input into inputMessage
| unnest json_message.output into outputMessage
| display requestId, timestamp, modelName, inputMessage, outputMessage,
    coalesce(input.inputTokenCount, 0) as inputTokenCount,
    coalesce(output.outputTokenCount, 0) as outputTokenCount,
    coalesce(input.inputTokenCount, 0) + coalesce(output.outputTokenCount, 0) as totalTokenCount,
    (output.outputBodyJson.metrics.latencyMs / 1000) as latency
| sort totalTokenCount desc
| limit 10
- アラーム: 合計トークン数が 20,000 を超える単一の呼び出し — プロンプト設計を見直してください。
モデル料金リファレンス
これらの価格はスナップショットであり、最新でない場合があります。AWS は Bedrock の料金を定期的に更新し、新しいモデルを追加しています。常にAWS Bedrock の料金ページで現在の料金を確認し、更新してください。 strcontains クエリ内の乗数を適宜調整してください。
料金はトークンごと(1K または 1M トークンごとではありません)です。更新するには、Bedrock の料金ページでモデルを見つけ、1M トークンあたりの料金をトークンごとの料金に変換し(1,000,000 で割る)、対応する値を置き換えます。 strcontains 各コスト クエリのブロック。
| モデル | 入力 ($/token) | 出力 ($/token) |
|---|---|---|
| Nova Micro | 0.000000035 | 0.00000014 |
| Nova Lite | 0.00000006 | 0.00000024 |
| Nova Pro | 0.0000008 | 0.0000032 |
| Claude Sonnet 4.6 | 0.000003 | 0.000015 |
| Claude Sonnet 4.5 | 0.000003 | 0.000015 |
| Claude Sonnet 4 | 0.000003 | 0.000015 |
| Claude Haiku 4.5 | 0.000001 | 0.000005 |
| Llama 4 Maverick | 0.0000002 | 0.0000002 |
| Llama 4 Scout | 0.00000015 | 0.00000015 |
| Cohere Command R+ | 0.0000025 | 0.00001 |
| Cohere Command R | 0.00000015 | 0.0000006 |
| GPT OSS 120B | 0.00000009 | 0.00000045 |
| GPT OSS 20B | 0.00000004 | 0.0000002 |
アラームの推奨事項
DevOps アラーム
| アラーム | 条件 | 重要度 |
|---|---|---|
| 完了率の低下 | ok / (ok + truncated) が 2 時間にわたり 95% を下回る | Warning |
| トークンの無駄遣い | 呼び出し元が 24 時間で 100K を超える無駄なトークンを使用 | Warning |
| クロスリージョンレイテンシー | リージョン内でモデル P95 が 10 秒を超える | Warning |
| エージェントエラー率 | error_spans / total_traces が 15 分間 10% を超える | Critical |
| コンポーネントエラー | コンポーネントが 15 分間に 10 件を超えるエラー | Critical |
| コンポーネントレイテンシー | コンポーネント P95 が 5000ms を超える | Warning |
FinOps アラーム
| アラーム | 条件 | 重要度 |
|---|---|---|
| 日次コストの急増 | 1 日のコストが 7 日間平均の 150% を超える | Warning |
| 時間別コスト異常 | 時間別コストが時間平均の 3 倍を超える | Warning |
| コストの集中 | 単一モデルが総支出の 60% を超える | Warning |
| トークン量の急増 | 合計トークンが 1 時間でベースラインの 2 倍を超える | Warning |
| エラー率によるコストの無駄 | エラー率が 5% を超える(失敗した呼び出しに課金) | Warning |
| ロール別予算 | いずれかのロールの 1 日の支出が 7 日間平均の 2 倍を超える | Warning |
| トークン比率の不均衡 | 入力:出力の比率が 20:1 を超える状態が 1 時間継続 | Warning |
| 高トークン呼び出し | 単一の呼び出しが 20,000 トークンを超える | Warning |
追加リソース
- AWS 上の GenAI オブザーバビリティ — 関連ガイド: 戦略、パイプライン、有効化、ダッシュボード
- モデル呼び出し — CloudWatch
- AgentCore オブザーバビリティの開始方法
- CloudWatch Logs Insights クエリ構文
- CloudWatch Logs Insights における OpenSearch SQL
- AWS Bedrock 料金
コントリビューター: AWS Observability Team 最終更新日: 2026-04-21