Why X-Ray Customers Should Adopt Application Signals + Transaction Search
The Evolution of Observability Needs
As applications have grown in complexity and scale, customer observability requirements have evolved significantly. While AWS X-Ray has served as a reliable distributed tracing solution, the modern application landscape demands more comprehensive visibility.
Technical Architecture Differences
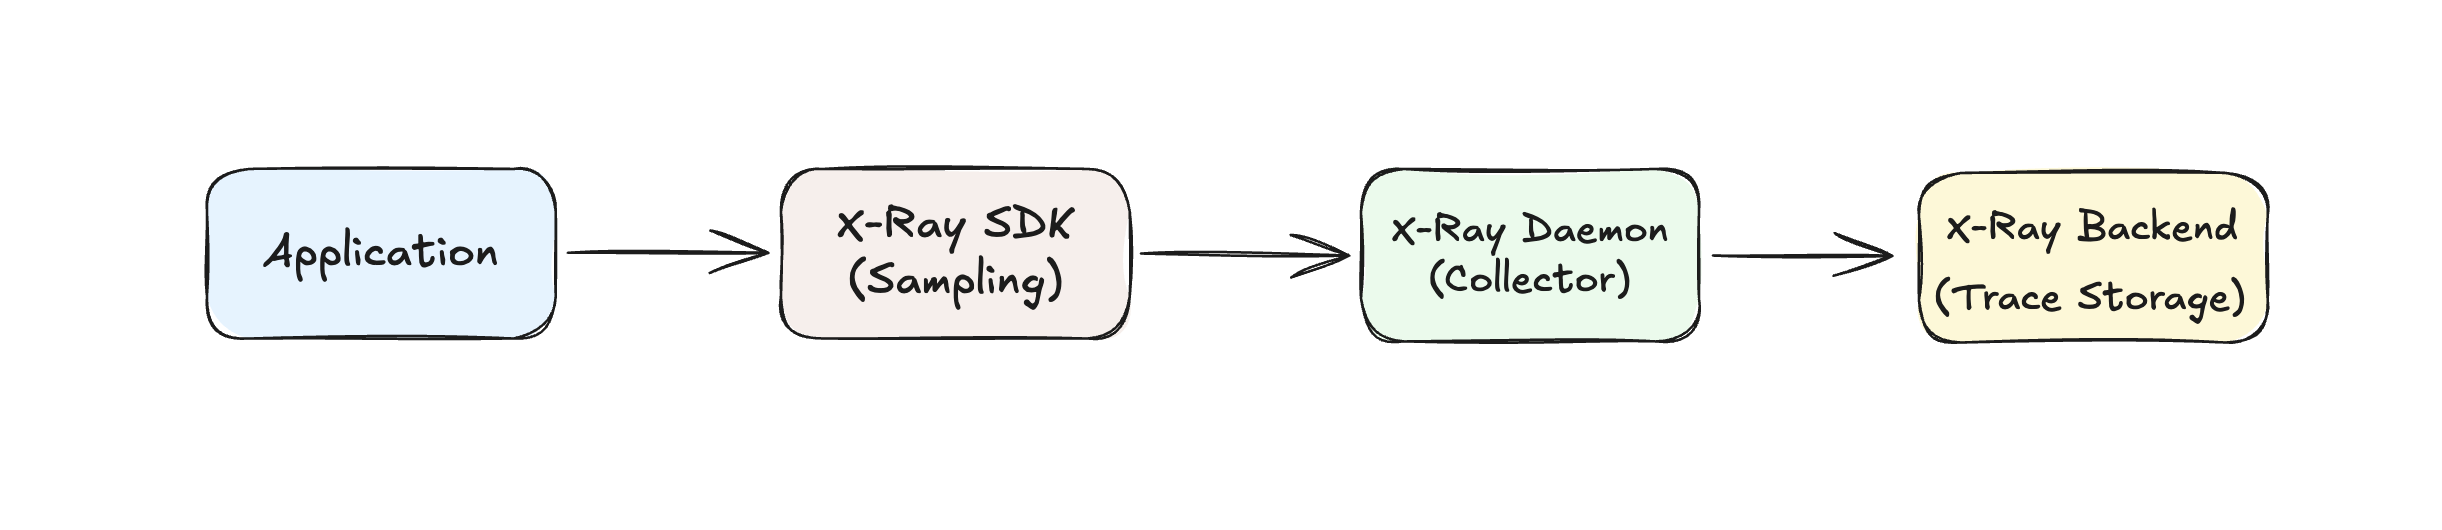
X-Ray Traditional Approach:
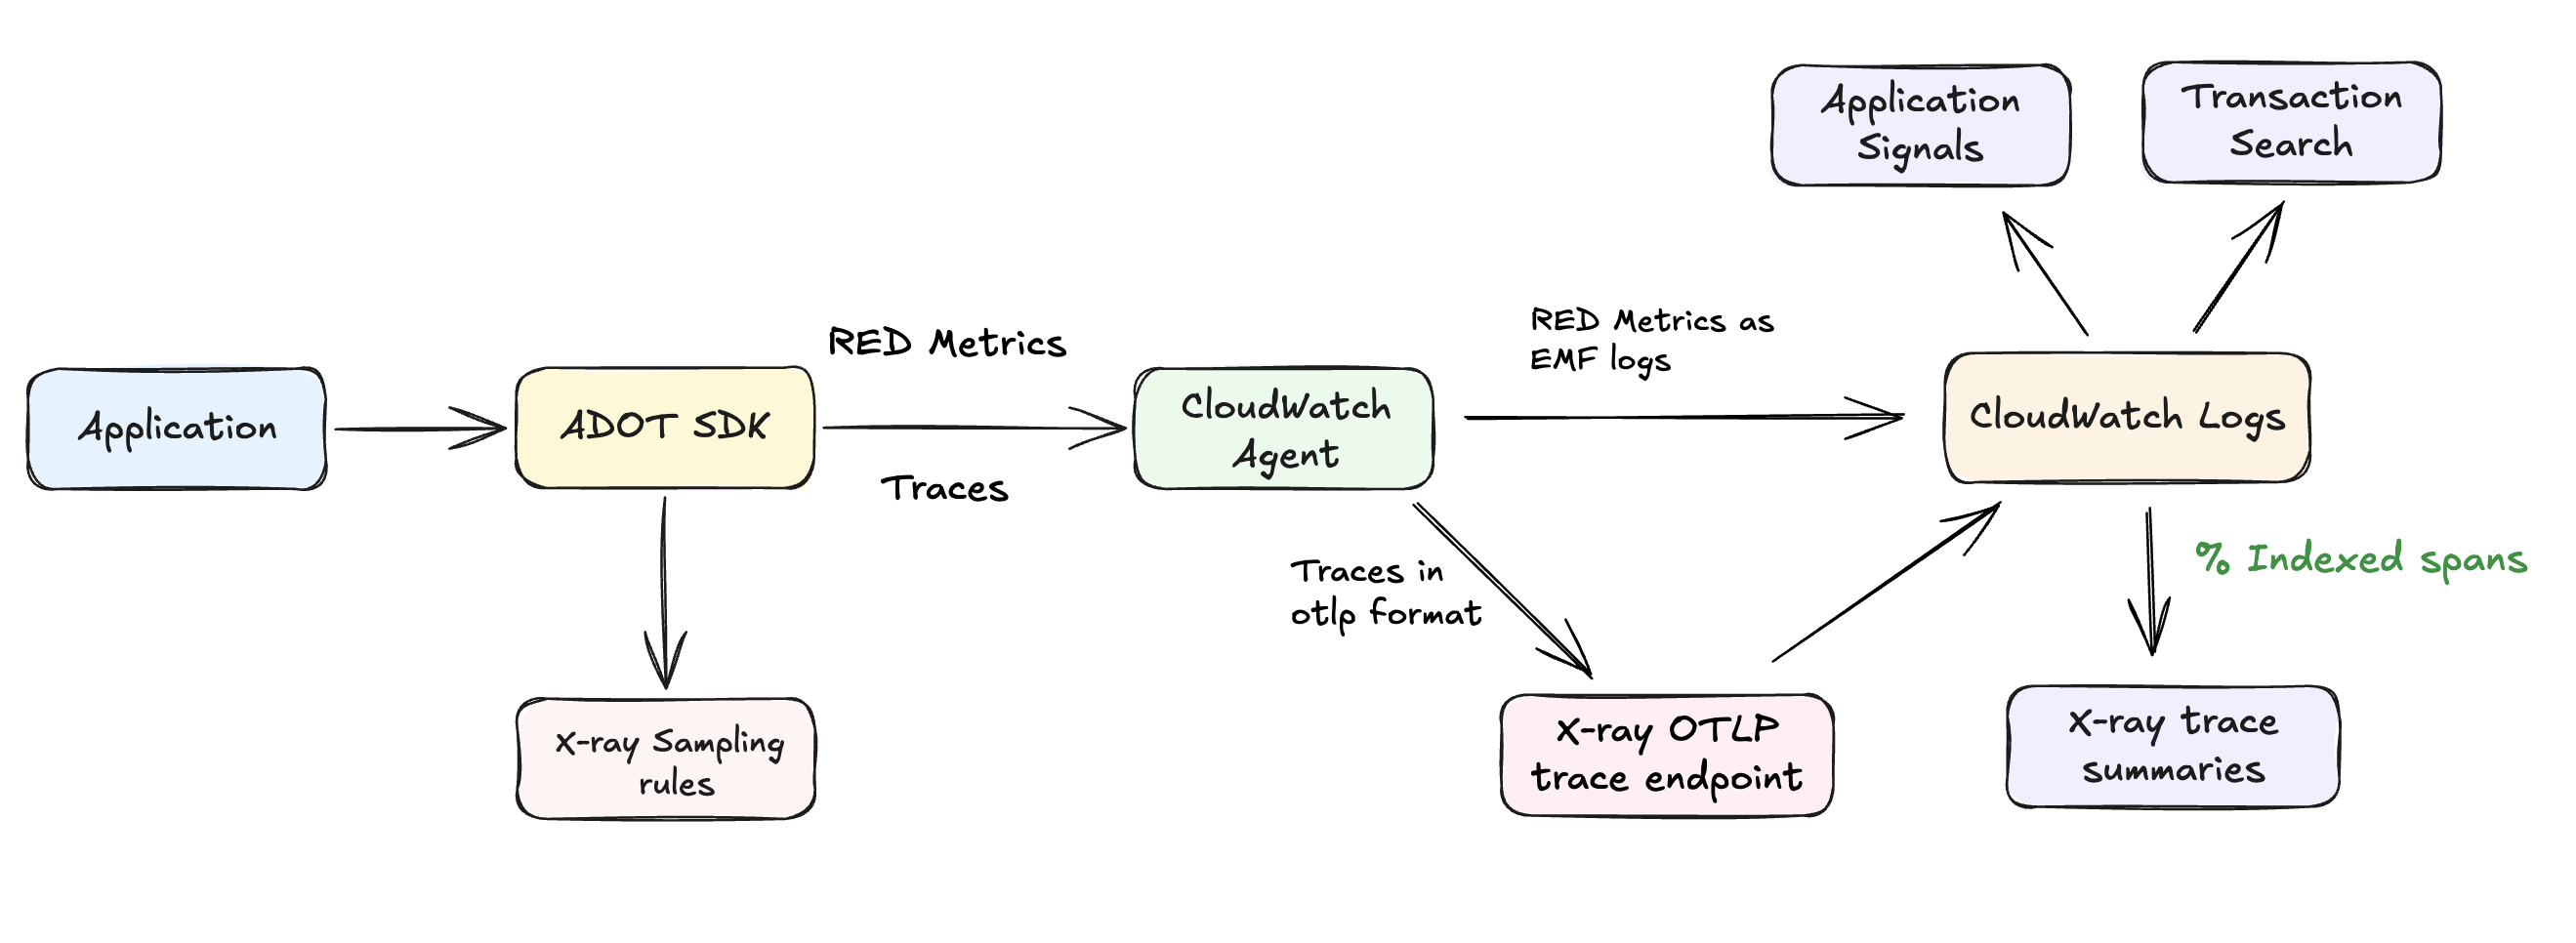
Application Signals + Transaction Search:
Key Migration Benefits
| Capability | X-Ray | Application Signals + Transaction Search |
|---|---|---|
| Data Ingestion | 100% of transactions (when configured) | 100% of transactions (when configured) |
| Throughput Limits | Subject to X-Ray service quotas at high volume | Higher throughput capacity with CloudWatch Logs |
| Cost Model | Per-trace pricing (expensive at 100%) | Application Signals Bundled pricing |
| Storage Format | X-Ray proprietary format | OpenTelemetry standard format |
| Storage Backend | X-Ray optimized storage | CloudWatch Logs with selective indexing |
| Analytics | X-Ray console only | Transaction Search + X-Ray trace analytics |
| Query Capabilities | X-Ray console and APIs | Transaction Search visual analytics + X-Ray |
| Indexing | All traces indexed | Selective indexing (configurable %) |
| Business Context | Limited custom attributes | Rich OTEL span attributes + business context |
Primary Value Propositions
1. Higher Throughput and Scalability
- CloudWatch Logs handles higher throughput than X-Ray, enabling customers to track all application events without hitting service limits
- Logs as storage for trace data removes X-Ray's throughput constraints for high-volume applications
- Scalable infrastructure designed for massive log ingestion volumes
2. Enhanced Analytics and Integration Capabilities
- Native CloudWatch Logs features available for span data analysis:
- Metrics Filters: Create custom metrics from span attributes and patterns
- Subscription Filters: Stream span data to other AWS services (Lambda, Kinesis, etc.)
- Log Insights: Advanced querying capabilities beyond traditional trace analysis
- Transaction Search provides advanced visual query interface for span-level analytics
- OTEL format enables richer business context in spans with custom attributes
3. Cost Effective 100% Sampling
- Bundled pricing makes complete visibility cost-effective compared to per-trace X-Ray pricing. Please see Example 13 in CloudWatch pricing page
- Predictable costs based on data volume, not trace count
- Selective indexing optimizes storage costs while maintaining complete data access
Leveraging CloudWatch Logs Features with Span Data
Since Transaction Search stores span data in CloudWatch Logs (aws/spans log group), you can leverage all native CloudWatch Logs capabilities:
Metrics Filters:
# Create custom metrics from span attributes
aws logs put-metric-filter \
  --log-group-name "aws/spans" \
  --filter-name "HighLatencyRequests" \
  --filter-pattern '[timestamp, request_id, span_id, trace_id, duration > 5000]' \
  --metric-transformations \
    metricName=HighLatencySpans,metricNamespace=CustomApp/Performance,metricValue=1
Subscription Filters:
# Stream span data to Lambda for real-time processing
aws logs put-subscription-filter \
  --log-group-name "aws/spans" \
  --filter-name "ErrorSpanProcessor" \
  --filter-pattern '[..., status_code="ERROR"]' \
  --destination-arn "arn:aws:lambda:region:account:function:ProcessErrorSpans"
Log Insights Queries:
-- Find all spans with specific business attributes
fields @timestamp, attributes.customer_id, attributes.order_value, duration
| filter attributes.service_name = "payment-service"
| filter attributes.customer_tier = "premium"
| stats avg(duration) by attributes.customer_id
| sort avg(duration) desc
Integration Opportunities:
- Real-time Alerting: Use subscription filters to trigger Lambda functions for immediate incident response
- Business Intelligence: Export span data to analytics platforms via Kinesis Data Streams
- Custom Dashboards: Create CloudWatch dashboards using metrics derived from span attributes
- Compliance Auditing: Use Log Insights to query spans for regulatory compliance reporting