Pushing Metrics from EKS to Prometheus
When running containerized workloads on Amazon Elastic Kubernetes Service (EKS), you can leverage AWS Managed Prometheus (AMP) to collect and analyze metrics from your applications and infrastructure. AMP simplifies the deployment and management of Prometheus-compatible monitoring by providing a fully managed Prometheus-compatible monitoring solution.
To push metrics from your EKS containerized workloads to AMP, you can use the Managed Prometheus Collector configuration. The Managed Prometheus Collector is a component of AMP that scrapes metrics from your applications and services and sends them to the AMP workspace for storage and analysis.
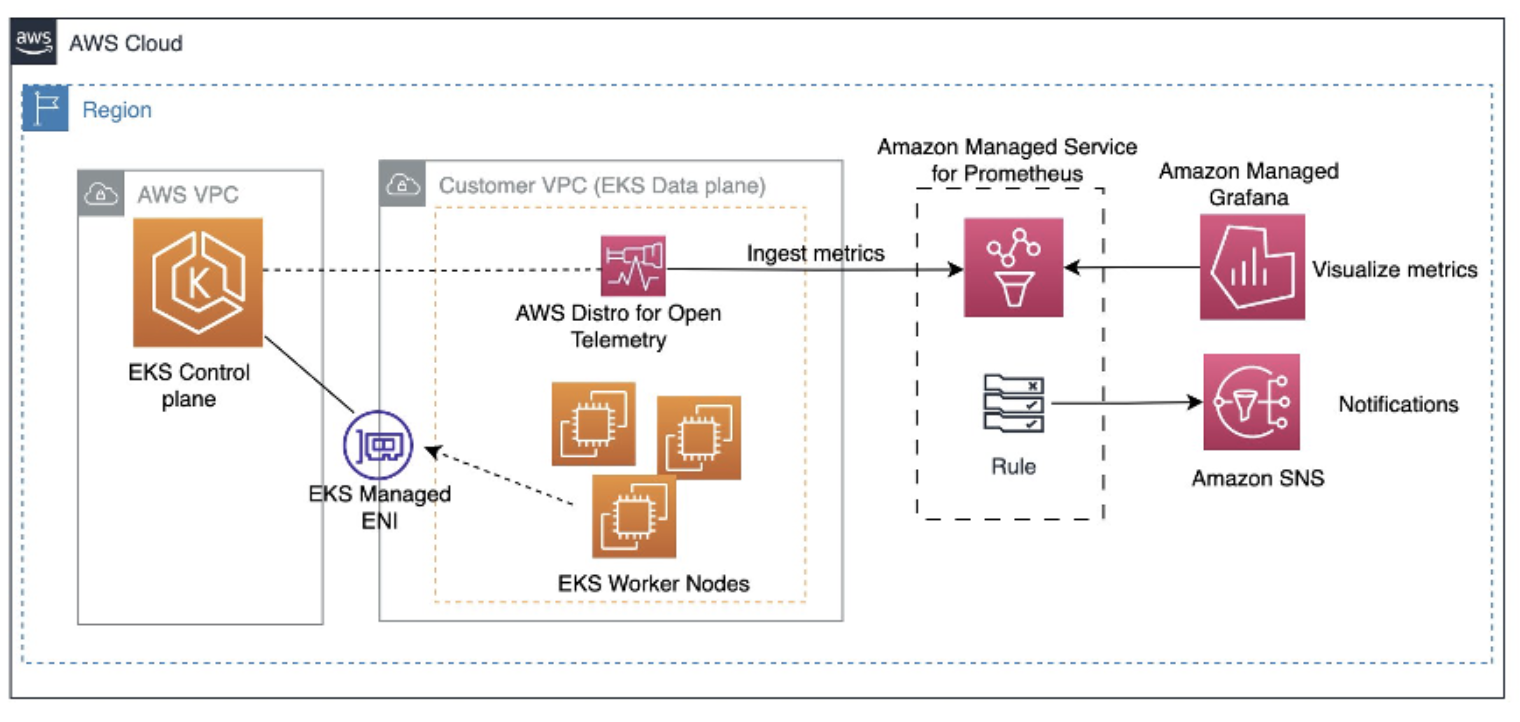 Figure 1: Sending metrics from EKS to AMP
Configuring Managed Prometheus Collector
-
Enable AMP Workspace: First, ensure that you have an AMP workspace created in your AWS account. If you haven't set up an AMP workspace yet, follow the AWS documentation to create one.
-
Configure Managed Prometheus Collector: Within your AMP workspace, navigate to the "Managed Prometheus Collectors" section and create a new collector configuration.
-
Define Scrape Configuration: In the collector configuration, specify the targets from which the collector should scrape metrics. For EKS workloads, you can define a Kubernetes service discovery configuration that allows the collector to dynamically discover and scrape metrics from your Kubernetes Pods and Services.
Example Kubernetes service discovery configuration:
kubernetes_sd_configs:
  - role: pod
    namespaces:
      names:
        - namespace1
        - namespace2
This configuration instructs the collector to scrape metrics from Pods running in the namespace1 and namespace2 Kubernetes namespaces.
- Configure Prometheus Annotations: To enable metric collection from your containerized workloads, you need to annotate your Kubernetes Pods or Services with the appropriate Prometheus annotations. These annotations provide information about the metrics endpoint and other configuration settings. Example Prometheus annotations:
annotations:
  prometheus.io/scrape: "true"
  prometheus.io/port: "8080"
  prometheus.io/path: "/metrics"
These annotations indicate that the Prometheus collector should scrape metrics from the /metrics endpoint on port 8080 of the Pod or Service.
-
Deploy Workloads with Instrumentation: Deploy your containerized workloads to EKS, ensuring that they expose the appropriate metrics endpoints and include the necessary Prometheus annotations. You can use tools like Minikube, Helm, or AWS Cloud Development Kit (CDK) to deploy and manage your EKS workloads.
-
Verify Metric Collection: Once the Managed Prometheus Collector is configured and your workloads are deployed, you should see the collected metrics appearing in the AMP workspace. You can use the AMP query editor to explore and visualize the metrics from your EKS workloads.
Additional Considerations
-
Authentication and Authorization: AMP supports various authentication and authorization mechanisms, including IAM roles and service accounts, to secure access to your monitoring data.
-
Integration with AWS Observability Services: You can integrate AMP with other AWS observability services, such as AWS CloudWatch and AWS X-Ray, for comprehensive observability across your AWS environment.
By leveraging the Managed Prometheus Collector in AMP, you can efficiently collect and analyze metrics from your EKS containerized workloads without the need to manage and scale the underlying Prometheus infrastructure. AMP provides a fully managed and scalable solution for monitoring your EKS applications and infrastructure.