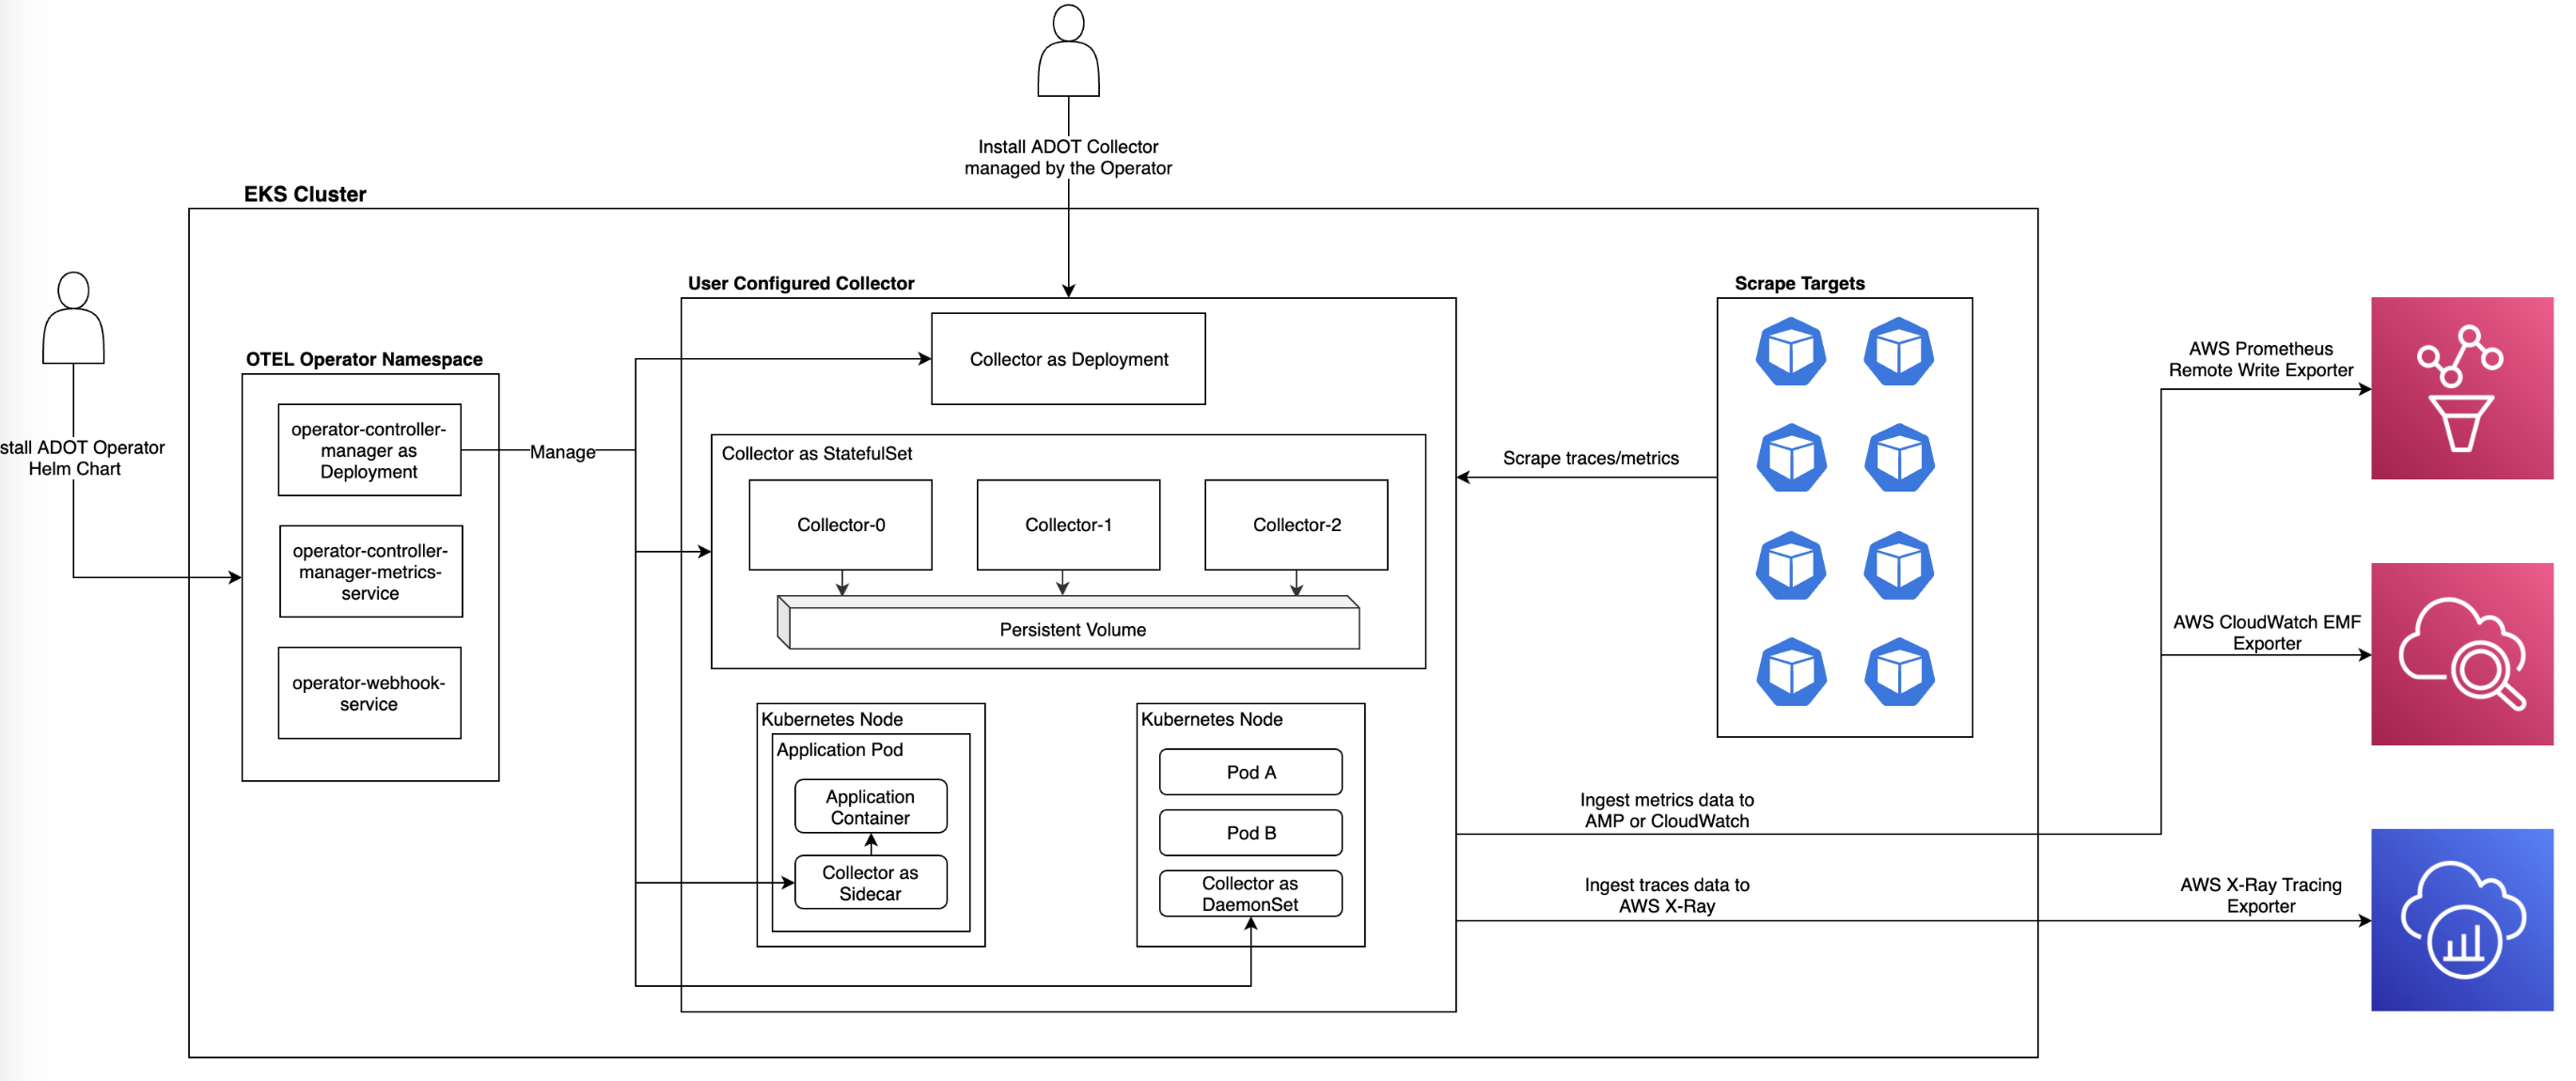
ADOT Observability Pipeline
The observability pipeline consists of several components that work together to collect, manage, and analyze observability data from various sources.
EKS Cluster
The EKS (Elastic Kubernetes Service) cluster hosts the main components of the observability pipeline.
Install ADOT Operator Helm Chart
The ADOT (AWS Distro for OpenTelemetry) Operator is installed using a Helm chart. It manages the deployment and configuration of the observability pipeline components.
User Configured Collector
The user-configured collector is managed by the operator and consists of the following components:
- Collector as Deployment: The collector is deployed as a Kubernetes deployment, which ensures high availability and scalability.
- Collector-0, Collector-1, Collector-2: Multiple collector instances are deployed to handle the incoming observability data. They work together to distribute the workload and ensure reliable data collection.
 Figure 1: OpenTelemetry Pipleine
Persistent Volume
The persistent volume is used to store the collected observability data. It ensures data durability and allows for long-term storage and analysis.
Kubernetes Node
The Kubernetes node hosts the application pods and the collector as a sidecar.
- Application Container: The application container runs the actual application code and generates observability data.
- Collector as Sidecar: The collector runs as a sidecar container alongside the application container. It collects the observability data generated by the application.
Scrape Targets
The observability pipeline collects data from various scrape targets, such as:
- Scrape traces/metrics: The pipeline scrapes traces and metrics from the application and infrastructure components.
AWS Prometheus Remote Write Exporter
The AWS Prometheus Remote Write Exporter is used to export the collected observability data to AWS services.
AWS CloudWatch EMF Exporter
The AWS CloudWatch EMF (Embedded Metric Format) Exporter is used to export metrics to AWS CloudWatch.
AWS X-Ray Tracing Exporter
The AWS X-Ray Tracing Exporter is used to export tracing data to AWS X-Ray for distributed tracing and performance analysis.
The observability pipeline collects data from the scrape targets, processes it using the collectors, and exports it to various AWS services for further analysis and visualization.
Collecting Metrics and Insights with ADOT
-
Instrumentation: Similar to OpenTelemetry, ADOT provides libraries and SDKs to instrument your applications and services, capturing telemetry data such as metrics, traces, and logs.
-
Metrics Collection: ADOT supports collecting and exporting system and application-level metrics, including AWS service metrics, providing insights into resource utilization and application performance.
-
Distributed Tracing: ADOT enables distributed tracing across AWS services, containers, and on-premises environments, allowing you to trace requests and operations end-to-end.
-
Logging: ADOT includes support for structured logging, correlating log data with other telemetry signals for comprehensive observability.
-
AWS Service Integrations: ADOT provides tight integrations with AWS services like AWS X-Ray, AWS CloudWatch, Amazon Managed Service for Prometheus, and AWS Distro for OpenTelemetry Operator, enabling seamless telemetry collection and analysis within the AWS ecosystem.
-
Automatic Instrumentation: ADOT offers automatic instrumentation capabilities for popular frameworks and libraries, simplifying the process of instrumenting existing applications.
-
Data Processing and Analysis: Telemetry data collected by ADOT can be exported to AWS observability services like AWS X-Ray, Amazon Managed Service for Prometheus, and AWS CloudWatch, leveraging AWS-native analysis and visualization tools.
Benefits of Using ADOT
-
AWS-Native Integration: ADOT is designed to seamlessly integrate with AWS services and infrastructure, providing a cohesive observability experience within the AWS ecosystem.
-
Performance and Scalability: ADOT is optimized for performance and scalability, enabling efficient telemetry collection and analysis in large-scale AWS environments.
-
Security and Compliance: ADOT adheres to AWS security best practices and is compliant with various industry standards, ensuring secure and compliant observability practices.
-
AWS Support: As an AWS-supported distribution, ADOT benefits from AWS's extensive documentation, support channels, and long-term commitment to the OpenTelemetry project.
Difference between OpenTelemetry and ADOT
While ADOT and OpenTelemetry share many core capabilities, there are some key differences:
-
AWS Integration: ADOT is designed specifically for AWS environments and provides tight integrations with AWS services, while OpenTelemetry is a vendor-neutral project.
-
AWS Optimization: ADOT is optimized for performance, scalability, and security within AWS environments, leveraging AWS-native services and best practices.
-
AWS Support: ADOT benefits from official AWS support, documentation, and long-term commitment, while OpenTelemetry relies on community support.
-
AWS-Specific Features: ADOT includes AWS-specific features and automatic instrumentation for AWS services, while OpenTelemetry focuses on general-purpose observability.
-
Vendor Neutrality: OpenTelemetry is a vendor-neutral project, allowing integration with various observability platforms, while ADOT is primarily focused on AWS observability services.
By leveraging ADOT, organizations can achieve comprehensive observability within the AWS ecosystem, benefiting from AWS-native integrations, optimized performance, and AWS support, while still maintaining the flexibility to leverage OpenTelemetry capabilities and community contributions.