Observability with OpenTelemetry
OpenTelemetry is an open-source, vendor-neutral observability framework that provides a standardized way to collect and export telemetry data, including logs, metrics, and traces. By leveraging OpenTelemetry, organizations can implement a comprehensive observability pipeline while ensuring vendor independence and future-proofing their observability strategy.
Collecting Metrics and Insights with OpenTelemetry
-
Instrumentation: The first step in using OpenTelemetry is to instrument your applications and services with the OpenTelemetry libraries or SDKs. These libraries automatically capture and export telemetry data, such as metrics, traces, and logs, from your application code.
-
Metrics Collection: OpenTelemetry provides a standardized way to collect and export metrics from your application. These metrics can include system metrics (CPU, memory, disk usage), application-level metrics (request rates, error rates, latency), and custom business metrics specific to your application.
-
Distributed Tracing: OpenTelemetry supports distributed tracing, enabling you to trace requests and operations as they propagate through your distributed system. This provides valuable insights into the end-to-end flow of requests, identifying bottlenecks, and troubleshooting performance issues.
-
Logging: While OpenTelemetry's primary focus is on metrics and traces, it also provides a structured logging API that can be used to capture and export log data. This ensures that logs are correlated with other telemetry data, providing a holistic view of your system's behavior.
-
Exporters: OpenTelemetry supports various exporters that allow you to send telemetry data to different backends or observability platforms. Popular exporters include Prometheus, Jaeger, Zipkin, and cloud-native observability solutions like AWS CloudWatch, Azure Monitor, and Google Cloud Operations.
-
Data Processing and Analysis: Once the telemetry data is exported, you can leverage observability platforms, monitoring tools, or custom data processing pipelines to analyze and visualize the collected metrics, traces, and logs. This analysis can provide insights into system performance, identify bottlenecks, and aid in troubleshooting and root cause analysis.
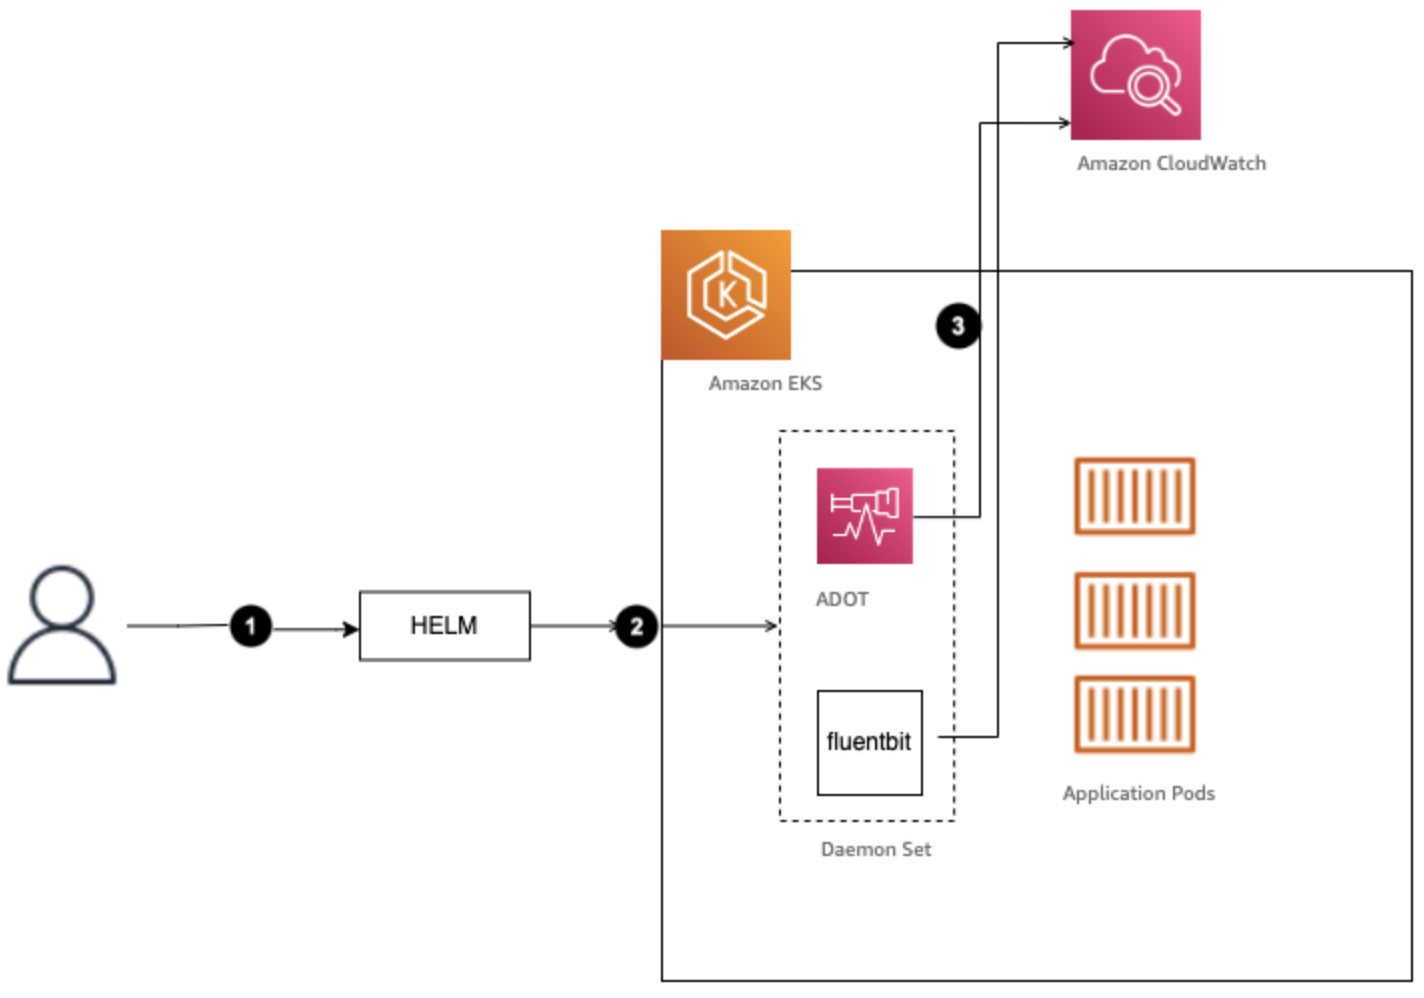
 Figure 1: EKS Cluster sending observability signals with ADOT and FluentBit
Benefits of Using OpenTelemetry
-
Vendor Neutrality: OpenTelemetry is an open-source, vendor-neutral project, ensuring that your observability strategy is not tied to a specific vendor or platform. This flexibility allows you to switch between observability backends or combine multiple solutions as needed.
-
Standardization: OpenTelemetry provides a standardized way of collecting and exporting telemetry data, enabling consistent data formats and interoperability across different components and systems.
-
Future-Proofing: By adopting OpenTelemetry, you can future-proof your observability strategy. As the project evolves and new features and integrations are added, your existing instrumentation can be easily updated without the need for significant code changes.
-
Comprehensive Observability: OpenTelemetry supports multiple telemetry signals (metrics, traces, and logs), providing a comprehensive view of your system's behavior and performance.
-
Ecosystem and Community Support: OpenTelemetry has a growing ecosystem of integrations, tools, and a vibrant community of contributors, ensuring continued development and support.
By leveraging OpenTelemetry for observability, organizations can gain deep insights into their systems, enabling proactive monitoring, efficient troubleshooting, and data-driven decision-making, while maintaining flexibility and vendor independence in their observability strategy.