オブザーバビリティと OpenTelemetry
OpenTelemetry は、オープンソースでベンダーに依存しないオブザーバビリティフレームワークで、ログ、メトリクス、トレースなどのテレメトリーデータを収集およびエクスポートするための標準化された方法を提供します。
OpenTelemetry を活用することで、組織はベンダーからの独立性を確保し、将来を見据えたオブザーバビリティ戦略を実現しながら、包括的なオブザーバビリティパイプラインを実装できます。
OpenTelemetry によるメトリクスとインサイトの収集
-
計装: OpenTelemetry を使用する最初のステップは、OpenTelemetry ライブラリや SDK でアプリケーションやサービスを計装することです。これらのライブラリは、アプリケーションコードからメトリクス、トレース、ログなどのテレメトリデータを自動的にキャプチャしてエクスポートします。
-
メトリクスの収集: OpenTelemetry は、アプリケーションからメトリクスを収集してエクスポートする標準化された方法を提供します。これらのメトリクスには、システムメトリクス (CPU、メモリ、ディスク使用量)、アプリケーションレベルのメトリクス (リクエスト率、エラー率、レイテンシー)、およびアプリケーション固有のカスタムビジネスメトリクスが含まれます。
-
分散トレーシング: OpenTelemetry は分散トレーシングをサポートし、分散システム全体でのリクエストと操作の追跡を可能にします。これにより、リクエストのエンドツーエンドのフローに関する貴重なインサイトが得られ、ボトルネックの特定やパフォーマンスの問題のトラブルシューティングが可能になります。
-
ログ記録: OpenTelemetry の主な焦点はメトリクスとトレースに�ありますが、ログデータをキャプチャしてエクスポートするための構造化されたログ API も提供しています。これにより、ログが他のテレメトリデータと相関付けられ、システムの動作を包括的に把握することができます。
-
エクスポーター: OpenTelemetry は、テレメトリデータを異なるバックエンドやオブザーバビリティプラットフォームに送信できる様々なエクスポーターをサポートしています。一般的なエクスポーターには、Prometheus、Jaeger、Zipkin、および AWS CloudWatch、Azure Monitor、Google Cloud Operations などのクラウドネイティブなオブザーバビリティソリューションが含まれます。
-
データ処理と分析: テレメトリデータがエクスポートされると、オブザーバビリティプラットフォーム、モニタリングツール、またはカスタムデータ処理パイプラインを活用して、収集されたメトリクス、トレース、ログを分析および可視化できます。この分析により、システムパフォーマンスの把握、ボトルネックの特定、トラブルシューティングや根本原因分析に役立てることができます。
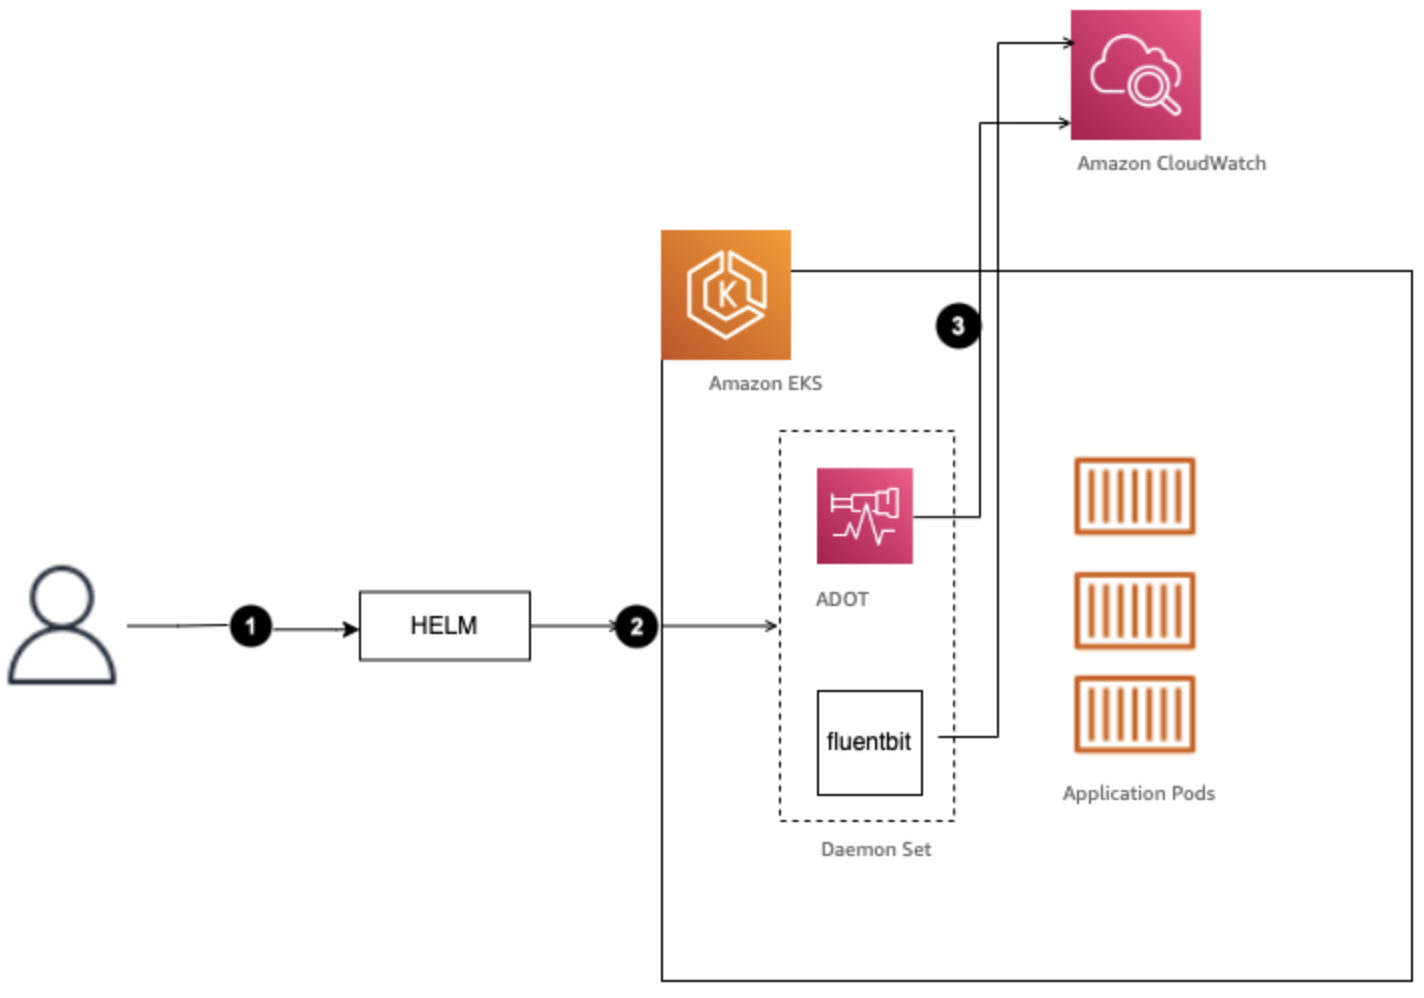 図 1: ADOT と FluentBit を使用してオブザーバビリティシグナルを送信する EKS クラスター
OpenTelemetry を使用するメリット
-
ベンダー中立性: OpenTelemetry はオープンソースのベンダー中立プロジェクトで、オブザーバビリティ戦略が特定のベンダーやプラットフォームに縛られないことを保証します。この柔軟性により、必要に応じてオブザーバビリティバックエンドの切り替えや、複数のソリューションの組み合わせが可能になります。
-
標準化: OpenTelemetry はテレメトリデータの収集とエクスポートを標準化された方法で提供し、異なるコンポーネントやシステム間で一貫したデータフォーマットと相互運用性を実現します。
-
将来性: OpenTelemetry を採用することで、オブザーバビリティ戦略の将来性を確保できます。プロジェクトが進化し、新機能や統合が追加されても、大幅なコード変更なしに既存の計装を簡単に更新できます。
-
包括的なオブザーバビリティ: OpenTelemetry は複数のテレメトリシグナル(メトリクス、トレース、ログ)をサポートし、システムの動作とパフォーマンスを包括的に把握できます。
-
エコシステムとコミュニティサポート: OpenTelemetry には、統合機能やツールが充実した成長中のエコシステムと活発なコントリビューターコミュニティがあり、継続的な開発とサポートが保証されています。
OpenTelemetry を活用することで、組織はシステムに関する深い洞察を得ることができ、プロアクティブなモニタリング、効率的なトラブルシューティング、データ駆動の意思決定が可能になります。同�時に、オブザーバビリティ戦略における柔軟性とベンダー独立性を維持することができます。