ADOT オブザーバビリティパイプライン
オブザーバビリティパイプラインは、さまざまなソースからオブザーバビリティデータを収集、管理、分析するために連携する複数のコンポーネントで構成されています。
EKS クラスター
EKS (Elastic Kubernetes Service) クラスターは、オブザーバビリティパイプラインの主要コンポーネントをホストします。
ADOT Operator Helm Chart のインストール
ADOT (AWS Distro for OpenTelemetry) Operator は Helm chart を使用してインストールされます。これはオブザーバビリティパイプラインのコンポーネントのデプロイと設定を管理します。
ユーザー設定のコレクター
ユーザー設定のコレクターはオペレーターによって管理され、以下のコンポーネントで構成されています:
- デプロイメントとしてのコレクター:コレクターは Kubernetes デプロイメントとして展開され、高可用性とスケーラビリティを確保します。
- Collector-0、Collector-1、Collector-2:複数のコレクターインスタンスが展開され、受信するオブザーバビリティデータを処理します。これらは連携して作業負荷を分散し、確実なデータ収集を実現します。
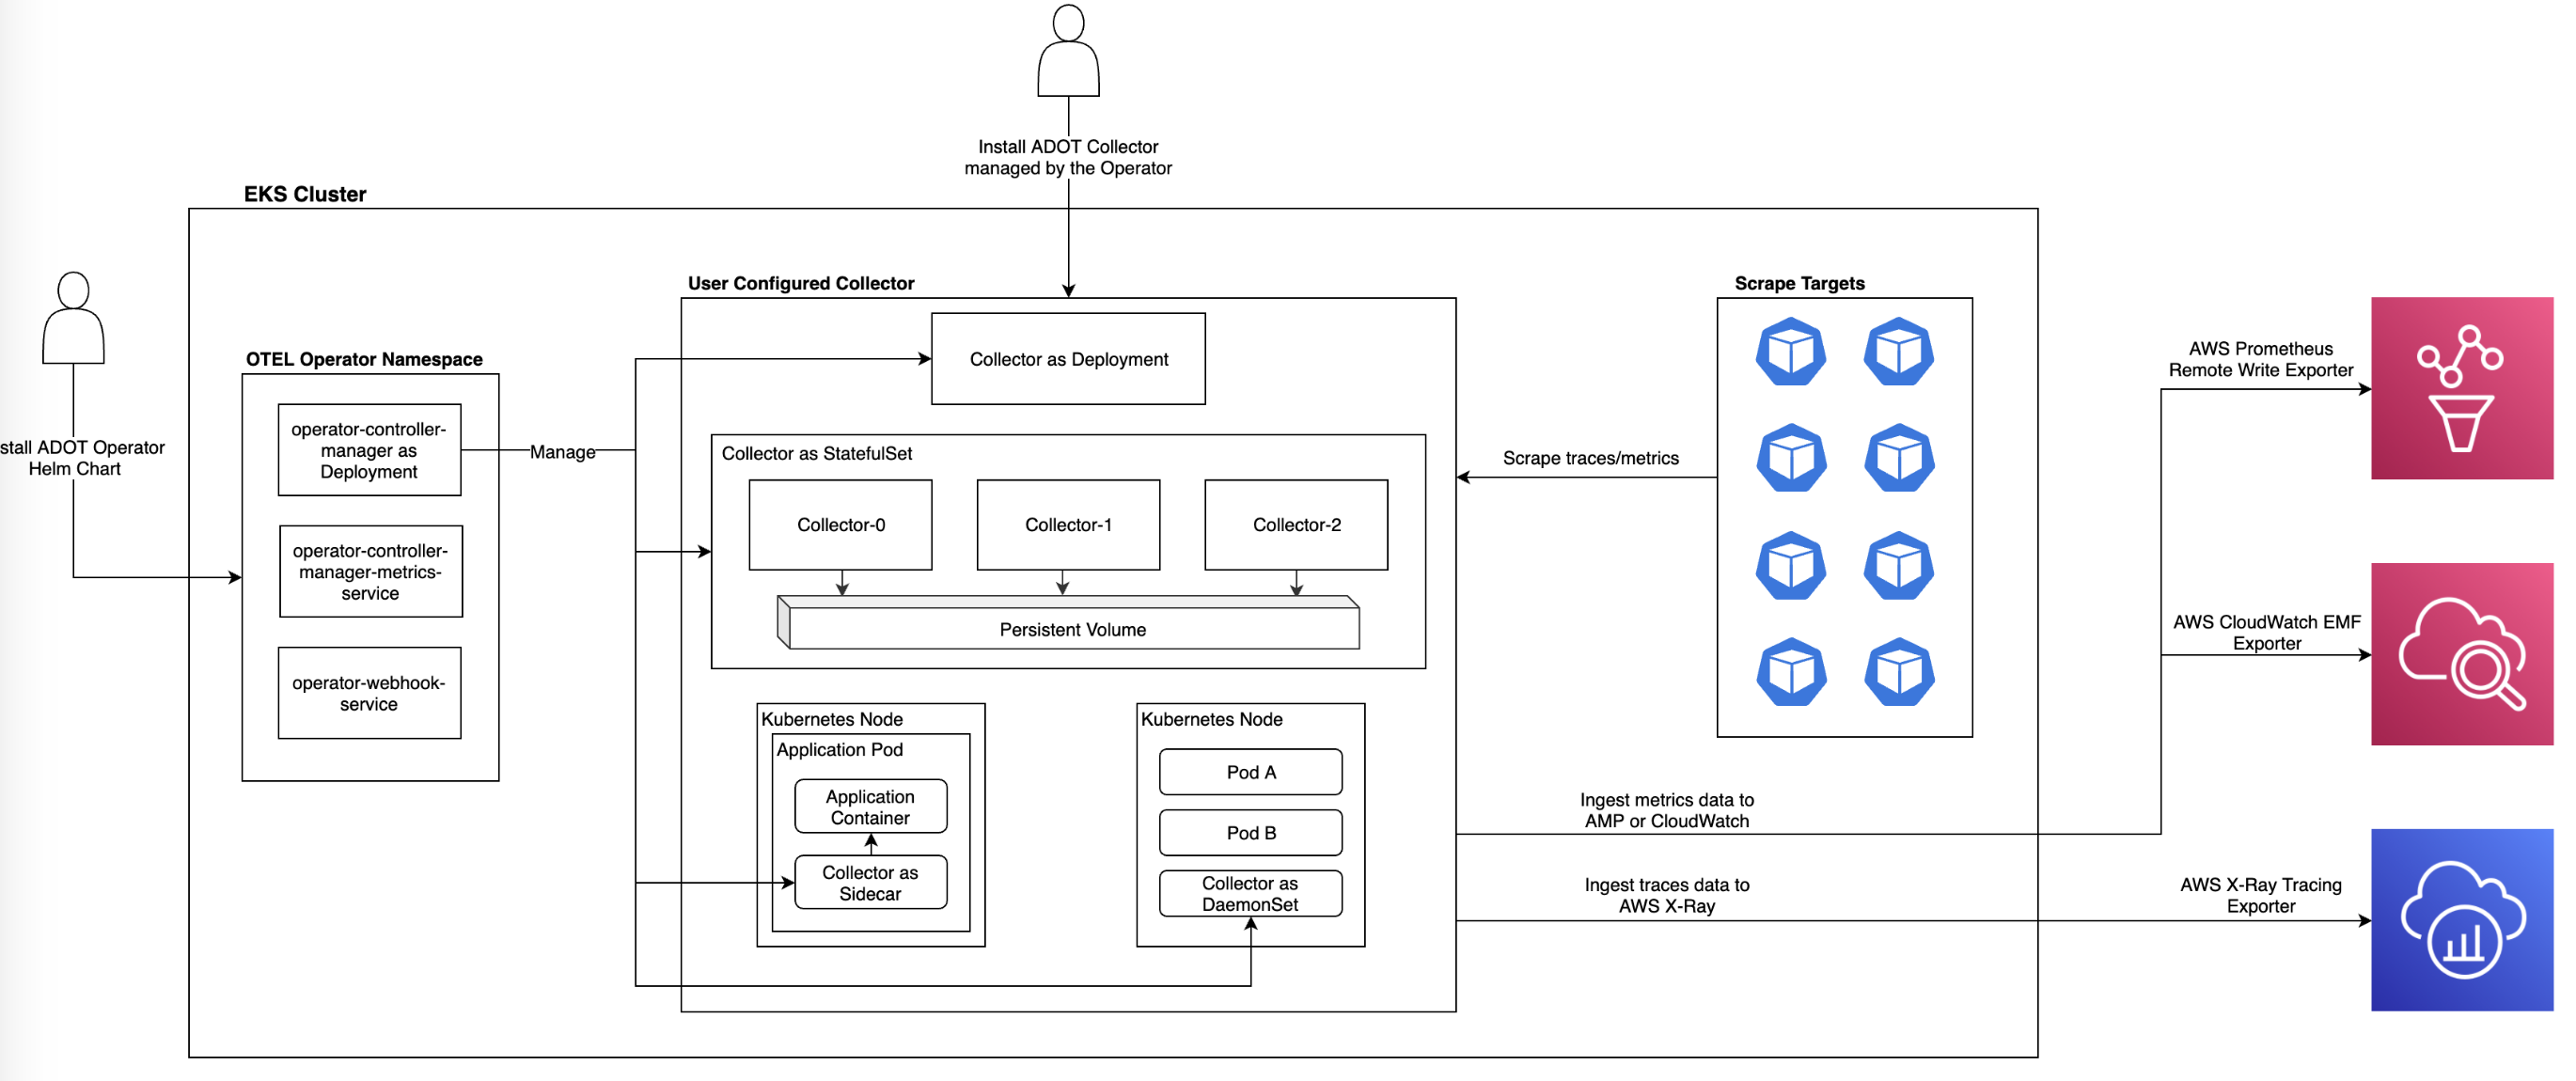 図 1:OpenTelemetry パイプライン
Persistent Volume
Persistent Volume は、収集したオブザーバビリティデータを保存するために使用されます。 データの永続性を確保し、長期的なストレージと分析を可能にします。
Kubernetes ノード
Kubernetes ノードは、アプリケーション Pod とサイドカーとしてのコレクターをホストします。
- アプリケーションコンテナ: アプリケーションコンテナは実際のアプリケーションコードを実行し、オブザーバビリティデータを生成します。
- サイドカーとしてのコレクター: コレクターはアプリケーションコンテナと並行してサイドカーコンテナとして実行されます。アプリケーションによって生成されたオブザーバビリティデータを収集します。
スクレイプターゲット
オブザーバビリティパイプラインは、以下のようなさまざまなスクレイプターゲットからデータを収集します:
- トレース/メトリクスのスクレイプ:パイプラインは、アプリケーションとインフラストラクチャコンポ�ーネントからトレースとメトリクスをスクレイプします。
AWS Prometheus Remote Write Exporter
AWS Prometheus Remote Write Exporter は、収集したオブザーバビリティデータを AWS サービスにエクスポートするために使用されます。
AWS CloudWatch EMF Exporter
AWS CloudWatch EMF (Embedded Metric Format) Exporter は、メトリクスを AWS CloudWatch にエクスポートするために使用されます。
AWS X-Ray トレースエクスポーター
AWS X-Ray トレースエクスポーターは、分散トレーシングとパフォーマンス分析のために、トレースデータを AWS X-Ray にエクスポートするために使用されます。
オブザーバビリティパイプラインは、スクレイプターゲットからデータを収集し、コレクターを使用してデータを処理し、さらなる分析と可視化のために様々な AWS サービスにエクスポートします。
ADOT によるメトリクスとインサイトの収集
-
計装: OpenTelemetry と同様に、ADOT はアプリケーションやサービスを計装するためのライブラリと SDK を提供し、メトリクス、トレース、ログなどのテレメトリデータを収集します。
-
メトリクス収集: ADOT は、AWS サービスのメトリクスを含むシステムレベルとアプリケーションレベルのメトリクスの収集とエクスポートをサポートし、リソース使用率とアプリケーションパフォーマンスに関するインサイトを提供します。
-
分散トレーシング: ADOT は AWS サービス、コンテナ、オンプレミス環境全体での分散トレーシングを可能にし、リクエストと操作をエンドツーエンドでトレースできます。
-
ログ記録: ADOT は構造化ログをサポートし、包括的なオブザーバビリティのために他のテレメトリシグナルとログデータを関連付けます。
-
AWS サービス統合: ADOT は AWS X-Ray、AWS CloudWatch、Amazon Managed Service for Prometheus、AWS Distro for OpenTelemetry Operator などの AWS サービスと緊密に統合され、AWS エコシステム内でシームレスなテレメトリ収集と分析を実現します。
-
自動計装: ADOT は一般的なフレームワークとライブラリの自動計装機能を提供し、既存のアプリケーションの計装プロセスを簡素化します。
-
データ処理と分析: ADOT によって収集されたテレメトリデータは、AWS X-Ray、Amazon Managed Service for Prometheus、AWS CloudWatch などの AWS オブザーバビリティサービスにエクスポートでき、AWS ネイティブの分析および可視化ツールを活用できます。
ADOT を使用するメリット
-
AWS ネイティブな統合: ADOT は AWS サービスとインフラストラクチャにシームレスに統合するように設計されており、AWS エコシステム内で一貫したオブザーバビリティを提供します。
-
パフォーマンスとスケーラビリティ: ADOT はパフォーマンスとスケーラビリティに最適化されており、大規模な AWS 環境でも効率的なテレメトリの収集と分析を実現します。
-
セキュリティとコンプライアンス: ADOT は AWS のセキュリティベストプラクティスに準拠し、さまざまな業界標準に適合しており、安全でコンプライアンスに準拠したオブザーバビリティを実現します。
-
AWS のサポート: AWS がサポートする配布版として、ADOT は AWS の広範なドキュメント、サポートチャネル、OpenTelemetry プロジェクトへの長期的なコミットメントの恩恵を受けています。
OpenTelemetry と ADOT の違い
ADOT と OpenTelemetry は多くの主要な機能を共有していますが、いくつかの重要な違いがあります:
-
AWS との統合: ADOT は AWS 環境向けに特別に設計され、AWS サービスとの緊密な統合を提供します。一方、OpenTelemetry はベンダーに依存しないプロジェクトです。
-
AWS の最適化: ADOT は、AWS ネイティブサービスとベストプラクティスを活用し、AWS 環境内でのパフォーマンス、スケーラビリティ、セキュリティに最適化されています。
-
AWS のサポート: ADOT は AWS の公式サポート、ドキュメント、長期的なコミットメントを受けられます。一方、OpenTelemetry はコミュニティサポートに依存しています。
-
AWS 固有の機能: ADOT には AWS 固有の機能と AWS サービスの自動計装が含まれています。一方、OpenTelemetry は汎用的なオブザーバビリティに重点を置いています。
-
ベンダーの中立性: OpenTelemetry はベンダーに依存しないプロジェクトで、様々なオブザーバビリティプラットフォームとの統合が可能です。一方、ADOT は主に AWS のオブザーバビリティサービスに焦点を当てています。
ADOT を活用することで、組織は AWS エコシステム内で包括的なオブザーバビリティを実現できます。AWS ネイティブの統合、最適化されたパフォーマンス、AWS のサポートを活用しながら、OpenTelemetry の機能とコミュニティの貢献を活用する柔軟性も維持できます。