AWS における Big Data オブザーバビリティ
この図は、AWS 上の Spark ビッグデータワークフローにおけるオブザーバビリティの実装のベストプラクティスパターンを示しています。このパターンでは、Spark ジョブによって生成されるログとメトリクスを収集、処理、分析するために、さまざまな AWS サービスを活用しています。
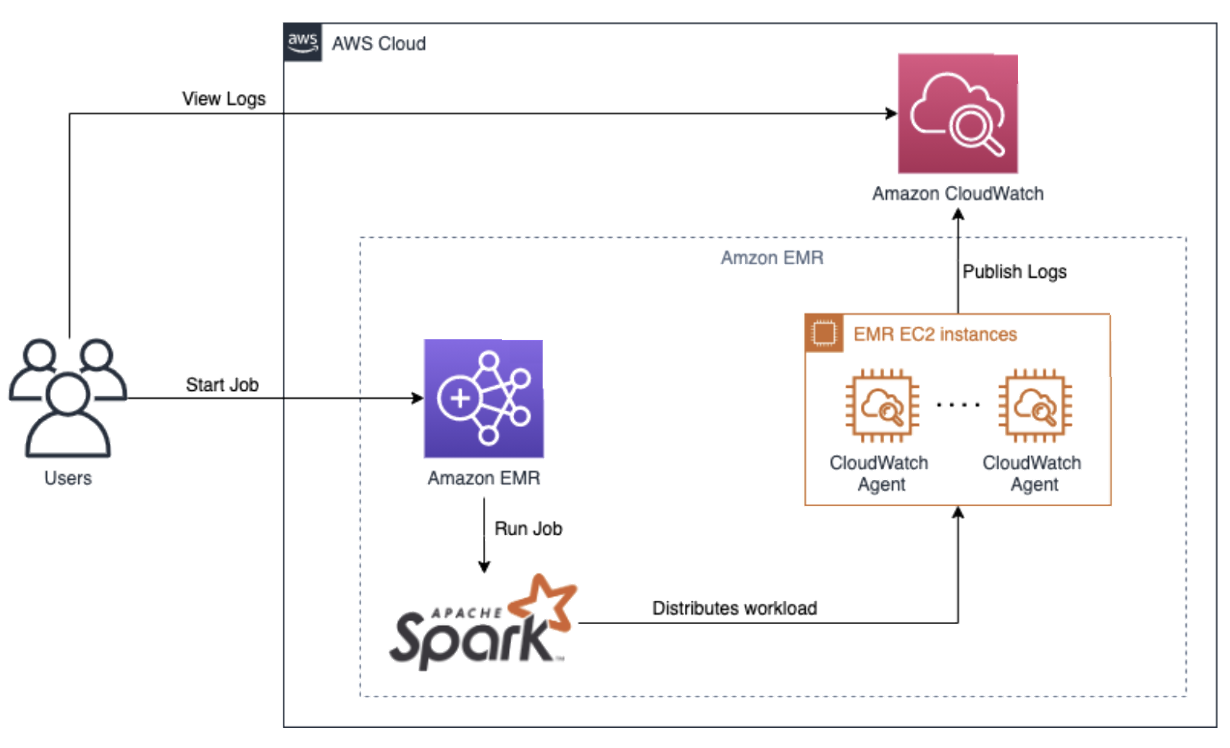 図 1: Spark ビッグデータのオブザーバビリティ
ワークフロー
- ユーザーは Amazon EMR クラスターに Spark ジョブを送信します。
- Amazon EMR クラスターは Spark ジョブを実行し、Apache Spark を使用してクラスター全体にワークロードを分散させます。
- Spark ジョブの実行中、ログとメトリクスが生成され、Amazon CloudWatch と Amazon EMR によって収集されます。
オブザーバビリティのコンポーネント
Amazon EMR
Amazon EMR は、AWS 上で Apache Spark などのビッグデータフレームワークの実行を簡素化するマネージドサービスです。 大量のデータを処理するための、スケーラブルで費用対効果の高いプラットフォームを提供します。
Amazon CloudWatch
Amazon CloudWatch は、さまざまな AWS リソースとアプリケーションからメトリクス、ログ、イベントを収集し追跡するモニタリングとオブザーバビリティのサービスです。このパターンでは、CloudWatch は以下の用途で使用されます:
- Spark ジョブを実行している EMR EC2 インスタンス からログとメトリクスを収集します。
- 収集したログを一元管理と分析のために Amazon CloudWatch Logs に発行します。
EMR EC2 インスタンス
Spark ジョブは EMR EC2 インスタンス上で実行されます。これらは EMR クラスターのコンピュートノードです。 これらのインスタンスは、CloudWatch Agent によって収集され、Amazon CloudWatch に送信されるログとメトリクスを生成します。
ベスト プラクティス
AWS 上の Spark ビッグデータワークロードのオブザーバビリティを効果的に確保するために、以下のベストプラクティスを検討してください:
-
集中ログ管理: Amazon CloudWatch Logs を使用して、Spark ジョブと EMR インスタンスから生成されるログの収集、保存、�分析を一元化します。これにより、Spark ワークフローのトラブルシューティングとモニタリングが容易になります。
-
メトリクスの収集: CloudWatch エージェントを活用して、CPU 使用率、メモリ使用量、ディスク I/O などの EMR EC2 インスタンスから関連するメトリクスを収集します。これらのメトリクスは、Spark ジョブのパフォーマンスと健全性に関する洞察を提供します。
-
ダッシュボードとアラーム: CloudWatch ダッシュボードを作成して、主要なメトリクスとログをリアルタイムで可視化します。特定のしきい値や異常が検出された場合に通知とアラートを行うように CloudWatch アラームを設定し、プロアクティブなモニタリングとインシデント対応を可能にします。
-
ログ分析: Amazon CloudWatch Logs Insights を利用するか、他のログ分析ツールと統合して、アドホッククエリの実行、問題のトラブルシューティング、収集したログからの有用な洞察の獲得を行います。
-
パフォーマンスの最適化: 収集したメトリクスとログを使用して、Spark ジョブのパフォーマンスを継続的にモニタリングおよび分析します。ボトルネックを特定し、リソース割り当てを最適化し、Spark の設定を調整して、ビッグデータワークロードの効率性とパフォーマンスを向上させます。
このオブザーバビリティパターンを実装し、ベストプラクティスに従うことで、組織は AWS 上の Spark ビッグデータワークロードを効果的にモニタリング、トラブルシューティング、最適化し、スケーラブルで信頼性の高い効率�的なデータ処理を確保できます。