CloudWatch Container Insights
はじめに
Amazon CloudWatch Container Insights は、コンテナ化されたアプリケーションとマイクロサービスからメトリクスとログを収集、集約、要約するための強力なツールです。 このドキュメントでは、EKS Fargate ワークロードにおける ADOT と CloudWatch Container Insights の統合について、その設�計、デプロイプロセス、利点を含めて概要を説明します。
EKS Fargate 向け ADOT Collector の設計
ADOT Collector は、以下の 3 つの主要コンポーネントで構成されるパイプラインアーキテクチャを使用します:
- Receivers:指定された形式でデータを受け入れ、内部形式に変換します。
- Processors:データのバッチ処理、フィルタリング、変換などのタスクを実行します。
- Exporters:メトリクス、ログ、トレースの送信先を決定します。
EKS Fargate では、ADOT Collector は Prometheus Receiver を使用して、ワーカーノード上の kubelet のプロキシとして機能する Kubernetes API サーバーからメトリクスをスクレイピングします。 これは、kubelet への直接アクセスを妨げる EKS Fargate のネットワーク制限により必要なアプローチです。 収集されたメトリクスは、フィルタリング、名前の変更、データの集約、変換のための一連の Processors を通過します。 最後に、AWS CloudWatch EMF Exporter がメトリクスを埋め込みメトリクス形式 (EMF) に変換し、CloudWatch Logs に送信します。
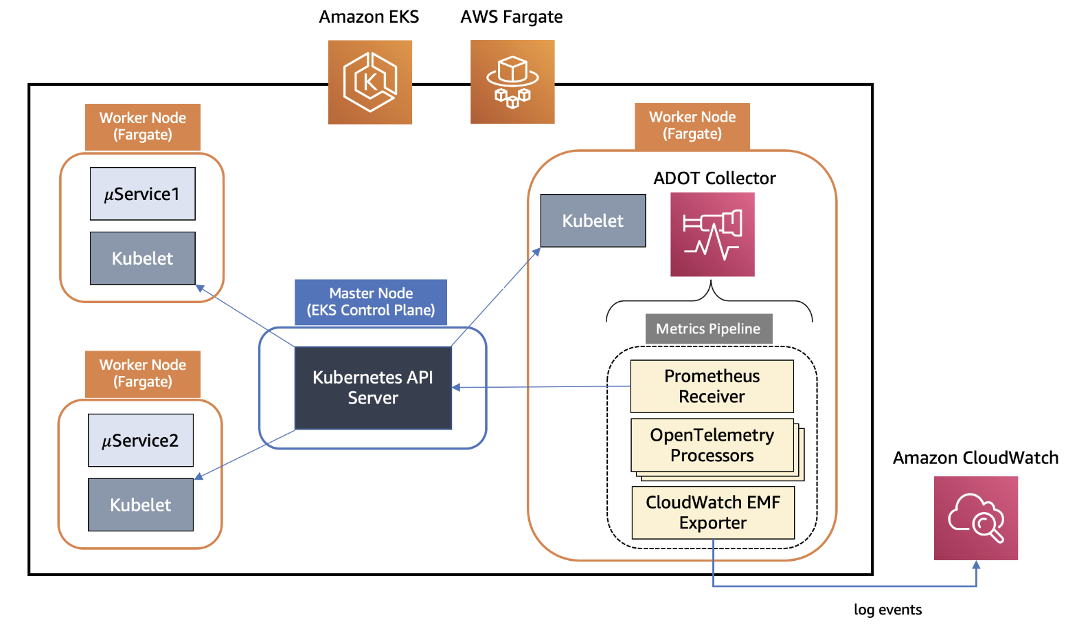 図 1:EKS Fargate 上の ADOT を使用した Container Insights
デプロイメントプロセス
EKS Fargate クラスターに ADOT Collector をデプロイするには、以下の手順を実行します:
- Kubernetes で EKS クラスターを作成します。
- Fargate Pod 実行ロールを設定します。
- 必要な名前空間に Fargate プロファイルを定義します。
- 必要な権限を持つ ADOT Collector 用の IAM ロールを作成します。
- 提供されたマニフェストを使用して、ADOT Collector を Kubernetes StatefulSet としてデプロイします。
- メトリクス収集をテストするためのサンプルワークロードをデプロイします。
メリットとデメリット
メリット:
- 統合されたモニタリング: EKS EC2 と Fargate ワークロードにわたって一貫したモニタリング体験を提供します。
- スケーラビリティ: 1 つの ADOT Collector インスタンスで、EKS クラスター内のすべてのワーカーノードのメトリクスを検出して収集できます。
- 豊富なメトリクス: CPU、メモリ、ディスク、ネット��ワーク使用率を含む包括的なシステムメトリクスを収集します。
- 容易な統合: 既存の CloudWatch ダッシュボードとアラームにシームレスに統合できます。
- コスト効率: 追加のモニタリングインフラストラクチャなしで Fargate ワークロードのモニタリングが可能です。
デメリット:
- 設定の複雑さ:ADOT Collector のセットアップには、IAM ロール、Fargate プロファイル、Kubernetes リソースの慎重な設定が必要です。
- リソースのオーバーヘッド:ADOT Collector 自体が Fargate クラスターのリソースを消費するため、キャパシティプランニングで考慮する必要があります。
AWS Distro for OpenTelemetry と CloudWatch Container Insights の EKS Fargate ワークロードへの統合は、コンテナ化されたアプリケーションのモニタリングに強力なソリューションを提供します。 異なる EKS デプロイメントオプション全体で統一されたモニタリング体験を提供し、OpenTelemetry フレームワークのスケーラビリティと柔軟性を活用します。 Fargate ワークロードからシステムメトリクスの収集を可能にすることで、この統合によってお客様はアプリケーションのパフォーマンスをより深く理解し、適切なスケーリングの判断を行い、リソース使用率を最適化できます。