AWS オープンソースサービスを使用したクロスアカウントモニタリング
はじめに
最近のクラウド環境は、複数のアカウントにまたがり、オンプレミスのインフラストラクチャも含むことが多く、複雑な監視の課題が生じています。 これらの課題に対処する��ため、AWS サービスと業界標準のツールを使用して高度な監視アーキテクチャを実装することができます。 このアーキテクチャにより、多様な環境全体を包括的に可視化し、効率的な管理と迅速な問題解決を実現できます。
コアコンポーネント
この監視ソリューションの中核となるのは AWS Distro for OpenTelemetry (ADOT) で、様々なソースからのメトリクスを一元的に収集するポイントとして機能します。 ADOT は専用のセントラル AWS アカウントにデプロイされ、監視インフラストラクチャのハブを形成します。 この中央集中型のデプロイにより、データの集約と処理を効率化できます。
Amazon Managed Service for Prometheus も重要なコンポーネントの 1 つで、収集したメトリクスを保存するためのスケーラブルなマネージド時系列データベースを提供します。 このサービスにより、自己管理型の Prometheus インスタンスが不要となり、運用オーバーヘッドを削減し、メトリクスデータの高可用性を確保できます。
可視化と分析のために、Grafana がアーキテクチャに統合されています。 Grafana は Amazon Managed Service for Prometheus に接続し、強力なクエリ機能とカスタマイズ可能なダッシュボードを提供します。 これにより、チームは収集したメトリクスに基づいて、洞察力のある可視化とアラートの設定が可能になります。
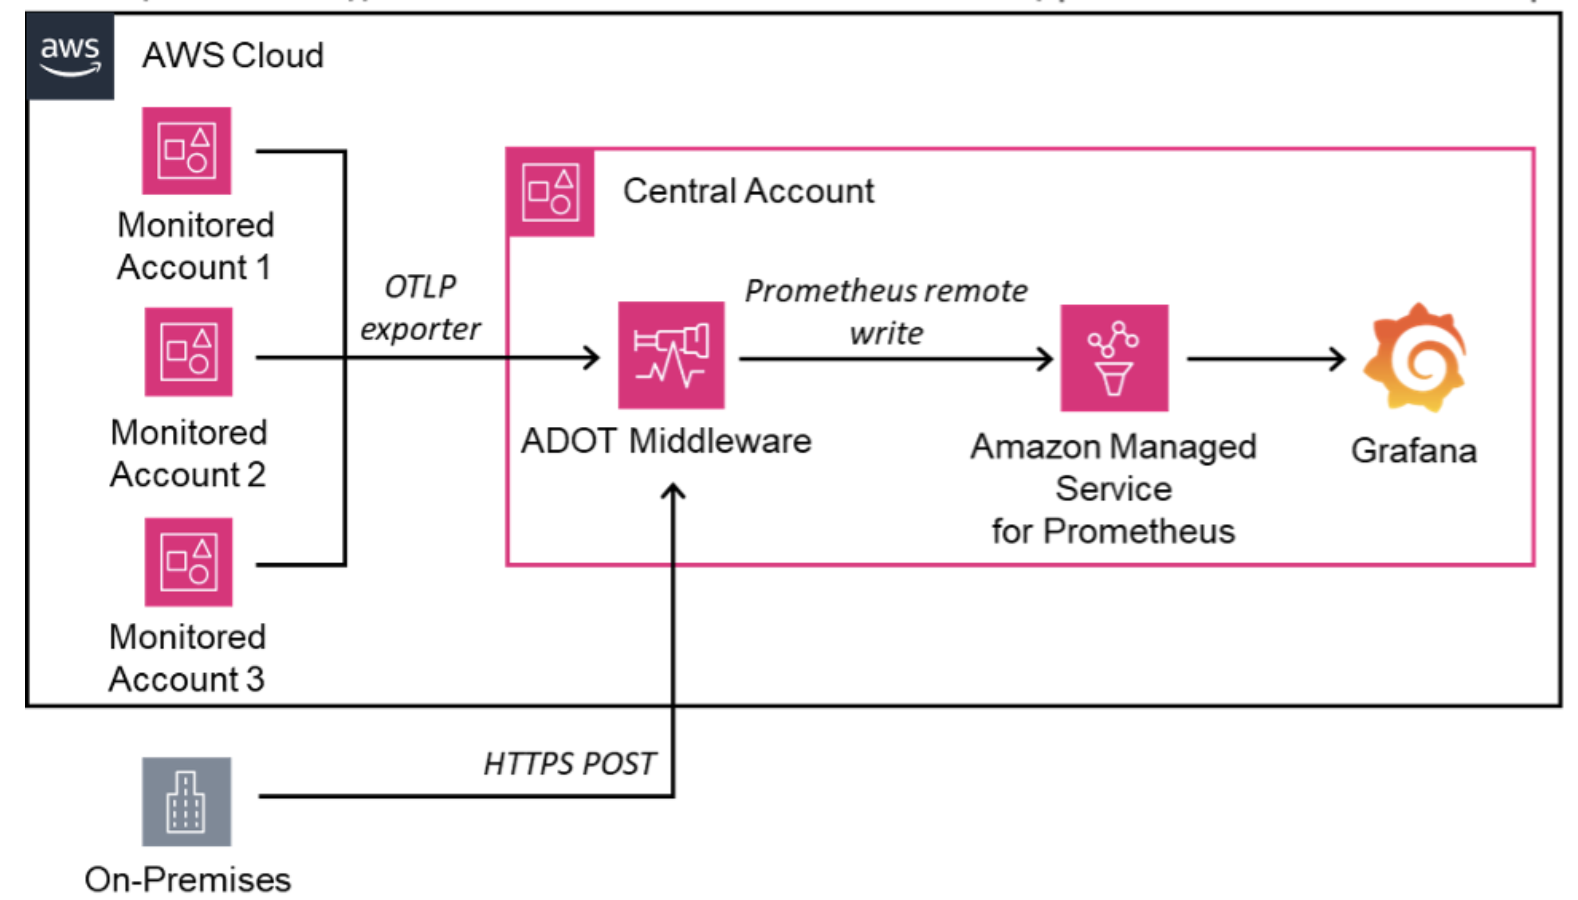 図 1: AWS オープンソースサービスを使用したマルチアカウント監視
データ収集とフロー
このアーキテクチャは、モニタリング対象アカウントと呼ばれる複数の AWS アカウントからのデータ収集をサポートしています。 これらのアカウントは OpenTelemetry Protocol (OTLP) を使用して、メトリクスを中央の ADOT インスタンスにエクスポートします。 この標準化されたアプローチにより、データ形式の一貫性が確保され、新しいアカウントをモニタリング設定に容易に統合できます。
オンプレミスのインフラストラクチャもこのモニタリングソリューションに組み込まれています。 これらのシステムは、セキュアな HTTPS POST リクエストを使用して、メトリクスデータを中央の ADOT インスタンスに送信します。 この方法により、レガシーシステムやクラウド以外のシステムを全体的なモニタリング戦略に含めることができ、IT 環境全体を包括的に可視化できます。
データが中央の ADOT インスタンスに到達すると、Prometheus リモートライトプロトコルを使用して処理され、Amazon Managed Service for Prometheus に転送されます。 このステップにより、収集されたすべてのメトリクスが時系列データに最適化された形式で保存され、効率的なクエリと分析が可能になります。
利点と考慮事項
このアーキテクチャには、いくつかの重要な利点があります。 多様なソースからのメトリクスを一元的に表示できるため、複雑な環境を包括的に監視することができます。 マネージドサービスを使用することで、チームの運用負荷が軽減され、インフラストラクチャの保守ではなく分析に集中できます。 さらに、このアーキテクチャは拡張性が高く、監視対象システムの数とメトリクス収集量の両方の増加に対応できます。
ただし、このアーキテクチャを実装する際には、いくつかの考慮事項があります。 集中型のソリューションであるため、中央アカウントの監視インフラストラクチャが重要になり、高可用性と災害復旧のための慎重な計画が必要です。 また、アカウント間のデータ転送やマネージドサービスの使用に関連するコストが発生する可能性があり、予算の決定時にはこれらを考慮する必要があります。
セキュリティも重要な考慮事項です。 クロスアカウントでのメトリクス収集を可能にするには、適切な IAM ロールとアクセス許可を設定する必要があります。 オンプレミスシステムについては、監視データの整合性と機密性を維持するために、安全で認証された HTTPS 接続を確保することが重要です。
まとめ
この高度な AWS クラウドモニタリングアーキテクチャは��、複雑なマルチアカウントおよびハイブリッドインフラストラクチャ環境を持つ組織に対して、堅牢なソリューションを提供します。 AWS マネージドサービスと OpenTelemetry や Grafana などの業界標準ツールを活用することで、スケーラブルで強力なモニタリングソリューションを実現します。 効果的な実装には慎重な計画と管理が必要ですが、包括的な可視性と一元化されたモニタリングのメリットは、最新のクラウドネイティブおよびハイブリッド環境にとって価値のあるアプローチとなります。
このアーキテクチャの柔軟性により、さまざまな組織のニーズに適応し、モニタリング要件の変化に応じて進化することができます。 クラウド環境の複雑さが増す中、このような一元化された包括的なモニタリングソリューションは、オペレーショナルエクセレンスを維持し、すべてのインフラストラクチャコンポーネントで最適なパフォーマンスを確保するために、ますます重要になってきています。