Amazon Managed Service for Prometheus
Amazon Managed Service for Prometheus 비용 및 사용량 시각화를 통해 개별 AWS 계정, AWS 리전, 특정 Prometheus Workspace 인스턴스 및 RemoteWrite, Query, HourlyStorageMetering과 같은 작업의 비용에 대한 인사이트를 얻을 수 있습니다!
비용 및 사용량 데이터를 시각화하고 분석하려면 사용자 지정 Athena 뷰를 생성해야 합니다.
-
진행하기 전에 구현 개요에 언급된 CUR(1단계) 생성과 AWS CloudFormation 템플릿 배포(2단계)를 완료했는지 확인하세요.
-
다음 쿼리를 사용하여 새 Amazon Athena 뷰를 생성합니다. 이 쿼리는 Organization의 모든 AWS 계정에 걸친 Amazon Managed Service for Prometheus의 비용과 사용량을 가져옵니다.
CREATE OR REPLACE VIEW "prometheus_cost" AS SELECT line_item_usage_type , line_item_resource_id , line_item_operation , line_item_usage_account_id , month , year , "sum"(line_item_usage_amount) "Usage" , "sum"(line_item_unblended_cost) cost FROM database.tablename #replace database.tablename with your database and table name WHERE ("line_item_product_code" = 'AmazonPrometheus') GROUP BY 1, 2, 3, 4, 5, 6
Amazon Managed Grafana 대시보드 생성
Amazon Managed Grafana에서는 Grafana workspace 콘솔의 AWS 데이터 소스 구성 옵션을 사용하여 Athena를 데이터 소스로 추가할 수 있습니다. 이 기능은 기존 Athena 계정을 검색하고 Athena에 접근하는 데 필요한 인증 자격 증명의 구성을 관리하여 Athena를 데이터 소스로 추가하는 과정을 간소화합니다. Athena 데이터 소스 사용과 관련된 사전 요구사항은 사전 요구사항을 참조하세요.
다음 Grafana 대시보드는 AWS Organizations의 모든 AWS 계정에 걸친 Amazon Managed Service for Prometheus 비용 및 사용량을 개별 Prometheus Workspace 인스턴스의 비용과 RemoteWrite, Query, HourlyStorageMetering 등의 작업과 함께 보여줍니다!
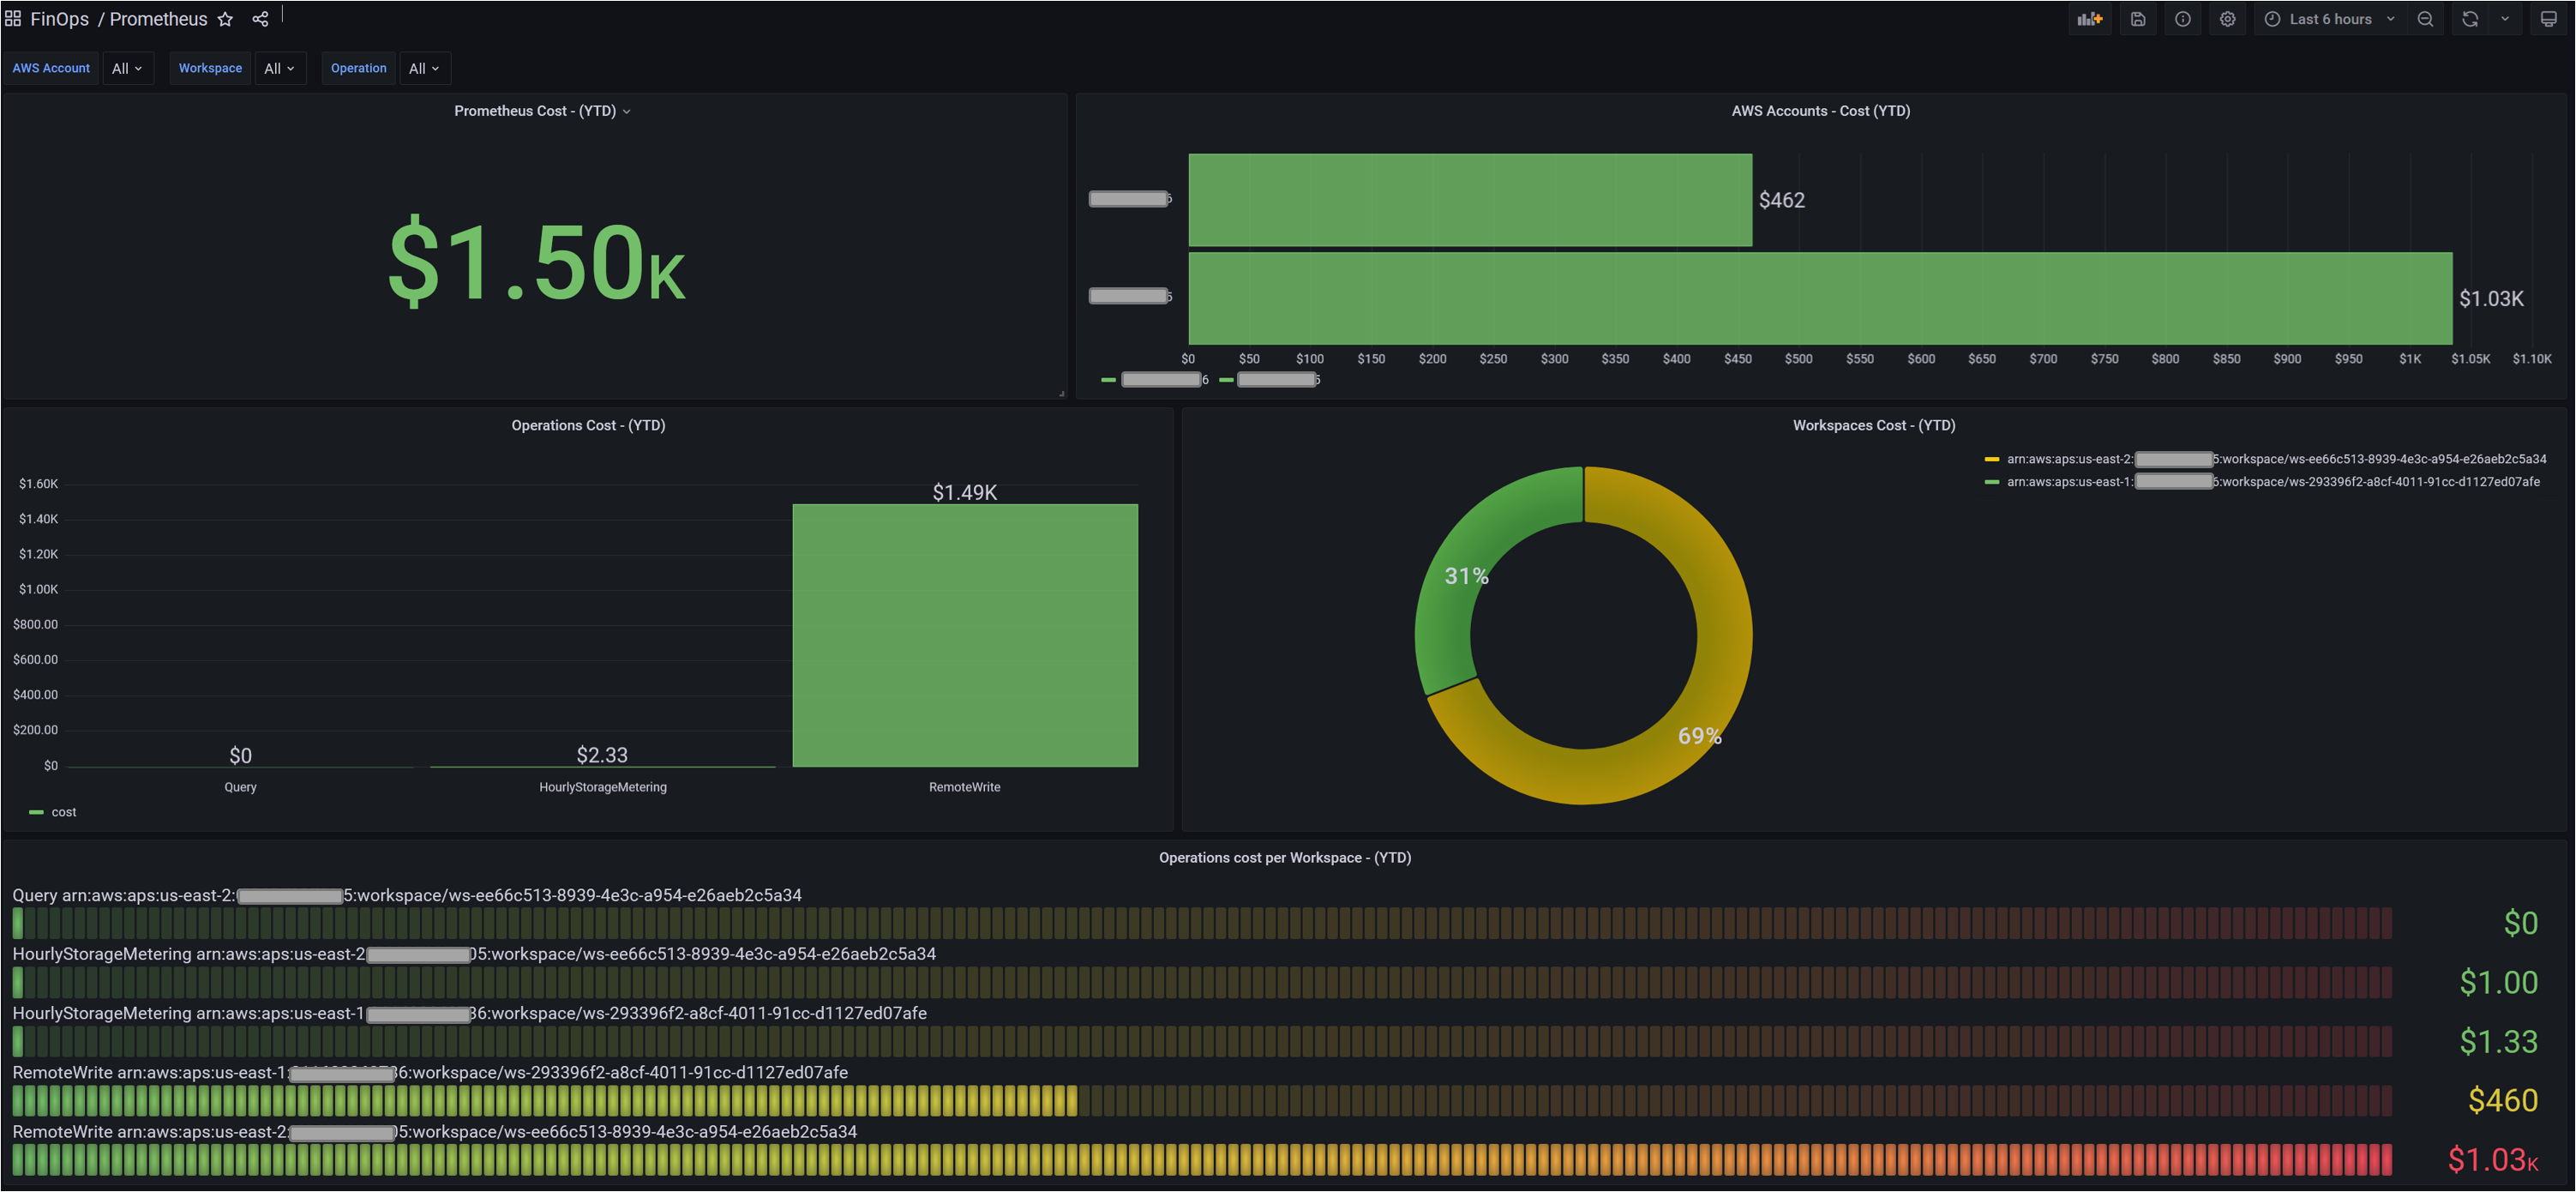
Grafana의 대시보드는 대시보드의 메타데이터를 저장하는 JSON 객체로 표현됩니다. 대시보드 메타데이터에는 대시보드 속성, 패널의 메타데이�터, 템플릿 변수, 패널 쿼리 등이 포함됩니다. 위 대시보드의 JSON 템플릿은 여기에서 접근할 수 있습니다.
위 대시보드를 통해 Organization 전체의 AWS 계정에서 Amazon Managed Service for Prometheus의 비용과 사용량을 식별할 수 있습니다. 다른 Grafana 대시보드 패널을 사용하여 요구사항에 맞는 시각적 요소를 구축할 수 있습니다.