Configure Agents/Collectors
Once you have your monitoring account structure in place, you will need to configure your applications, services, and other infrastructure components to send telemetry to CloudWatch.
This is a high-level guide to configuring your agents and collectors. For in-depth guidance, please refer to various sections in this best practices guide.
Amazon EKS
For EKS, the simplest way to configure observability it to use the Amazon EKS add-on. This will install Container Insights with enhanced observability for Amazon EKS. The add-on installs the CloudWatch agent to send infrastructure metrics from the cluster, installs Fluent Bit to send container logs, and also enables CloudWatch Application Signals to send application performance telemetry. (It is configurable if you do not want Application Signals, Container Insights, etc.)
Typically, the Amazon CloudWatch Observability EKS add-on is installed as a DaemonSet.
Some options for EKS are:
CloudWatch Agent for EKS
- Amazon CloudWatch Observability EKS add-on
- Amazon CloudWatch Observability Helm Chart
OTEL Collector for EKS
Alternatively, if you want to use the OTEL collector, you can:
- Configure AWS Exporters
- Set your OTLP exporter to point to the log and traces OTLP endpoints
- Define your processing pipelines
- Instrument your application using OTEL libraries (if required)
Amazon ECS
For ECS, you can enable Container Insights to collect infrastructure metrics for your clusters. You can also deploy Application Signals to collect application performance telemetry and associated traces. For logs, you can use the awslogs driver to send your log data to CloudWatch, or you can use OpenTelemetry collectors to send the data.
Some options for EKS are:
CloudWatch Agent for ECS
- Enable Container Insights
- Deploy Application Signals (optional)
- Use the awslogs log driver
OTEL Collector for ECS��
Alternatively, you can:
- Run as a sidecar
- Configure AWS Exporters
- Set OTLP endpoints
- Define processing pipelines
- Instrument applications (if required)
Amazon EC2 and On-Premises
CloudWatch agent can be used to send telemetry data from EC2 instances, other virtual machines, and on-premises servers to CloudWatch.
Deployment Options
- Workload Detection for EC2 – Provides an automated way to deploy the agent
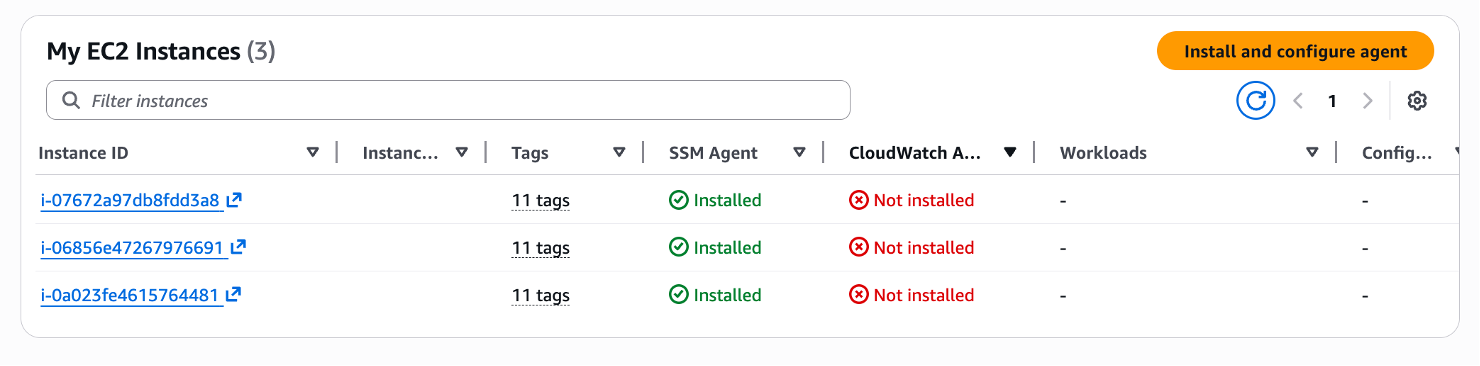
- Systems Manager – Deploy and configure the agent using AWS Systems Manager
- Custom Automation – Use your own automation tools
- Manual Installation – Install manually for specific use cases
You can configure/customize telemetry via config file (automatically or manually), and there is a wizard available to help you fine-tune your settings.
OTEL Collector for EC2
You can also use the OTEL collector with:
OTLP Exporters:
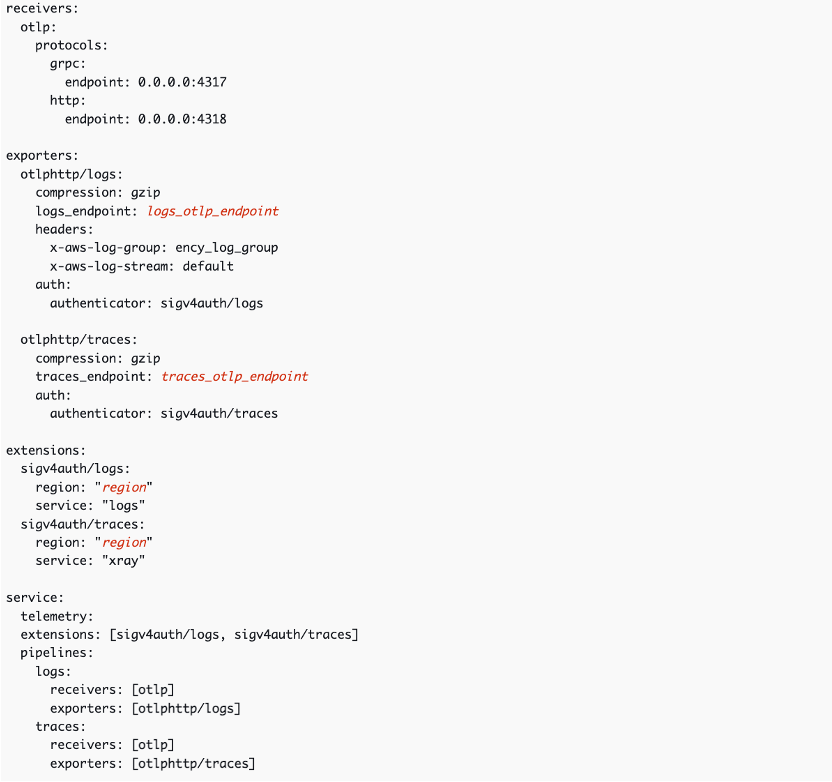
Use OTLP exporters for trace and log OTLP endpoints.
AWS-Specific Exporters:
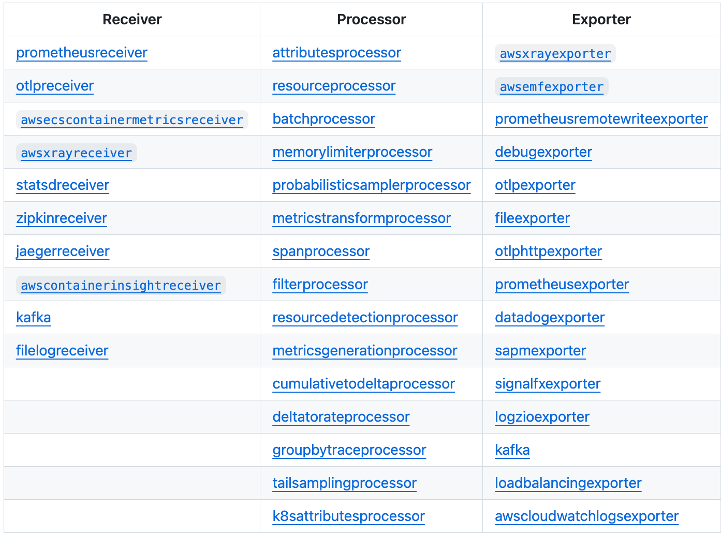
Use AWS-specific exporters and processing pipelines.
Summary
To summarize:
- Choose the appropriate agent/collector for your compute platform (EKS, ECS, EC2)
- Deploy using automated methods (add-ons, Helm charts, Systems Manager) or manual installation
- Configure telemetry collection based on your requirements
- Optionally use OpenTelemetry for vendor-neutral instrumentation
For detailed configuration guides, refer to the specific sections in this best practices guide for your compute platform and observability tools.
Next Steps
Continue to Dashboards and Alerts