EKS cluster wide GPU Cost Attribution
This post walks through an end-to-end proof of concept (PoC) for GPU slice cost allocation on Amazon EKS.
Problem statement
When multiple tenants share GPU capacity (e.g., MIG slices), you need to answer:
- Who requested what share of GPU (by pod / namespace / BU)?
- Who actually used the GPU (and how much)?
- Given a “public” price like $12 per GPU-hour, how do we compute:
- Allocated cost (based on requested share)
- Effective cost (based on observed utilization)
- Waste (allocated minus effective)
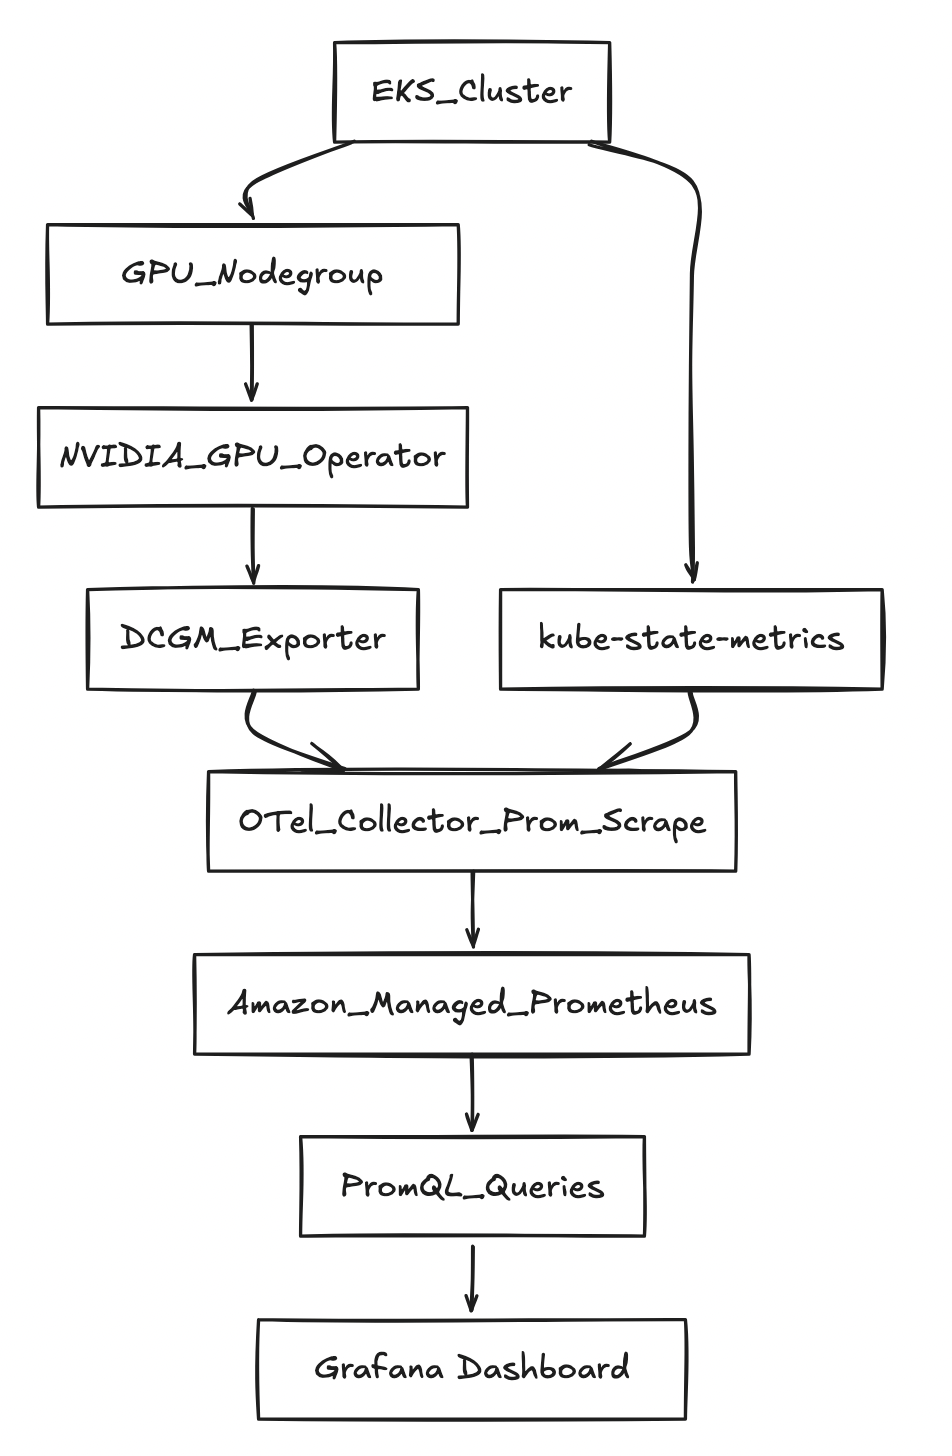
Architecture (high level)
Prerequisites
AWS + EKS prerequisites
- AWS account with permission to create:
- EKS clusters + nodegroups
- IAM roles for service accounts (IRSA)
- AMP workspace
- Quota and AZ capacity for running GPU instances in your region
Variables used
export AWS_REGION="us-west-2"
export CLUSTER_NAME="gpu-cost-poc"
export AMP_ALIAS="gpu-cost-poc"

# Public/benchmark price you want to demonstrate (not CUR yet)
export GPU_HOURLY_RATE="12"

# MIG profile for the PoC (eg: A100 40GB commonly supports 1g.5gb with 7 slices/GPU)
export MIG_PROFILE_LABEL="all-1g.5gb"

# IMPORTANT: in this PoC, MIG slices were exposed as nvidia.com/gpu (1 “gpu” == 1 MIG slice)
export MIG_RESOURCE_KEY="nvidia.com/gpu"

# For 1g.5gb on A100: typically 7 slices per physical GPU
export SLICES_PER_GPU="7"

# kube-state-metrics may “sanitize” extended resource names
export KSM_RESOURCE_REGEX='nvidia.*(gpu|mig).*'
Step-by-step instructions
Step 1 — Create EKS cluster
List versions your eksctl supports:
eksctl utils describe cluster-versions
Create the cluster (omit --version to let eksctl pick a supported default):
eksctl create cluster \
  --name "$CLUSTER_NAME" \
  --region "$AWS_REGION" \
  --managed
Step 2 — Add a “system” nodegroup (recommended)
This keeps CoreDNS and operators off expensive GPU nodes.
eksctl create nodegroup \
  --cluster "$CLUSTER_NAME" \
  --region "$AWS_REGION" \
  --name "system-ng" \
  --node-type "m5.large" \
  --nodes 2 --nodes-min 2 --nodes-max 3
Step 3 — Add a GPU nodegroup
eksctl create nodegroup \
  --cluster "$CLUSTER_NAME" \
  --region "$AWS_REGION" \
  --name "gpu-ng-ubuntu" \
  --node-type "p4d.24xlarge" \
  --node-ami-family "Ubuntu2204" \
  --install-nvidia-plugin=false \
  --nodes 1 --nodes-min 1 --nodes-max 1 \
  --node-labels "workload=gpu"
Apply a taint so only GPU workloads schedule there:
kubectl taint nodes -l workload=gpu nvidia.com/gpu=present:NoSchedule --overwrite
Step 4 — Install NVIDIA GPU Operator (MIG enabled)
helm repo add nvidia https://helm.ngc.nvidia.com/nvidia
helm repo update

helm upgrade --install gpu-operator nvidia/gpu-operator \
  -n gpu-operator --create-namespace \
  --set mig.strategy=single
Step 5 — Enable MIG profile on GPU node(s)
Check current MIG labels:
kubectl get nodes -l workload=gpu -o jsonpath='{range .items[*]}{.metadata.name}{"\t"}{.metadata.labels.nvidia\.com/mig\.capable}{"\t"}{.metadata.labels.nvidia\.com/mig\.config}{"\t"}{.metadata.labels.nvidia\.com/mig\.config\.state}{"\n"}{end}'
Apply MIG geometry:
kubectl label nodes -l workload=gpu nvidia.com/mig.config="$MIG_PROFILE_LABEL" --overwrite
Wait for success:
kubectl get nodes -l workload=gpu -o jsonpath='{range .items[*]}{.metadata.name}{"\t"}{.metadata.labels.nvidia\.com/mig\.config}{"\t"}{.metadata.labels.nvidia\.com/mig\.config\.state}{"\n"}{end}'
Step 6 — Create AMP workspace
aws amp create-workspace --alias "$AMP_ALIAS" --region "$AWS_REGION"

export AMP_WORKSPACE_ID="$(aws amp list-workspaces --region "$AWS_REGION" --query "workspaces[?alias=='$AMP_ALIAS'].workspaceId | [0]" --output text)"
export AMP_ENDPOINT="$(aws amp describe-workspace --workspace-id "$AMP_WORKSPACE_ID" --region "$AWS_REGION" --query "workspace.prometheusEndpoint" --output text)"

echo "$AMP_WORKSPACE_ID"
echo "$AMP_ENDPOINT"
Step 7 — IRSA for ingest + query
eksctl utils associate-iam-oidc-provider \
  --cluster "$CLUSTER_NAME" \
  --region "$AWS_REGION" \
  --approve

eksctl create iamserviceaccount \
  --cluster "$CLUSTER_NAME" --region "$AWS_REGION" \
  --name amp-ingest --namespace observability \
  --attach-policy-arn arn:aws:iam::aws:policy/AmazonPrometheusRemoteWriteAccess \
  --approve --override-existing-serviceaccounts

eksctl create iamserviceaccount \
  --cluster "$CLUSTER_NAME" --region "$AWS_REGION" \
  --name amp-query --namespace observability \
  --attach-policy-arn arn:aws:iam::aws:policy/AmazonPrometheusQueryAccess \
  --approve --override-existing-serviceaccounts
Step 8 — Install kube-state-metrics
helm repo add prometheus-community https://prometheus-community.github.io/helm-charts
helm repo update

helm upgrade --install kube-state-metrics prometheus-community/kube-state-metrics \
  -n kube-system
Step 9 — Deploy OTel collector (Prometheus scrape → AMP remote_write)
kubectl -n observability patch configmap amp-scraper-otel-env --type merge -p "$(cat <<PATCH
{
  "data": {
    "AWS_REGION": "${AWS_REGION}",
    "AMP_ENDPOINT": "${AMP_ENDPOINT}"
  }
}
PATCH
)"

kubectl -n observability rollout restart deploy/amp-scraper-otel
kubectl -n observability rollout status deploy/amp-scraper-otel
Step 10 — Deploy three BU workloads (3/2/2 slices)
Apply the BU namespaces + deployments.
Critical detail: request nvidia.com/gpu: 1 per pod (because MIG slices are exposed as nvidia.com/gpu here).
Queries: allocation, utilization, effective cost, waste
1) Requested slices per namespace (BU)
Q='sum by (namespace) (kube_pod_container_resource_requests{resource=~"nvidia.*(gpu|mig).*",unit="integer"})'
ENCODED="$(python3 -c 'import urllib.parse,sys; print(urllib.parse.quote(sys.argv[1]))' "$Q")"

awscurl --service aps --region "$AWS_REGION" \
  -X POST "${AMP_ENDPOINT}api/v1/query" \
  -H "Content-Type: application/x-www-form-urlencoded" \
  -d "query=${ENCODED}"
Observed output:
{"namespace":"bu-a","value":[...,"3"]}
{"namespace":"bu-b","value":[...,"2"]}
{"namespace":"bu-c","value":[...,"2"]}
2) Find a GPU utilization metric
List metric names:
awscurl --service aps --region "$AWS_REGION" \
  "${AMP_ENDPOINT}api/v1/label/__name__/values" \
| python3 -c 'import sys,json; j=json.load(sys.stdin); print("\n".join(j["data"]))' \
| egrep -i "dcgm.*util|DCGM.*UTIL|gr_engine_active|sm_active" \
| head -n 30
We found:
DCGM_FI_PROF_GR_ENGINE_ACTIVE
3) Utilization fraction (scalar)
Q='scalar(avg(DCGM_FI_PROF_GR_ENGINE_ACTIVE)/100)'
ENCODED="$(python3 -c 'import urllib.parse,sys; print(urllib.parse.quote(sys.argv[1]))' "$Q")"

awscurl --service aps --region "$AWS_REGION" \
  -X POST "${AMP_ENDPOINT}api/v1/query" \
  -H "Content-Type: application/x-www-form-urlencoded" \
  -d "query=${ENCODED}"
Example observed (low load case):
{"resultType":"scalar","result":[...,"0.0004539326785714286"]}
4) Allocation math (per hour)
Allocated $/hr per BU:
allocated_usd_per_hr =
sum by (namespace) (kube_pod_container_resource_requests{resource=~"nvidia.*(gpu|mig).*",unit="integer"})
* (GPU_HOURLY_RATE / SLICES_PER_GPU)
With constants (12/7):
Q='sum by (namespace) (kube_pod_container_resource_requests{resource=~"nvidia.*(gpu|mig).*",unit="integer"}) * (12/7)'
ENCODED="$(python3 -c 'import urllib.parse,sys; print(urllib.parse.quote(sys.argv[1]))' "$Q")"

awscurl --service aps --region "$AWS_REGION" \
  -X POST "${AMP_ENDPOINT}api/v1/query" \
  -H "Content-Type: application/x-www-form-urlencoded" \
  -d "query=${ENCODED}"
This matches the story:
- BU-A: (3/7 × 12 = 5.142857) $/hr
- BU-B: (2/7 × 12 = 3.428571) $/hr
- BU-C: (2/7 × 12 = 3.428571) $/hr
5) Effective $/hr and Waste $/hr
Key point: utilization is a scalar while allocation is a namespace-labeled vector. Use scalar(...) so Prometheus “broadcasts” it.
Effective $/hr:
Q='(sum by (namespace) (kube_pod_container_resource_requests{resource=~"nvidia.*(gpu|mig).*",unit="integer"}) * (12/7))
   * scalar(clamp_min(clamp_max(avg(DCGM_FI_PROF_GR_ENGINE_ACTIVE)/100, 1), 0))'
ENCODED="$(python3 -c 'import urllib.parse,sys; print(urllib.parse.quote(sys.argv[1]))' "$Q")"

awscurl --service aps --region "$AWS_REGION" \
  -X POST "${AMP_ENDPOINT}api/v1/query" \
  -H "Content-Type: application/x-www-form-urlencoded" \
  -d "query=${ENCODED}"
Example output we saw:
{"namespace":"bu-a","value":[...,"0.002325599081632653"]}
{"namespace":"bu-b","value":[...,"0.0015503993877551022"]}
{"namespace":"bu-c","value":[...,"0.0015503993877551022"]}
Waste $/hr:
Q='(sum by (namespace) (kube_pod_container_resource_requests{resource=~"nvidia.*(gpu|mig).*",unit="integer"}) * (12/7))
 - (
    (sum by (namespace) (kube_pod_container_resource_requests{resource=~"nvidia.*(gpu|mig).*",unit="integer"}) * (12/7))
    * scalar(clamp_min(clamp_max(avg(DCGM_FI_PROF_GR_ENGINE_ACTIVE)/100, 1), 0))
   )'
ENCODED="$(python3 -c 'import urllib.parse,sys; print(urllib.parse.quote(sys.argv[1]))' "$Q")"

awscurl --service aps --region "$AWS_REGION" \
  -X POST "${AMP_ENDPOINT}api/v1/query" \
  -H "Content-Type: application/x-www-form-urlencoded" \
  -d "query=${ENCODED}"
Example output we saw:
{"namespace":"bu-a","value":[...,"5.14053154377551"]}
{"namespace":"bu-b","value":[...,"3.427021029183673"]}
{"namespace":"bu-c","value":[...,"3.427021029183673"]}
Amazon Managed Grafana (AMG): dashboards on top of AMP
To make this PoC easy to share, the quickest visualization layer is Amazon Managed Grafana (AMG).
1) Create an AMG workspace (CLI)
aws grafana create-workspace \
  --name "${CLUSTER_NAME}-gpu-cost" \
  --region "${AWS_REGION}" \
  --authentication-providers AWS_SSO \
  --permission-type SERVICE_MANAGED \
  --workspace-data-sources PROMETHEUS
Get the workspace URL:
export AMG_WORKSPACE_ID="$(aws grafana list-workspaces --region "${AWS_REGION}" --query "workspaces[?name=='${CLUSTER_NAME}-gpu-cost'].id | [0]" --output text)"
aws grafana describe-workspace --region "${AWS_REGION}" --workspace-id "${AMG_WORKSPACE_ID}" \
  --query "workspace.{status:status,endpoint:endpoint,roleArn:iamRoleArn}" --output yaml
2) Allow AMG to query AMP
export AMG_ROLE_ARN="$(aws grafana describe-workspace --region "${AWS_REGION}" --workspace-id "${AMG_WORKSPACE_ID}" --query "workspace.iamRoleArn" --output text)"
ROLE_NAME="$(basename "$AMG_ROLE_ARN")"
aws iam attach-role-policy --role-name "$ROLE_NAME" --policy-arn arn:aws:iam::aws:policy/AmazonPrometheusQueryAccess
3) Add AMP as a Prometheus data source (Grafana UI)
In the AMG UI:
- Connections → Data sources → Add data source → Prometheus
- URL:
https://aps-workspaces.${AWS_REGION}.amazonaws.com/workspaces/${AMP_WORKSPACE_ID} - SigV4: enabled
- Region:
${AWS_REGION} - Service:
aps
- Region:
- Save & test
4) Starter panels (PromQL)
Requested slices by BU/namespace
sum by (namespace) (
  kube_pod_container_resource_requests{resource=~"nvidia.*(gpu|mig).*",unit="integer"}
)
Allocated $/hr by BU/namespace (12/7 constants)
sum by (namespace) (
  kube_pod_container_resource_requests{resource=~"nvidia.*(gpu|mig).*",unit="integer"}
) * (12/7)
Utilization fraction scalar (cluster-level proxy)
scalar(avg(DCGM_FI_PROF_GR_ENGINE_ACTIVE)/100)
Effective $/hr (proxy)
(sum by (namespace) (
  kube_pod_container_resource_requests{resource=~"nvidia.*(gpu|mig).*",unit="integer"}
) * (12/7))
* scalar(clamp_min(clamp_max(avg(DCGM_FI_PROF_GR_ENGINE_ACTIVE)/100, 1), 0))
Waste $/hr (proxy)
(sum by (namespace) (
  kube_pod_container_resource_requests{resource=~"nvidia.*(gpu|mig).*",unit="integer"}
) * (12/7))
-
((sum by (namespace) (
  kube_pod_container_resource_requests{resource=~"nvidia.*(gpu|mig).*",unit="integer"}
) * (12/7))
* scalar(clamp_min(clamp_max(avg(DCGM_FI_PROF_GR_ENGINE_ACTIVE)/100, 1), 0)))
Learnings and next improvements
What this PoC proves
- Allocation is straightforward when requests are declared (slices per BU) and priced with a simple constant.
- With MIG, requested slices map cleanly to cost shares.
- You can compute waste as “allocated minus effective” to show poor ROI for idle slices.
What’s “approximate” in this PoC
- With MIG, per-pod GPU utilization labels may not be present in DCGM metrics, depending on versions/config.
- This PoC used a cluster-level utilization scalar as a proxy for “actual usage” per BU.
Next steps to make it production-grade
- True per-pod attribution:
- add a per-pod GPU usage exporter (reads assigned MIG device and reports utilization with pod labels), or
- integrate scheduler/device mapping from the NVIDIA device plugin / runtime
- Real pricing:
- replace the constant $/GPU-hour with AWS CUR or on-demand price APIs
- Dashboards:
- plug AMP into Grafana and chart
allocated,effective, andwasteover time per BU
- plug AMP into Grafana and chart
Cleanup
When you're done with the PoC, delete all resources in reverse dependency order to avoid orphaned infrastructure and ongoing charges.
1) Delete BU workloads
kubectl delete namespace bu-a bu-b bu-c
2) Delete OTel collector
kubectl delete namespace observability
3) Uninstall kube-state-metrics
helm uninstall kube-state-metrics -n kube-system
4) Uninstall NVIDIA GPU Operator
helm uninstall gpu-operator -n gpu-operator
kubectl delete namespace gpu-operator
5) Delete Amazon Managed Grafana workspace
aws grafana delete-workspace \
  --workspace-id "$AMG_WORKSPACE_ID" \
  --region "$AWS_REGION"
6) Detach AMG IAM policy
ROLE_NAME="$(basename "$AMG_ROLE_ARN")"
aws iam detach-role-policy \
  --role-name "$ROLE_NAME" \
  --policy-arn arn:aws:iam::aws:policy/AmazonPrometheusQueryAccess
7) Delete AMP workspace
aws amp delete-workspace \
  --workspace-id "$AMP_WORKSPACE_ID" \
  --region "$AWS_REGION"
8) Delete IRSA service accounts
eksctl delete iamserviceaccount \
  --cluster "$CLUSTER_NAME" --region "$AWS_REGION" \
  --name amp-ingest --namespace observability

eksctl delete iamserviceaccount \
  --cluster "$CLUSTER_NAME" --region "$AWS_REGION" \
  --name amp-query --namespace observability
9) Delete nodegroups
eksctl delete nodegroup \
  --cluster "$CLUSTER_NAME" --region "$AWS_REGION" \
  --name gpu-ng-ubuntu

eksctl delete nodegroup \
  --cluster "$CLUSTER_NAME" --region "$AWS_REGION" \
  --name system-ng
10) Delete the EKS cluster
eksctl delete cluster \
  --name "$CLUSTER_NAME" \
  --region "$AWS_REGION"
eksctl delete cluster also removes the OIDC provider and any remaining nodegroups if they weren't deleted individually. However, deleting nodegroups first ensures a cleaner teardown with fewer retries on CloudFormation stack deletion.