key-performance-indicators
1.0 理解 KPI("黄金信号")
组织利用关键绩效指标(KPI),也称为"黄金信号",来提供对业务和运营健康状况或风险的洞察。组织的不同部门会有独特的 KPI 来衡量各自的成果。例如,电子商务应用程序的产品团队会将成功处理购物车订单的能力作为其 KPI。值班运营团队会将平均检测时间(MTTD)作为其 KPI 来衡量事件。对于财务团队来说,资源成本在预算范围内的 KPI 很重要。
Service Level Indicators (SLIs)、Service Level Objectives (SLOs) 和 Service Level Agreements (SLAs) 是服务可靠性管理的基本组成部分。本指南概述了使用 Amazon CloudWatch 及其功能来计算和监控 SLI、SLO 和 SLA 的最佳实践,并提供清晰简洁的示例。
- SLI (Service Level Indicator): 服务性能的定量指标。
- SLO (Service Level Objective): SLI 的目标值,表示期望的性能水平。
- SLA (Service Level Agreement): 服务提供商与其用户之间的合同,规定了预期的服务水平。
常见 SLI 示例:
- 可用性:服务正常运行时间的百分比
- 延迟:完成请求所需的时间
- 错误率:失败请求的百分比
2.0 发现客户和利益相关者需求(使用下面建议的模板)
- Start with the top question: “What is the business value or business problem in scope for the given workload (ex. Payment portal, eCommerce order placement, User registration, Data reports, Support portal etc)
- Break down the business value into categories such as User-Experience (UX); Business-Experience (BX); Operational-Experience (OpsX); Security-Experience(SecX); Developer-Experience (DevX)
- Derive core signals aka “Golden Signals” for each category; the top signals around UX & BX will typically construe the business metrics
| ID | Initials | Customer | Business Needs | Measurements | Information Sources | What does good look like? | Alerts | Dashboards | Reports |
|---|---|---|---|---|---|---|---|---|---|
| M1 | Example | External End User | User Experience | Response time (Page latency) | Logs / Traces | < 5s for 99.9% | No | Yes | No |
| M2 | Example | Business | Availability | Successful RPS (Requests per second) | Health Check | >85% in 5 min window | Yes | Yes | Yes |
| M3 | Example | Security | Compliance | Critical non-compliant resources | Config data | <10 under 15 days | No | Yes | Yes |
| M4 | Example | Developers | Agility | Deployment time | Deployment logs | Always < 10 min | Yes | No | Yes |
| M5 | Example | Operators | Capacity | Queue Depth | App logs/metrics | Always < 10 | Yes | Yes | Yes |
2.1 黄金信号
| Category | Signal | Notes | References |
|---|---|---|---|
| UX | Performance (Latency) | See M1 in template | Whitepaper: Availability and Beyond (Measuring latency) |
| BX | Availability | See M2 in template | Whitepaper: Avaiability and Beyond (Measuring availability) |
| BX | Business Continuity Plan (BCP) | Amazon Resilience Hub (ARH) resilience score against defined RTO/RPO | Docs: ARH user guide (Understanding resilience scores) |
| SecX | (Non)-Compliance | See M3 in template | Docs: AWS Control Tower user guide (Compliance status in the console) |
| DevX | Agility | See M4 in template | Docs: DevOps Monitoring Dashboard on AWS (DevOps metrics list) |
| OpsX | Capacity (Quotas) | See M5 in template | Docs: Amazon CloudWatch user guide (Visualizing your service quotas and setting alarms) |
| OpsX | Budget Anomalies | Docs: 1. AWS Billing and Cost Management (AWS Cost Anomaly Detection) 2. AWS Budgets |
3.0 Top Level Guidance ‘TLG’
3.1 TLG 通用
-
与业务、架构和安全团队合作,帮助细化业务、合规和治理需求,确保它们准确反映业务需求。 This includes establishing recovery-time and recovery-point targets (RTOs, RPOs). Formulate methods to measure requirements such as measuring availability and latency (ex. Uptime could allow a small percentage of faults over a 5 min window).
-
构建有效的标签策略 with purpose built schema that aligns to various business functional outcomes. This should especially cover operational 可观测性 and incident management.
-
尽可能利用动态阈值进行告警 (esp. for metrics that do not have baseline KPIs) using CloudWatch anomaly detection which provides machine learning algorithms to establish the baselines. When utilizing AWS available services that publish CW metrics (or other sources like prometheus metrics) to configure alarms consider creating composite alarms to reduce alarm noise. Example: a composite alarm that comprises of a business metric indicative of availability (tracked by successful requests) and latency when configured to alarm when both drop below a critical threshold during deployments could be deterministic indicator of deployment bug.
-
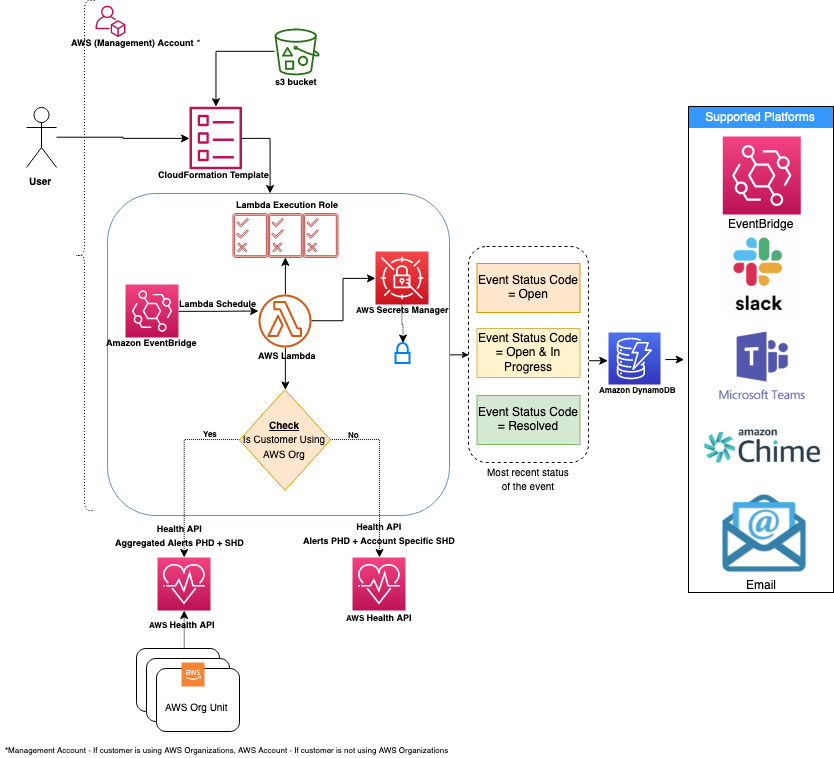
(NOTE: Requires AWS Business support or higher) AWS publishes events of interest using AWS Health service related to your resources in Personal Health Dashboard. Leverage AWS Health Aware (AHA) framework (that uses AWS Health) to ingest proactive and real-time alerts aggregated across your AWS Organization from a central account (such as a management account). These alerts can be sent to preferred communication platforms such as Slack and integrates with ITSM tools like ServiceNow and Jira.
-
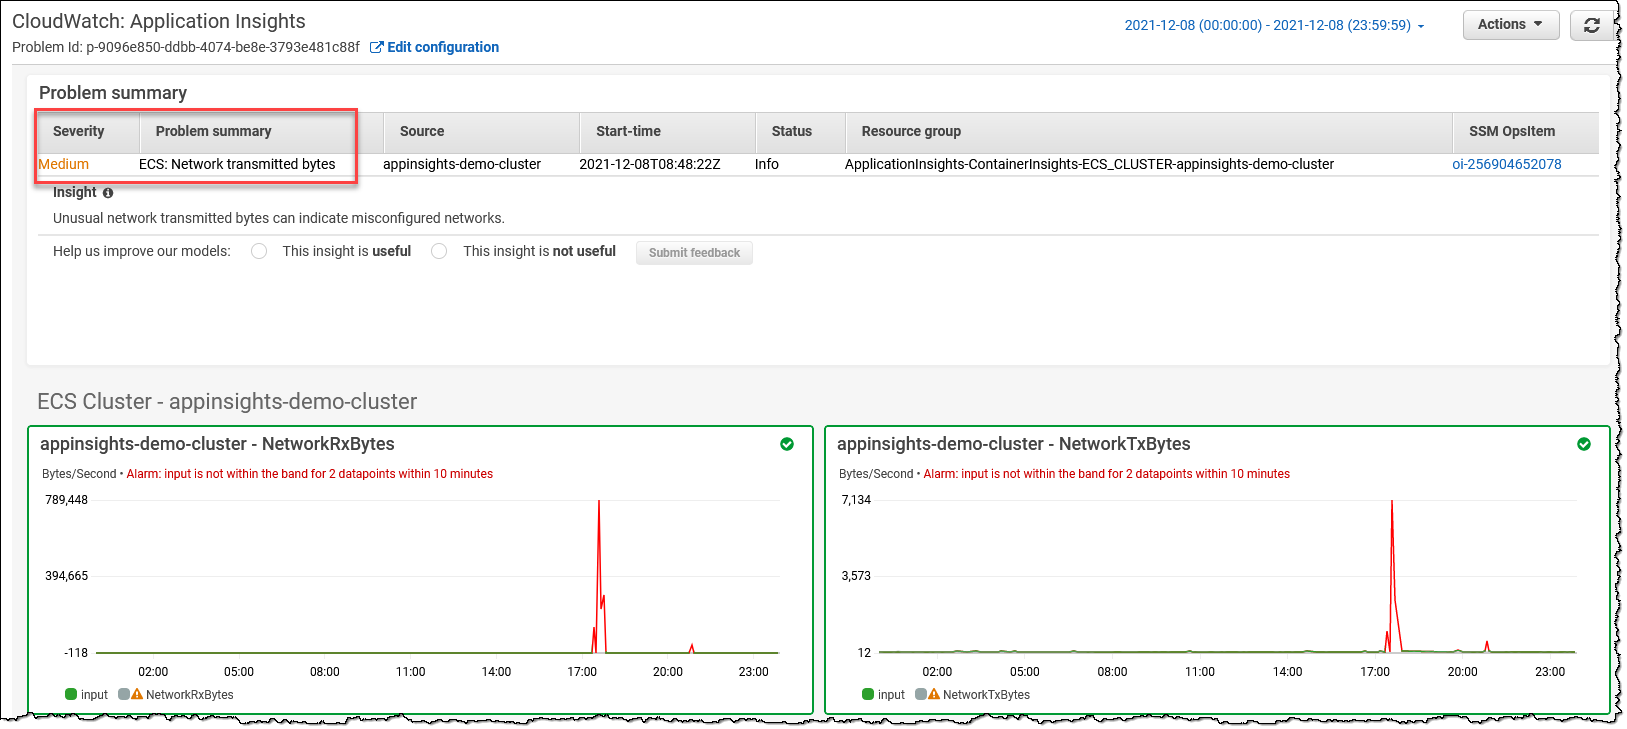
利用 Amazon CloudWatch Application Insights to setup best monitors for resources and continuously analyze data for signs of problems with your applications. It also provides automated dashboards that show potential problems with monitored applications to quickly isolate/troubleshoot application/infrastructure issues. Leverage Container Insights to aggregate metrics and logs from containers and can be integrated seamlessly with CloudWatch Application Insights.
-
利用 AWS Resilience Hub to analyze applications against defined RTOs and RPOs. Validate if the availability, latency and business continuity requirements are met by using controlled experiments using tools like AWS Fault Injection Simulator. Conduct additional Well-Architected reviews and service specific deep-dives to ensure workloads are designed to meet business requirements following AWS best practices.
-
有关更多详细信息,请参阅 AWS 可观测性 Best Practices guidance, AWS Cloud Adoption Framework: Operations Perspective whitepaper and AWS Well-Architected Framework Operational Excellence Pillar whitepaper content on 'Understading workload health'.
3.2 按领域的 TLG(重点关注业务 metrics,即 UX、BX)
以下使用 CloudWatch (CW) 等服务提供了适当的示例(参考:发布 CloudWatch metrics 文档的 AWS 服务)
3.2.1 金丝雀(即合成事务)和真实用户监控(RUM)
- TLG:了解客户/用户体验最简单、最有效的方法之一是使用金丝雀(合成事务)模拟客户流量,定期探测您的服务并记录 metrics。
| AWS Service | Feature | Measurement | Metric | Example | Notes |
|---|---|---|---|---|---|
| CW | Synthetics | Availability | SuccessPercent | (Ex. SuccessPercent > 90 or CW Anomaly Detection for 1min Period) **[Metric Math where m1 is SuccessPercent if Canaries run each weekday 7a-8a (CloudWatchSynthetics): ** IF(((DAY(m1)<6) AND (HOUR(m1)>7 AND HOUR(m1)<8)),m1)] | |
| CW | Synthetics | Availability | VisualMonitoringSuccessPercent | (Ex. VisualMonitoringSuccessPercent > 90 for 5 min Period for UI screenshot comparisons) **[Metric Math where m1 is SuccessPercent if Canaries run each weekday 7a-8a (CloudWatchSynthetics): ** IF(((DAY(m1)<6) AND (HOUR(m1)>7 AND HOUR(m1)<8)),m1) | If customer expects canary to match predetermined UI screenshot |
| CW | RUM | Response Time | Apdex Score | (Ex. Apdex score: NavigationFrustratedCount < ‘N’ expected value) | |
3.2.2 API 前端
| AWS Service | Feature | Measurement | Metric | Example | Notes |
|---|---|---|---|---|---|
| CloudFront | Availability | Total error rate | (Ex. [Total error rate] < 10 or CW Anomaly Detection for 1min Period) | Availability as a measure of error rate | |
| CloudFront | (Requires turning on additional metrics) | Peformance | Cache hit rate | (Ex.Cache hit rate < 10 CW Anomaly Detection for 1min Period) | |
| Route53 | Health checks | (Cross region) Availability | HealthCheckPercentageHealthy | (Ex. [Minimum of HealthCheckPercentageHealthy] > 90 or CW Anomaly Detection for 1min Period) | |
| Route53 | Health checks | Latency | TimeToFirstByte | (Ex. [p99 TimeToFirstByte] < 100 ms or CW Anomaly Detection for 1min Period) | |
| API Gateway | Availability | Count | (Ex. [(4XXError + 5XXError) / Count) * 100] < 10 or CW Anomaly Detection for 1min Period) | Availability as a measure of "abandoned" requests | |
| API Gateway | Latency | Latency (or IntegrationLatency i.e. backend latency) | (Ex. p99 Latency < 1 sec or CW Anomaly Detection for 1min Period) | p99 will have greater tolerance than lower percentile like p90. (p50 is same as average) | |
| API Gateway | Performance | CacheHitCount (and Misses) | (Ex. [CacheMissCount / (CacheHitCount + CacheMissCount) * 100] < 10 or CW Anomaly Detection for 1min Period) | Performance as a measure of Cache (Misses) | |
| Application Load Balancer (ALB) | Availability | RejectedConnectionCount | (Ex.[RejectedConnectionCount/(RejectedConnectionCount + RequestCount) * 100] < 10 CW Anomaly Detection for 1min Period) | Availability as a measure of rejected requests due to max connections breached | |
| Application Load Balancer (ALB) | Latency | TargetResponseTime | (Ex. p99 TargetResponseTime < 1 sec or CW Anomaly Detection for 1min Period) | p99 will have greater tolerance than lower percentile like p90. (p50 is same as average) | |
3.2.3 无服务器
| AWS Service | Feature | Measurement | Metric | Example | Notes |
|---|---|---|---|---|---|
| S3 | Request metrics | Availability | AllRequests | (Ex. [(4XXErrors + 5XXErrors) / AllRequests) * 100] < 10 or CW Anomaly Detection for 1min Period) | Availability as a measure of "abandoned" requests |
| S3 | Request metrics | (Overall) Latency | TotalRequestLatency | (Ex. [p99 TotalRequestLatency] < 100 ms or CW Anomaly Detection for 1min Period) | |
| DynamoDB (DDB) | Availability | ThrottledRequests | (Ex. [ThrottledRequests] < 100 or CW Anomaly Detection for 1min Period) | Availability as a measure of "throttled" requests | |
| DynamoDB (DDB) | Latency | SuccessfulRequestLatency | (Ex. [p99 SuccessfulRequestLatency] < 100 ms or CW Anomaly Detection for 1min Period) | ||
| Step Functions | Availability | ExecutionsFailed | (Ex. ExecutionsFailed = 0) **[ex. Metric Math where m1 is ExecutionsFailed (Step function Execution) UTC time: IF(((DAY(m1)<6 OR ** ** DAY(m1)==7) AND (HOUR(m1)>21 AND HOUR(m1)<7)),m1)] | Assuming business flow that requests completion of step functions as a daily operation 9p-7a during weekdays (start of day business operations) | |
3.2.4 计算和容器
| AWS Service | Feature | Measurement | Metric | Example | Notes |
|---|---|---|---|---|---|
| EKS | Prometheus metrics | Availability | APIServer Request Success Ratio | (ex. Prometheus metric like APIServer Request Success Ratio) | See best practices for monitoring EKS control plane metrics and EKS 可观测性 for details. |
| EKS | Prometheus metrics | Performance | apiserver_request_duration_seconds, etcd_request_duration_seconds | apiserver_request_duration_seconds, etcd_request_duration_seconds | |
| ECS | Availability | Service RUNNING task count | Service RUNNING task count | See ECS CW metrics documentation | |
| ECS | Performance | TargetResponseTime | (ex. [p99 TargetResponseTime] < 100 ms or CW Anomaly Detection for 1min Period) | See ECS CW metrics documentation | |
| EC2 (.NET Core) | CW Agent Performance Counters | Availability | (ex. ASP.NET Application Errors Total/Sec < 'N') | (ex. ASP.NET Application Errors Total/Sec < 'N') | See EC2 CW Application Insights documentation |
3.2.5 数据库 (RDS)
| AWS Service | Feature | Measurement | Metric | Example | Notes |
|---|---|---|---|---|---|
| RDS Aurora | Performance Insights (PI) | Availability | Average active sessions | (Ex. Average active serssions with CW Anomaly Detection for 1min Period) | See RDS Aurora CW PI documentation |
| RDS Aurora | Disaster Recovery (DR) | AuroraGlobalDBRPOLag | (Ex. AuroraGlobalDBRPOLag < 30000 ms for 1min Period) | See RDS Aurora CW documentation | |
| RDS Aurora | Performance | Commit Latency, Buffer Cache Hit Ratio, DDL Latency, DML Latency | (Ex. Commit Latency with CW Anomaly Detection for 1min Period) | See RDS Aurora CW PI documentation | |
| RDS (MSSQL) | PI | Performance | SQL Compilations | (Ex. SQL Compliations > 'M' for 5 min Period) | See RDS CW PI documentation |
4.0 使用 Amazon CloudWatch 和 Metric Math 计算 SLI、SLO 和 SLA
4.1 Amazon CloudWatch 和 Metric Math
Amazon CloudWatch 为 AWS 资源提供监控和可观测性服务。Metric Math 允许您使用 CloudWatch metric 数据执行计算,使其成为计算 SLI、SLO 和 SLA 的理想工具。
4.1.1 启用详细监控
为 AWS 资源启用详细监控以获得 1 分钟的数据粒度,从而实现更准确的 SLI 计算。
4.1.2 使用命名空间和维度组织 Metrics
使用命名空间和维度对 metrics 进行分类和过滤以便于分析。例如,使用命名空间将与特定服务相关的 metrics 分组,使用维度来区分该服务的不同实例。
4.2 使用 Metric Math 计算 SLI
4.2.1 可用性
要计算可用性,将成功请求数除以总请求数:
availability = 100 * (successful_requests / total_requests)
示例:
假设您有一个 API Gateway,具有以下 metrics:
4XXError: Number of 4xx client errors5XXError: Number of 5xx server errorsCount: Total number of requests
使用 Metric Math 计算可用性:
availability = 100 * ((Count - 4XXError - 5XXError) / Count)
4.2.2 延迟
要计算平均延迟,使用 CloudWatch 提供的 SampleCount 和 Sum 统计数据:
average_latency = Sum / SampleCount
示例:
假设您有一个 Lambda 函数,具有以下 metric:
Duration: Time taken to execute the function
使用 Metric Math 计算平均延迟:
average_latency = Duration.Sum / Duration.SampleCount
4.2.3 错误率
要计算错误率,将失败请求数除以总请求数:
error_rate = 100 * (failed_requests / total_requests)
示例:
使用之前的 API Gateway 示例:
error_rate = 100 * ((4XXError + 5XXError) / Count)
4.4 定义和监控 SLO
4.4.1 设定现实的目标
根据用户期望和历史性能数据定义 SLO 目标。设定可实现的目标,以确保服务可靠性和资源利用率之间的平衡。
4.4.2 使用 CloudWatch 监控 SLO
创建 CloudWatch 告警来监控您的 SLI,并在它们接近或违反 SLO 目标时通知您。这使您能够主动解决问题并维护服务可靠性。
4.4.3 审查和调整 SLO
定期审查您的 SLO,以确保它们在服务发展过程中保持相关性。必要时调整目标并将任何变更传达给利益相关者。
4.5 定义和衡量 SLA
4.5.1 设定现实的目标
根据历史性能数据和用户期望定义 SLA 目标。设定可实现的目标,以确保服务可靠性和资源利用率之间的平衡。
4.5.2 监控和告警
设置 CloudWatch 告警来监控 SLI,并在它们接近或违反 SLA 目标时通知您。这使您能够主动解决问题并维护服务可靠性。
4.5.3 定期审查 SLA
定期审查 SLA,以确保它们在服务发展过程中保持相关性。必要时调整目标并将任何变更传达给利益相关者。
4.6 在设定期间内衡量 SLA 或 SLO 性能
要在设定期间(如日历月)内衡量 SLA 或 SLO 性能,使用带有自定义时间范围的 CloudWatch metric 数据。
示例:
假设您有一个 API Gateway,SLO 目标为 99.9% 可用性。要衡量 4 月份的可用性,使用以下 Metric Math 表达式:
availability = 100 * ((Count - 4XXError - 5XXError) / Count)
然后,使用自定义时间范围配置 CloudWatch metric 数据查询:
- Start Time:
2023-04-01T00:00:00Z - End Time:
2023-04-30T23:59:59Z - Period:
2592000(30 days in seconds)
最后,使用 AVG 统计数据计算该月的平均可用性。如果平均可用性等于或大于 SLO 目标,则您已达成目标。
5.0 总结
关键绩效指标 (KPI),即"黄金信号",必须与业务和利益相关者需求保持一致。使用 Amazon CloudWatch 和 Metric Math 计算 SLI、SLO 和 SLA 对于管理服务可靠性至关重要。遵循本指南中概述的最佳实践,有效监控和维护 AWS 资源的性能。记住要启用详细监控、使用命名空间和维度组织 metrics、使用 Metric Math 进行 SLI 计算、设定现实的 SLO 和 SLA 目标,以及使用 CloudWatch 告警建立监控和告警系统。通过应用这些最佳实践,您可以确保最佳的服务可靠性、更好的资源利用率和更高的客户满意度。