Single Cluster Open Source Observability - API Server Monitoring
Objective
This pattern demonstrates how to use the New EKS Cluster Open Source Observability Accelerator with API Server monitoring.
Prerequisites
Ensure that you have installed the following tools on your machine.
Deploying
Please follow the Deploying instructions of the New EKS Cluster Open Source Observability Accelerator pattern, except for step 7, where you need to replace "context" in ~/.cdk.json with the following:
  "context": {
    "fluxRepository": {
      "name": "grafana-dashboards",
      "namespace": "grafana-operator",
      "repository": {
        "repoUrl": "https://github.com/aws-observability/aws-observability-accelerator",
        "name": "grafana-dashboards",
        "targetRevision": "main",
        "path": "./artifacts/grafana-operator-manifests/eks/infrastructure"
      },
      "values": {
        "GRAFANA_CLUSTER_DASH_URL" : "https://raw.githubusercontent.com/aws-observability/aws-observability-accelerator/main/artifacts/grafana-dashboards/eks/infrastructure/cluster.json",
        "GRAFANA_KUBELET_DASH_URL" : "https://raw.githubusercontent.com/aws-observability/aws-observability-accelerator/main/artifacts/grafana-dashboards/eks/infrastructure/kubelet.json",
        "GRAFANA_NSWRKLDS_DASH_URL" : "https://raw.githubusercontent.com/aws-observability/aws-observability-accelerator/main/artifacts/grafana-dashboards/eks/infrastructure/namespace-workloads.json",
        "GRAFANA_NODEEXP_DASH_URL" : "https://raw.githubusercontent.com/aws-observability/aws-observability-accelerator/main/artifacts/grafana-dashboards/eks/infrastructure/nodeexporter-nodes.json",
        "GRAFANA_NODES_DASH_URL" : "https://raw.githubusercontent.com/aws-observability/aws-observability-accelerator/main/artifacts/grafana-dashboards/eks/infrastructure/nodes.json",
        "GRAFANA_WORKLOADS_DASH_URL" : "https://raw.githubusercontent.com/aws-observability/aws-observability-accelerator/main/artifacts/grafana-dashboards/eks/infrastructure/workloads.json",
        "GRAFANA_APISERVER_BASIC_DASH_URL" : "https://raw.githubusercontent.com/aws-observability/aws-observability-accelerator/main/artifacts/grafana-dashboards/eks/apiserver/apiserver-basic.json",
        "GRAFANA_APISERVER_ADVANCED_DASH_URL" : "https://raw.githubusercontent.com/aws-observability/aws-observability-accelerator/main/artifacts/grafana-dashboards/eks/apiserver/apiserver-advanced.json",
        "GRAFANA_APISERVER_TROUBLESHOOTING_DASH_URL" : "https://raw.githubusercontent.com/aws-observability/aws-observability-accelerator/main/artifacts/grafana-dashboards/eks/apiserver/apiserver-troubleshooting.json",
        "GRAFANA_KSH_DASH_URL" : "https://raw.githubusercontent.com/aws-observability/aws-observability-accelerator/main/artifacts/grafana-dashboards/eks/infrastructure/ksh.json",
        "GRAFANA_KCM_DASH_URL" : "https://raw.githubusercontent.com/aws-observability/aws-observability-accelerator/main/artifacts/grafana-dashboards/eks/infrastructure/kcm.json"
      },
      "kustomizations": [
        {
          "kustomizationPath": "./artifacts/grafana-operator-manifests/eks/infrastructure"
        },
        {
          "kustomizationPath": "./artifacts/grafana-operator-manifests/eks/apiserver"
        }
      ]
    },
    "apiserver.pattern.enabled": true,
  }
Visualization
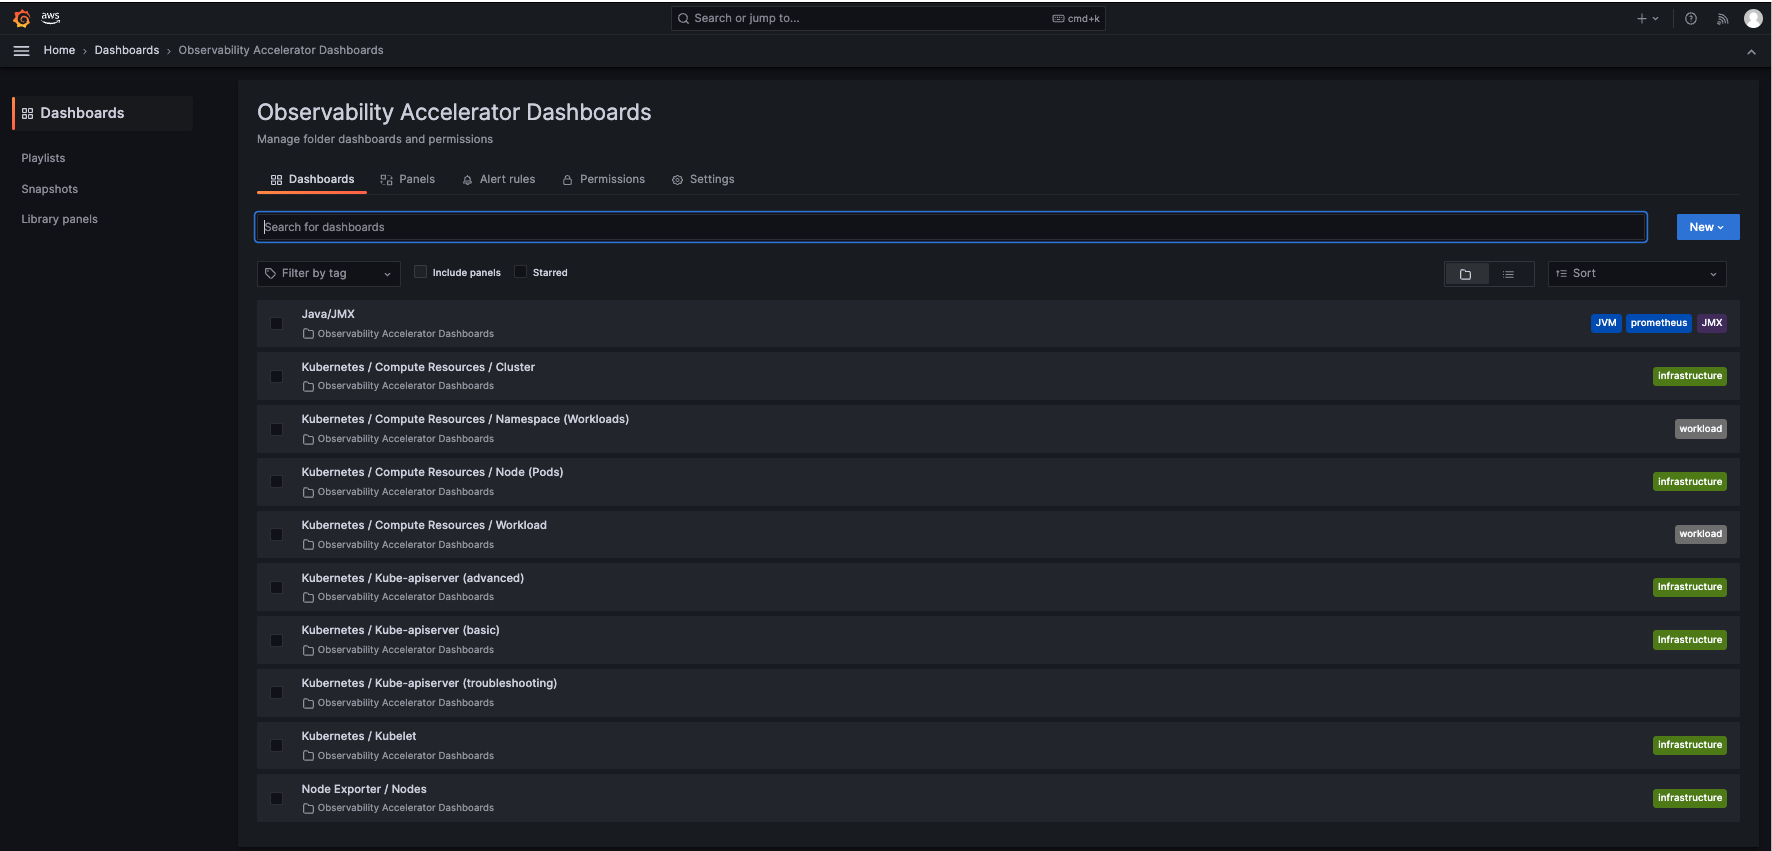
Login to your Grafana workspace and navigate to the Dashboards panel. You should see three new dashboard named Kubernetes/Kube-apiserver (basic), Kubernetes/Kube-apiserver (advanced), Kubernetes/Kube-apiserver (troubleshooting), under Observability Accelerator Dashboards:
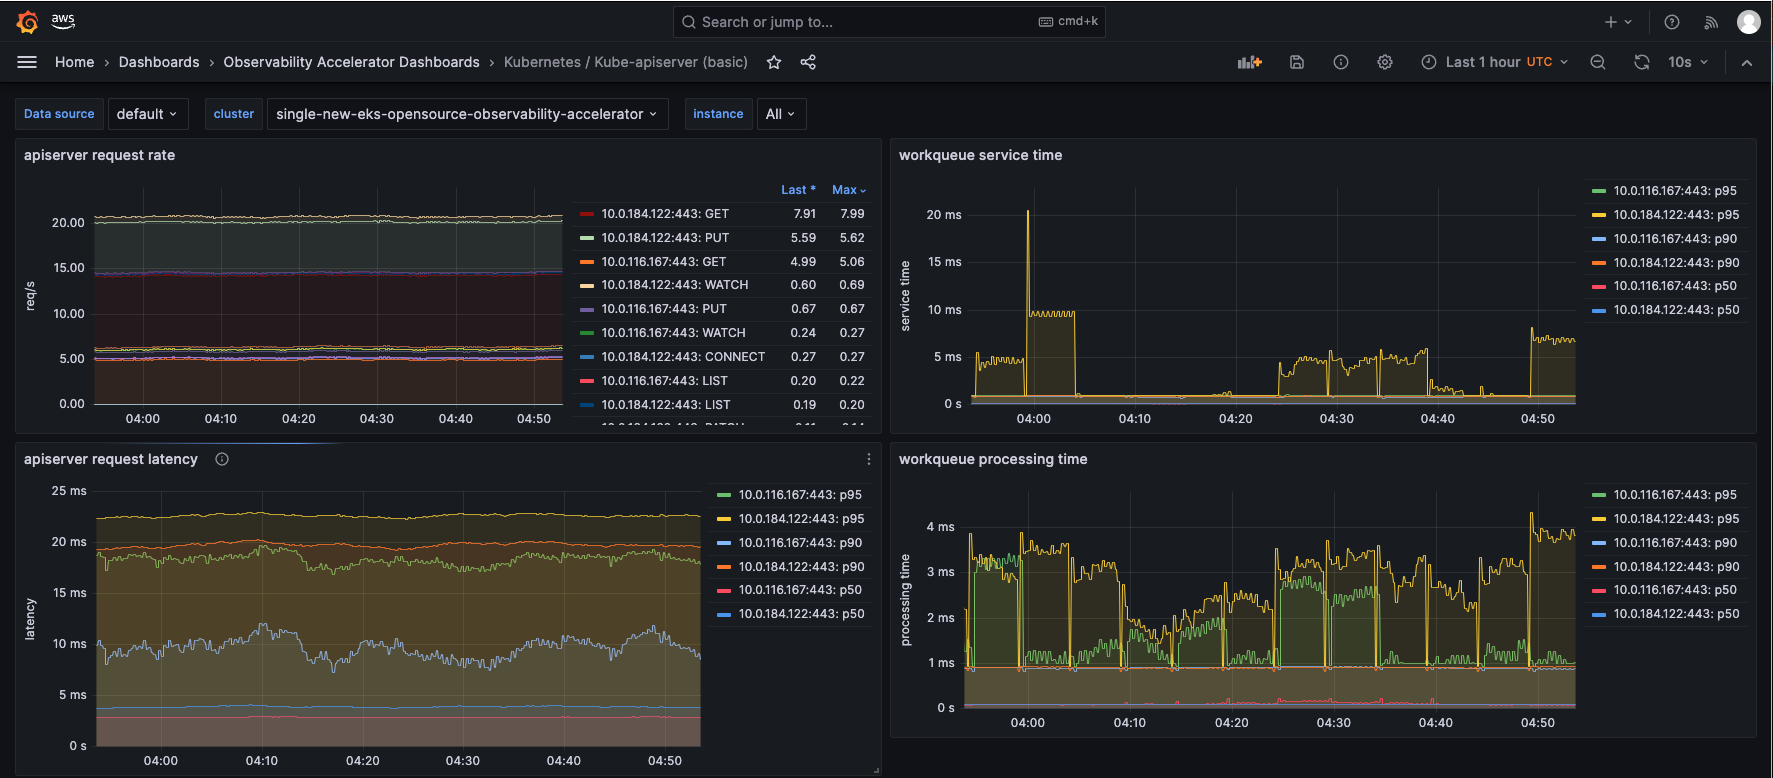
Open the Kubernetes/Kube-apiserver (basic) dashboard and you should be able to view its visualization as shown below:
Open the Kubernetes/Kube-apiserver (advanced) dashboard and you should be able to view its visualization as shown below:

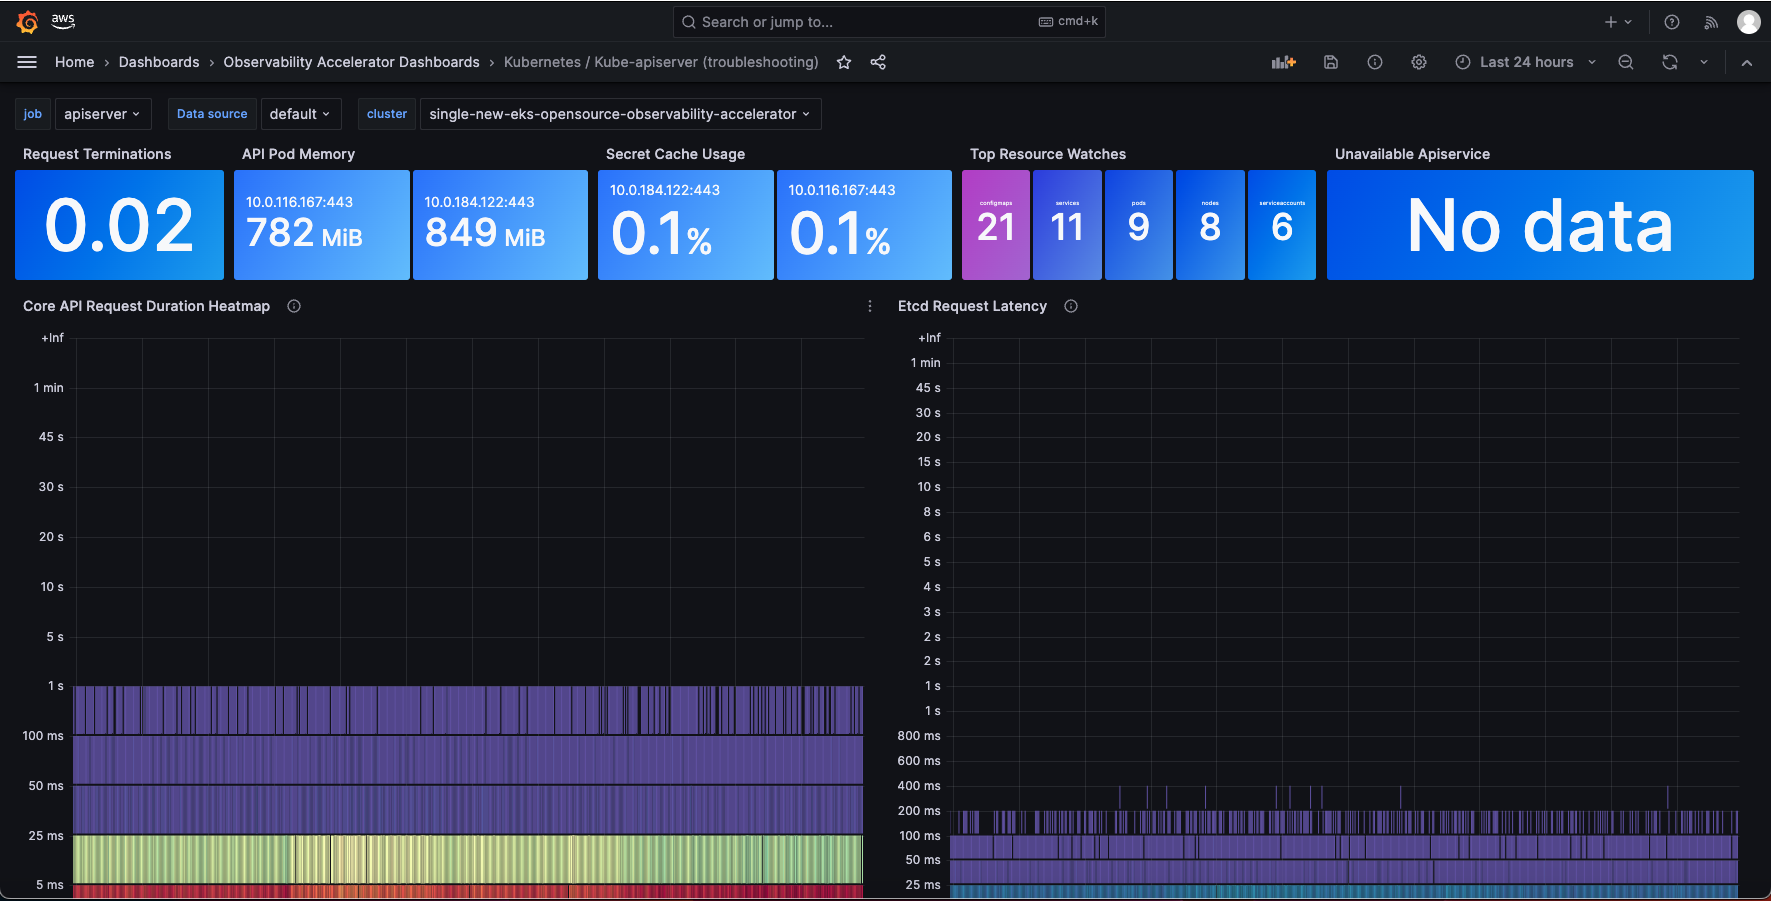
Open the Kubernetes/Kube-apiserver (troubleshooting) dashboard and you should be able to view its visualization as shown below:
Teardown
You can teardown the whole CDK stack with the following command:
make pattern single-new-eks-opensource-observability destroy