Single Cluster AWS Native Observability
Architecture
The following figure illustrates the architecture of the pattern we will be deploying for Single EKS Cluster Native Observability pattern using AWS native tools such as CloudWatch Logs and Container Insights.
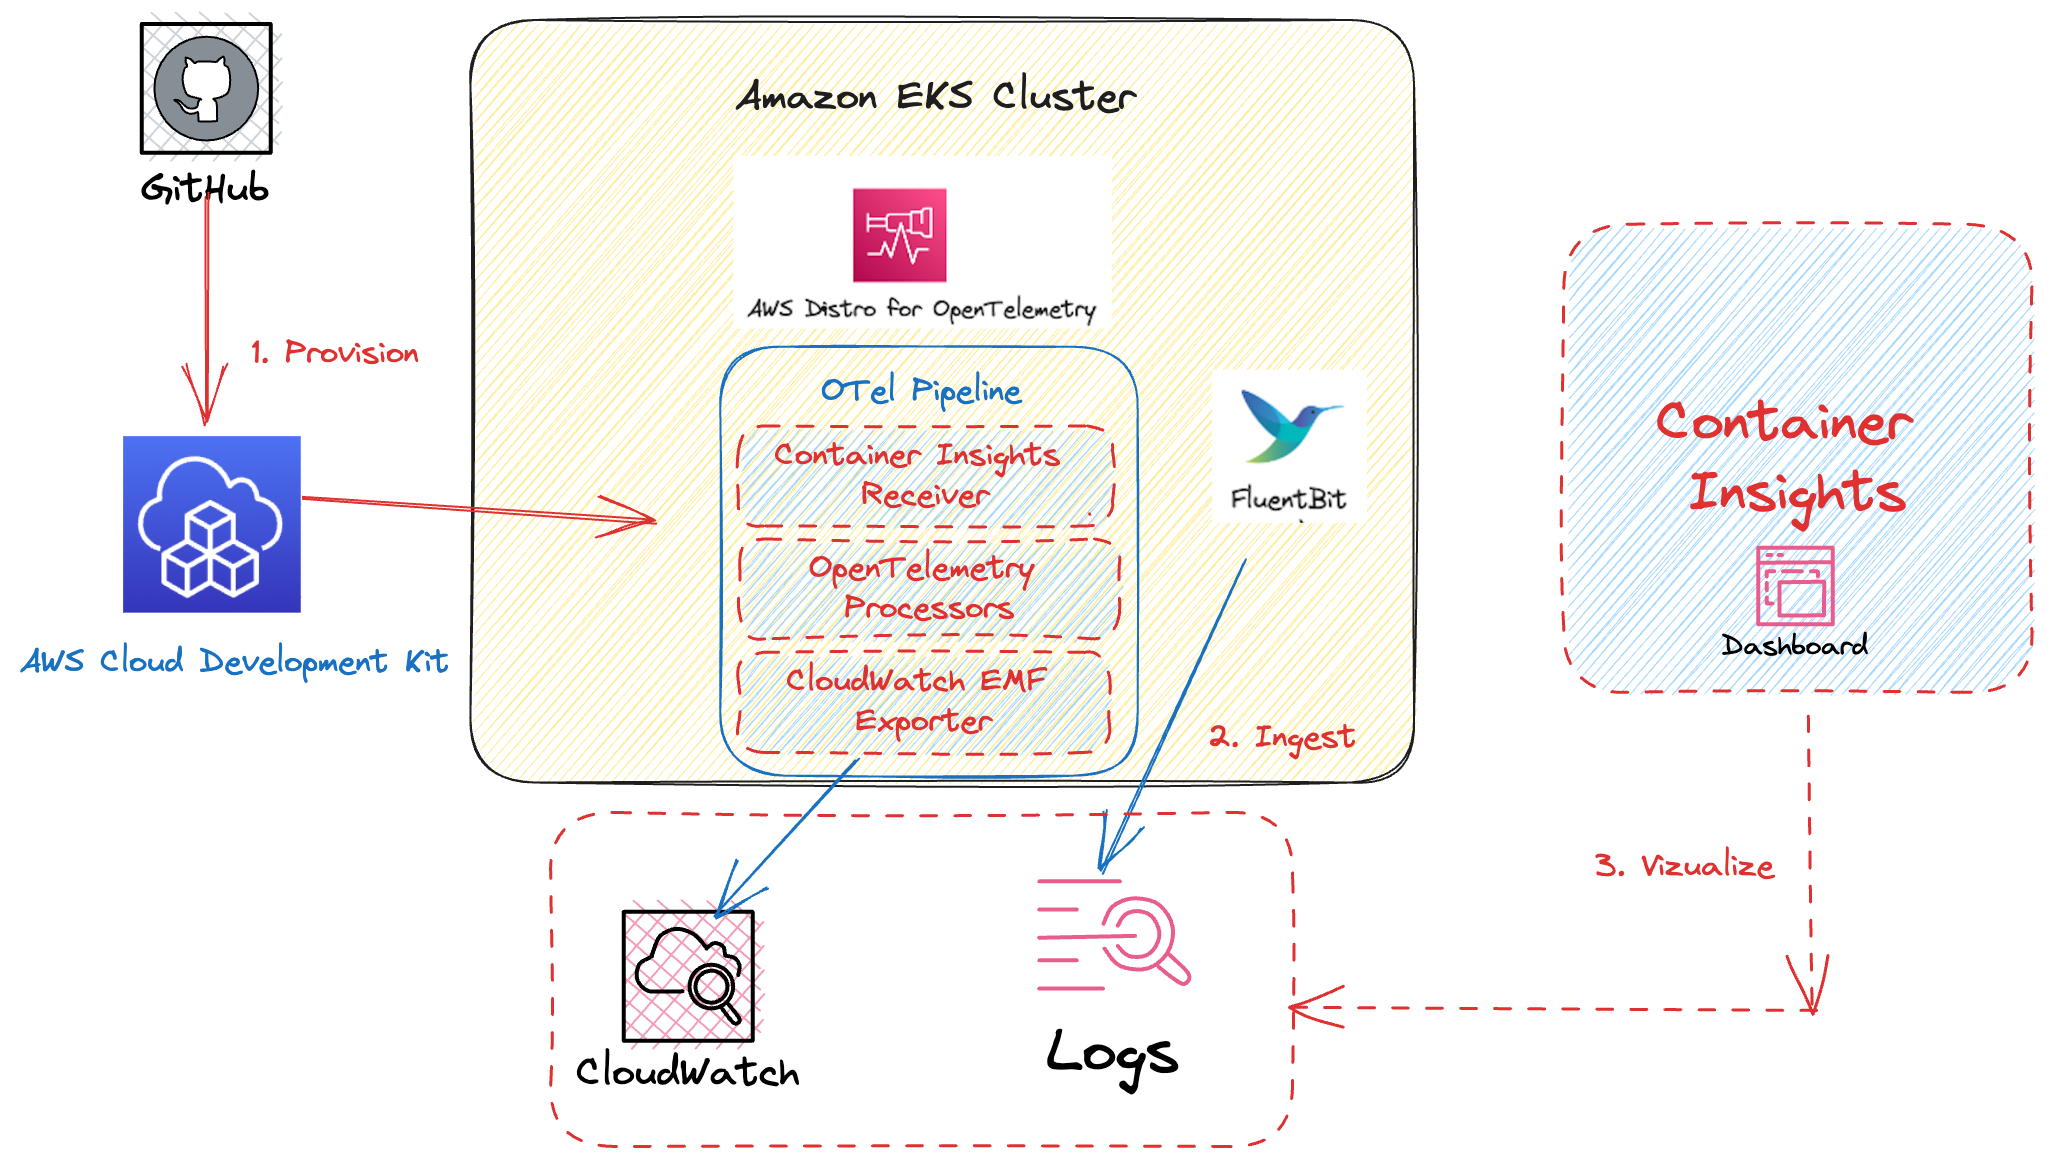
This example makes use of CloudWatch Container Insights as a vizualization and metric-aggregation layer. Amazon CloudWatch Container Insights helps customers collect, aggregate, and summarize metrics and logs from containerized applications and microservices. Metrics data is collected as performance log events using the embedded metric format. These performance log events use a structured JSON schema that enables high-cardinality data to be ingested and stored at scale. From this data, CloudWatch creates aggregated metrics at the cluster, node, pod, task, and service level as CloudWatch metrics. The metrics that Container Insights collects are available in CloudWatch automatic dashboards.
By combining Container Insights and CloudWatch logs, we are able to provide a foundation for EKS (Amazon Elastic Kubernetes Service) Observability. Monitoring EKS for metrics has two categories: the control plane and the Amazon EKS nodes (with Kubernetes objects). The Amazon EKS control plane consists of control plane nodes that run the Kubernetes software, such as etcd and the Kubernetes API server. To read more on the components of an Amazon EKS cluster, please read the service documentation.
Objective
- Deploys one production grade Amazon EKS cluster.
- Enables Control Plane Logging.
- AWS Distro For OpenTelemetry Operator and Collector
- Logs with AWS for FluentBit and CloudWatch Logs
- Enables CloudWatch Container Insights.
- Installs Prometheus Node Exporter for infrastructure metrics.
Prerequisites:
Ensure that you have installed the following tools on your machine.
Deploying
- Clone your forked repository
git clone https://github.com/aws-observability/cdk-aws-observability-accelerator.git
- Install the AWS CDK Toolkit globally on your machine using
npm install -g aws-cdk
-
Install project dependencies by running
npm installin the main folder of this cloned repository -
Once all pre-requisites are set you are ready to deploy the pipeline. Run the following command from the root of this repository to deploy the pipeline stack:
make build
make pattern single-new-eks-awsnative-observability deploy
Verify the resources
Run update-kubeconfig command. You should be able to get the command from CDK output message.
aws eks update-kubeconfig --name single-new-eks-awsnative-observability-accelerator --region <your region> --role-arn arn:aws:iam::xxxxxxxxx:role/single-new-eks-awsnative-singleneweksawsnativeobs-JN3QM2KMBNCO
Let’s verify the resources created by steps above.
kubectl get nodes -o wide
NAME                                         STATUS   ROLES    AGE    VERSION               INTERNAL-IP    EXTERNAL-IP   OS-IMAGE         KERNEL-VERSION                  CONTAINER-RUNTIME
ip-10-0-104-200.us-west-2.compute.internal   Ready    <none>   2d1h   v1.25.9-eks-0a21954   10.0.104.200   <none>        Amazon Linux 2   5.10.179-168.710.amzn2.x86_64   containerd://1.6.19
Next, lets verify the namespaces in the cluster:
kubectl get ns # Output shows all namespace
Output:
NAME                       STATUS   AGE
amazon-cloudwatch          Active   5h36m
cert-manager               Active   5h36m
default                    Active   5h46m
kube-node-lease            Active   5h46m
kube-public                Active   5h46m
kube-system                Active   5h46m
prometheus-node-exporter   Active   5h36m
Visualization
Navigate to CloudWatch and go to "Container Insights".
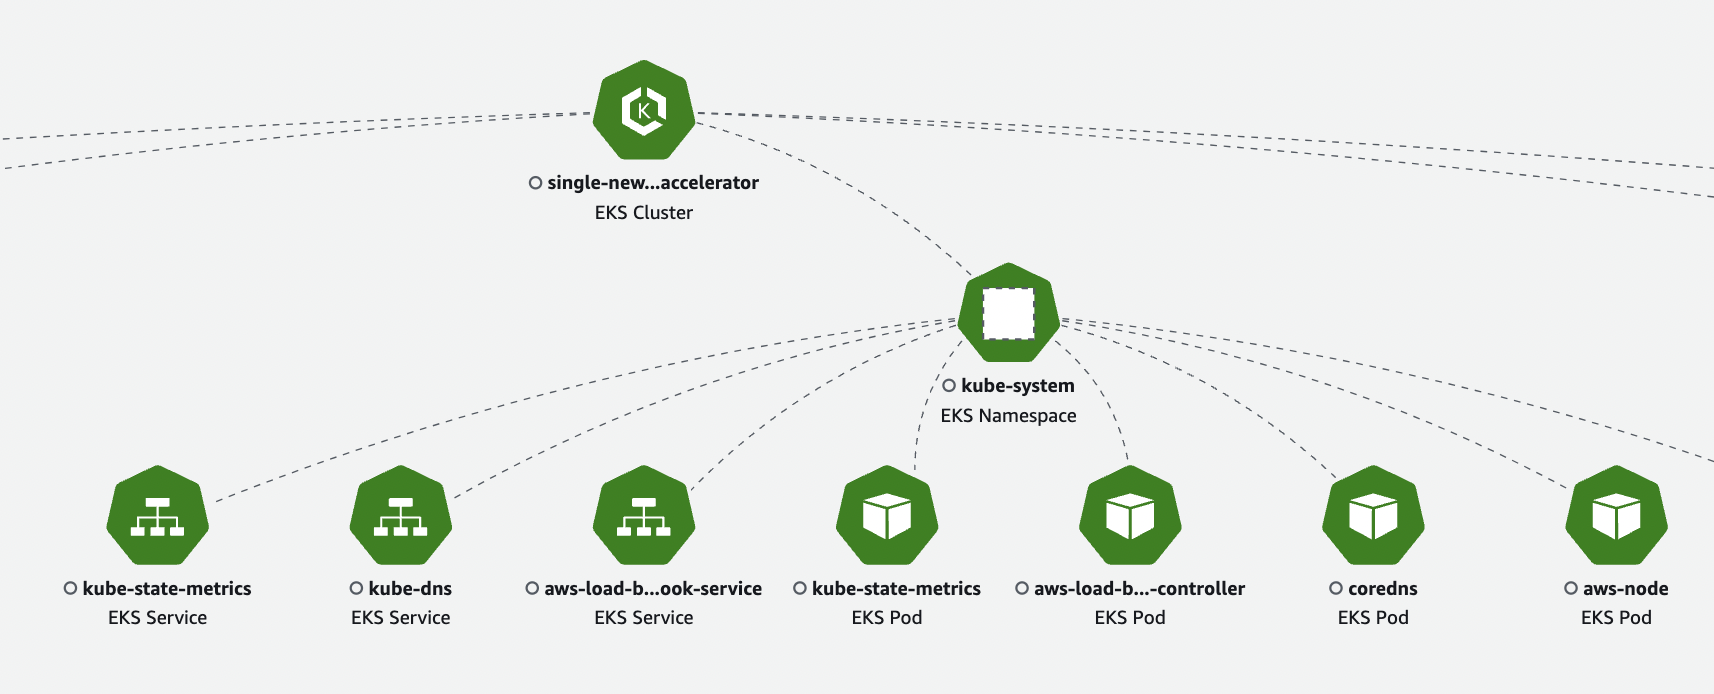
View the Container Map:
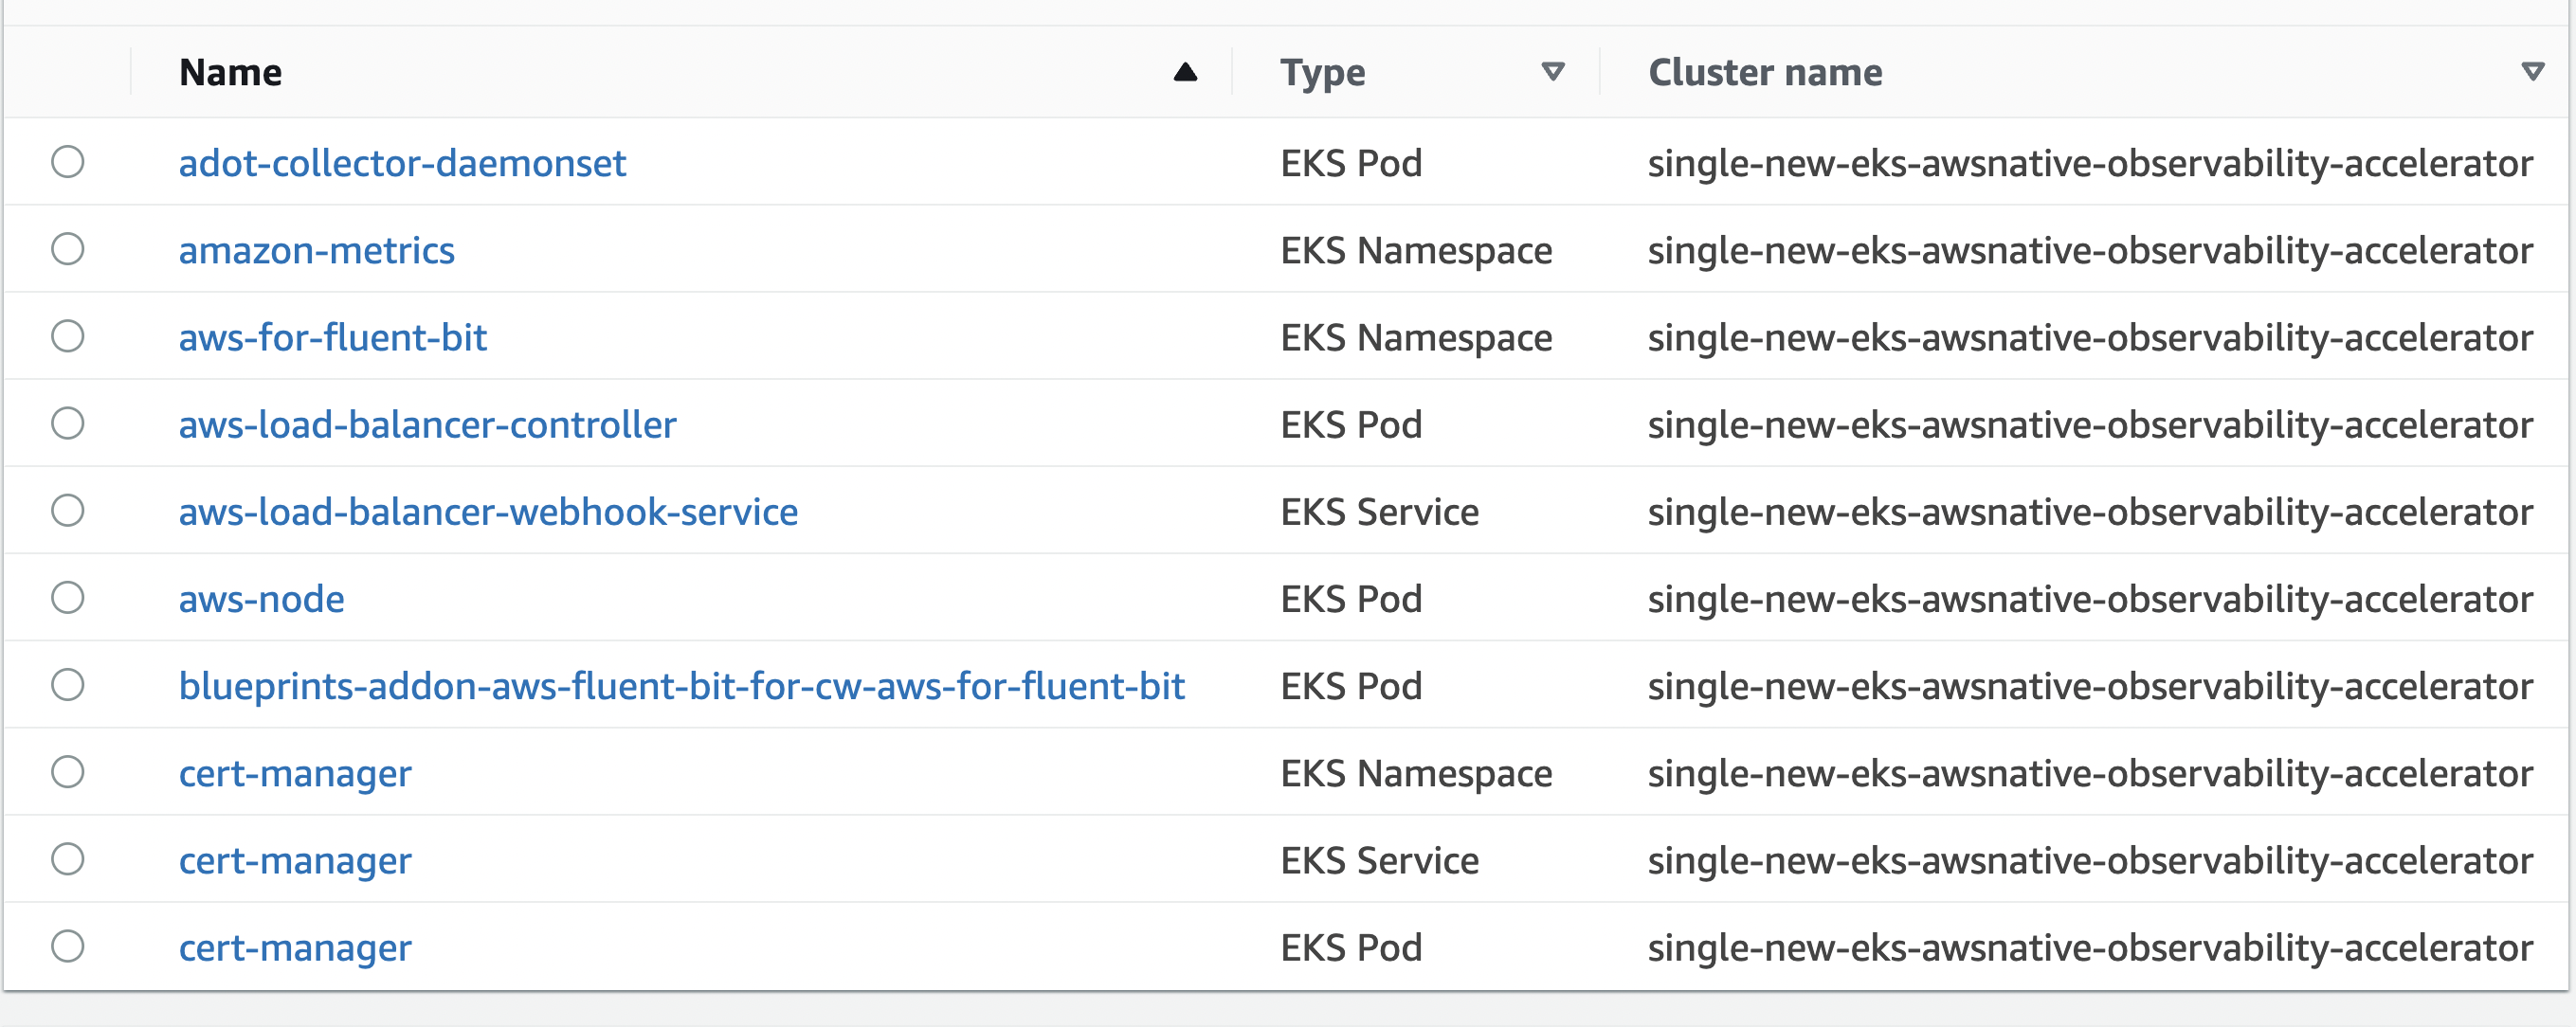
View the Resource List:
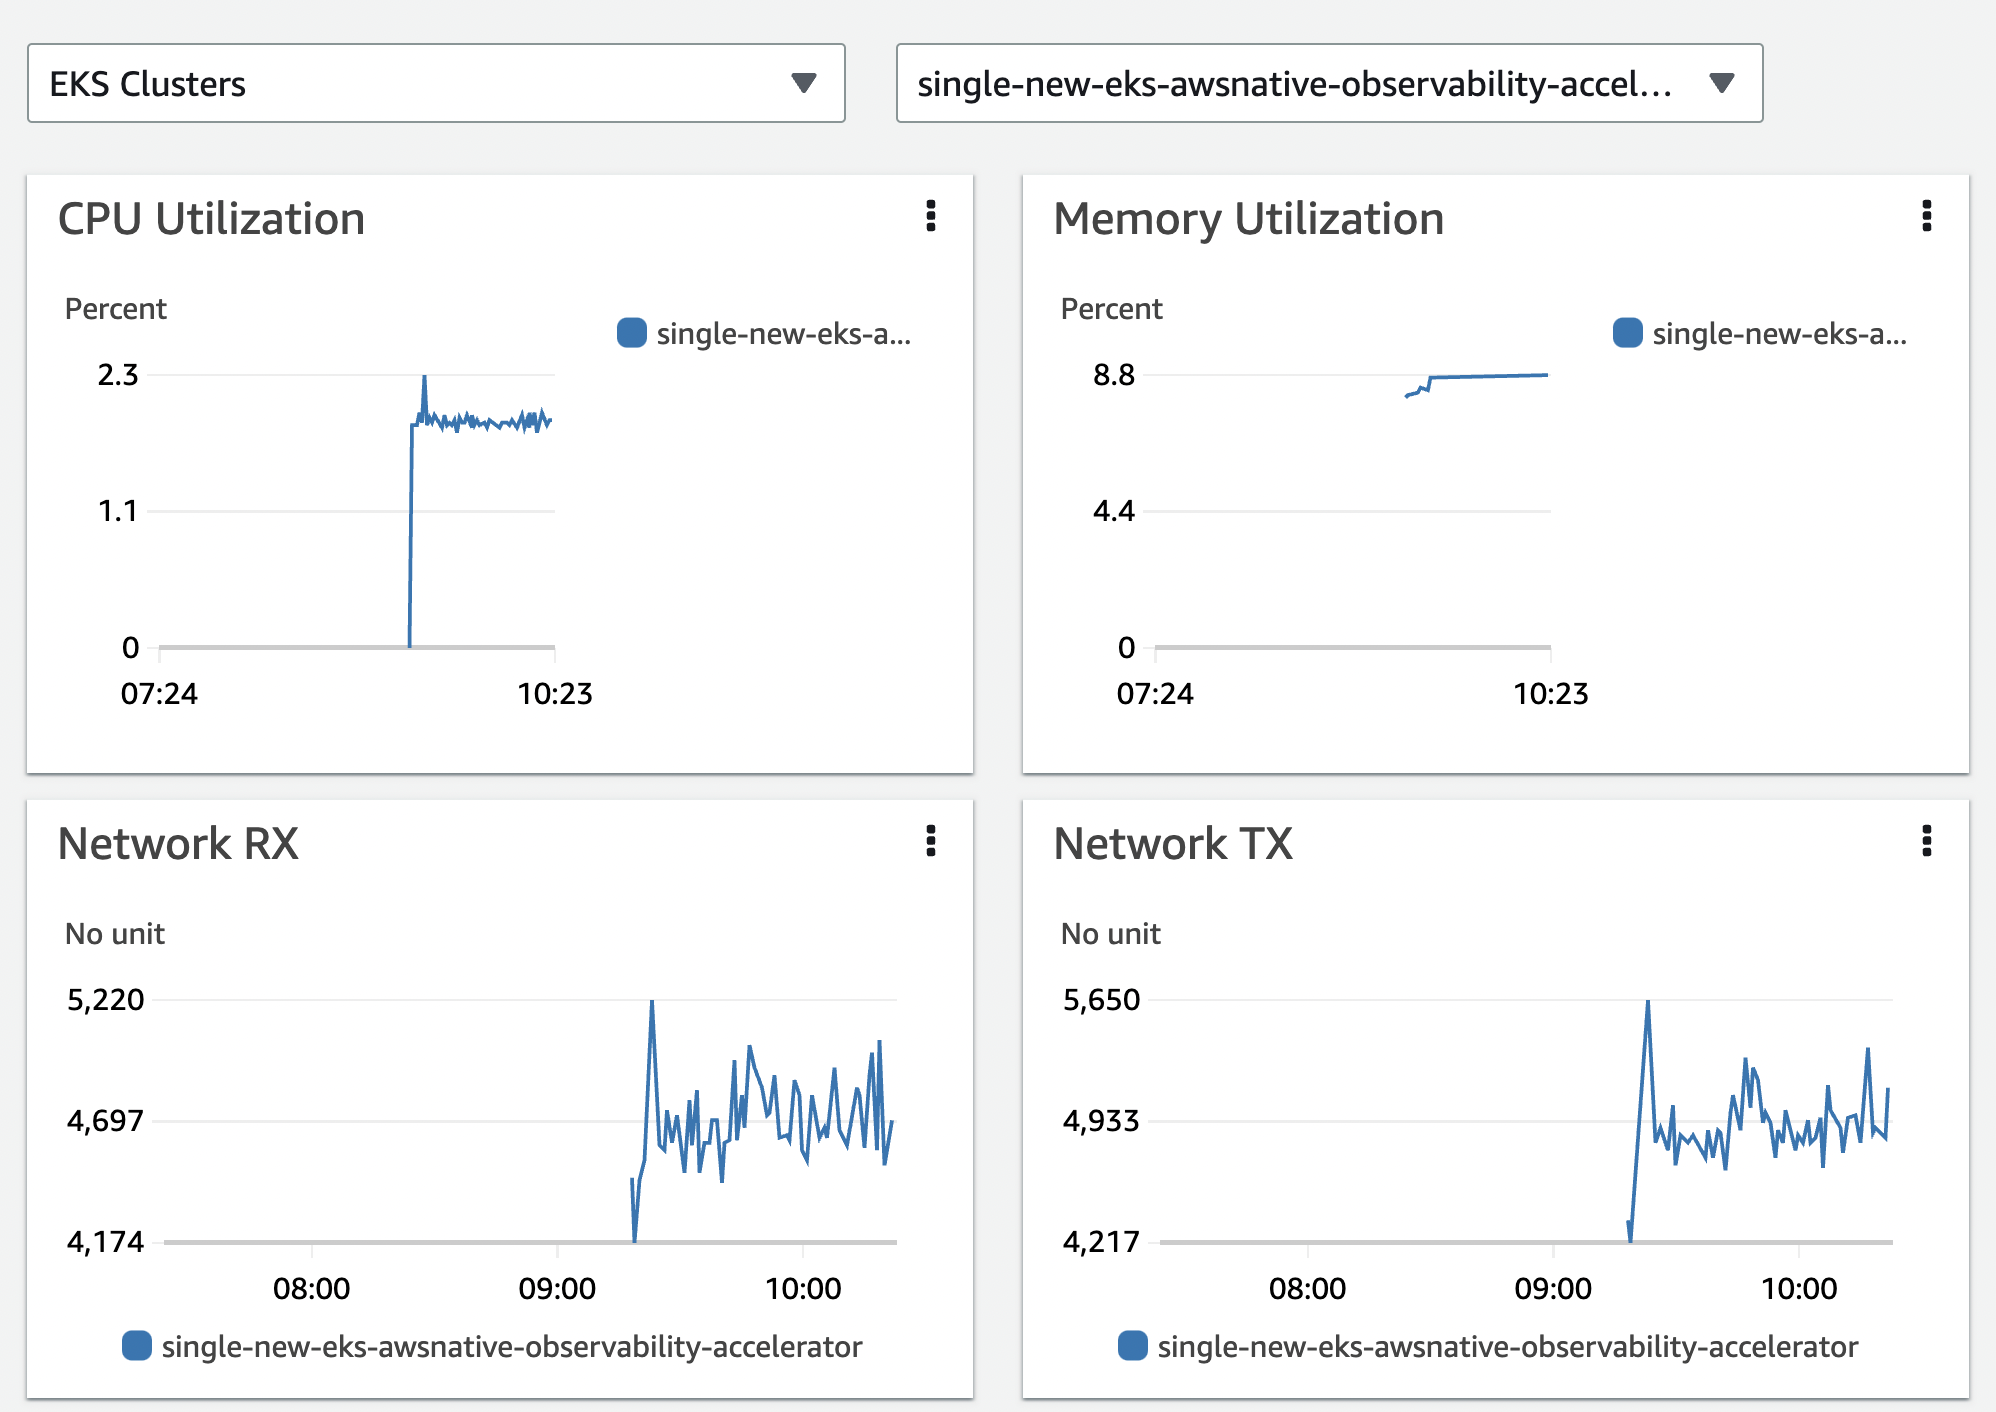
View the Performance Monitoring Dashboard:
Viewing Logs
Refer to "Using CloudWatch Logs Insights to Query Logs in Logging.
Enabling Application Signals for your services
Amazon CloudWatch Application Signals is a new integrated native APM experience in AWS. CloudWatch Application Signals supports Java and Python applications running on your Amazon EKS cluster.
If you haven't enabled Application Signals in this account yet, follow steps 1 - 4 in our AWS documentation.
Next, you have to update your Application to
Configure application metrics and trace sampling. For this, you must add an
annotation to a manifest YAML in your cluster. Adding this annotation
auto-instruments the application to send metrics, traces, and logs to
Application Signals. You have two options for the annotation:
-
Annotate Workload auto-instruments a single workload in the cluster.
- Paste the below line into the PodTemplate section of the workload manifest.
apiVersion: apps/v1 kind: Deployment spec: template: metadata: # add this annotation under the pod template metadata of the services deployment YAML you want to monitor annotations: instrumentation.opentelemetry.io/inject-java: "true" instrumentation.opentelemetry.io/inject-python: "true" ... - In your terminal, enter
kubectl apply -f your_deployment_yamlto apply the change.
- Paste the below line into the PodTemplate section of the workload manifest.
-
Annotate Namespace auto-instruments all workloads deployed in the selected namespace.
- Paste the below line into the metadata section of the namespace manifest.
annotations: instrumentation.opentelemetry.io/inject-java: "true" apiVersion: apps/v1 kind: Namespace metadata: name: <your_namespace> # add this annotation under metadata of the namespace manifest you want to monitor annotations: instrumentation.opentelemetry.io/inject-java: "true" instrumentation.opentelemetry.io/inject-python: "true" ... - In your terminal, enter
kubectl apply -f your_namespace_yamlto apply the change. - In your terminal, enter a command to restart all pods in the namespace. An example command to restart deployment workloads is
kubectl rollout restart deployment -n namespace_name
- Paste the below line into the metadata section of the namespace manifest.
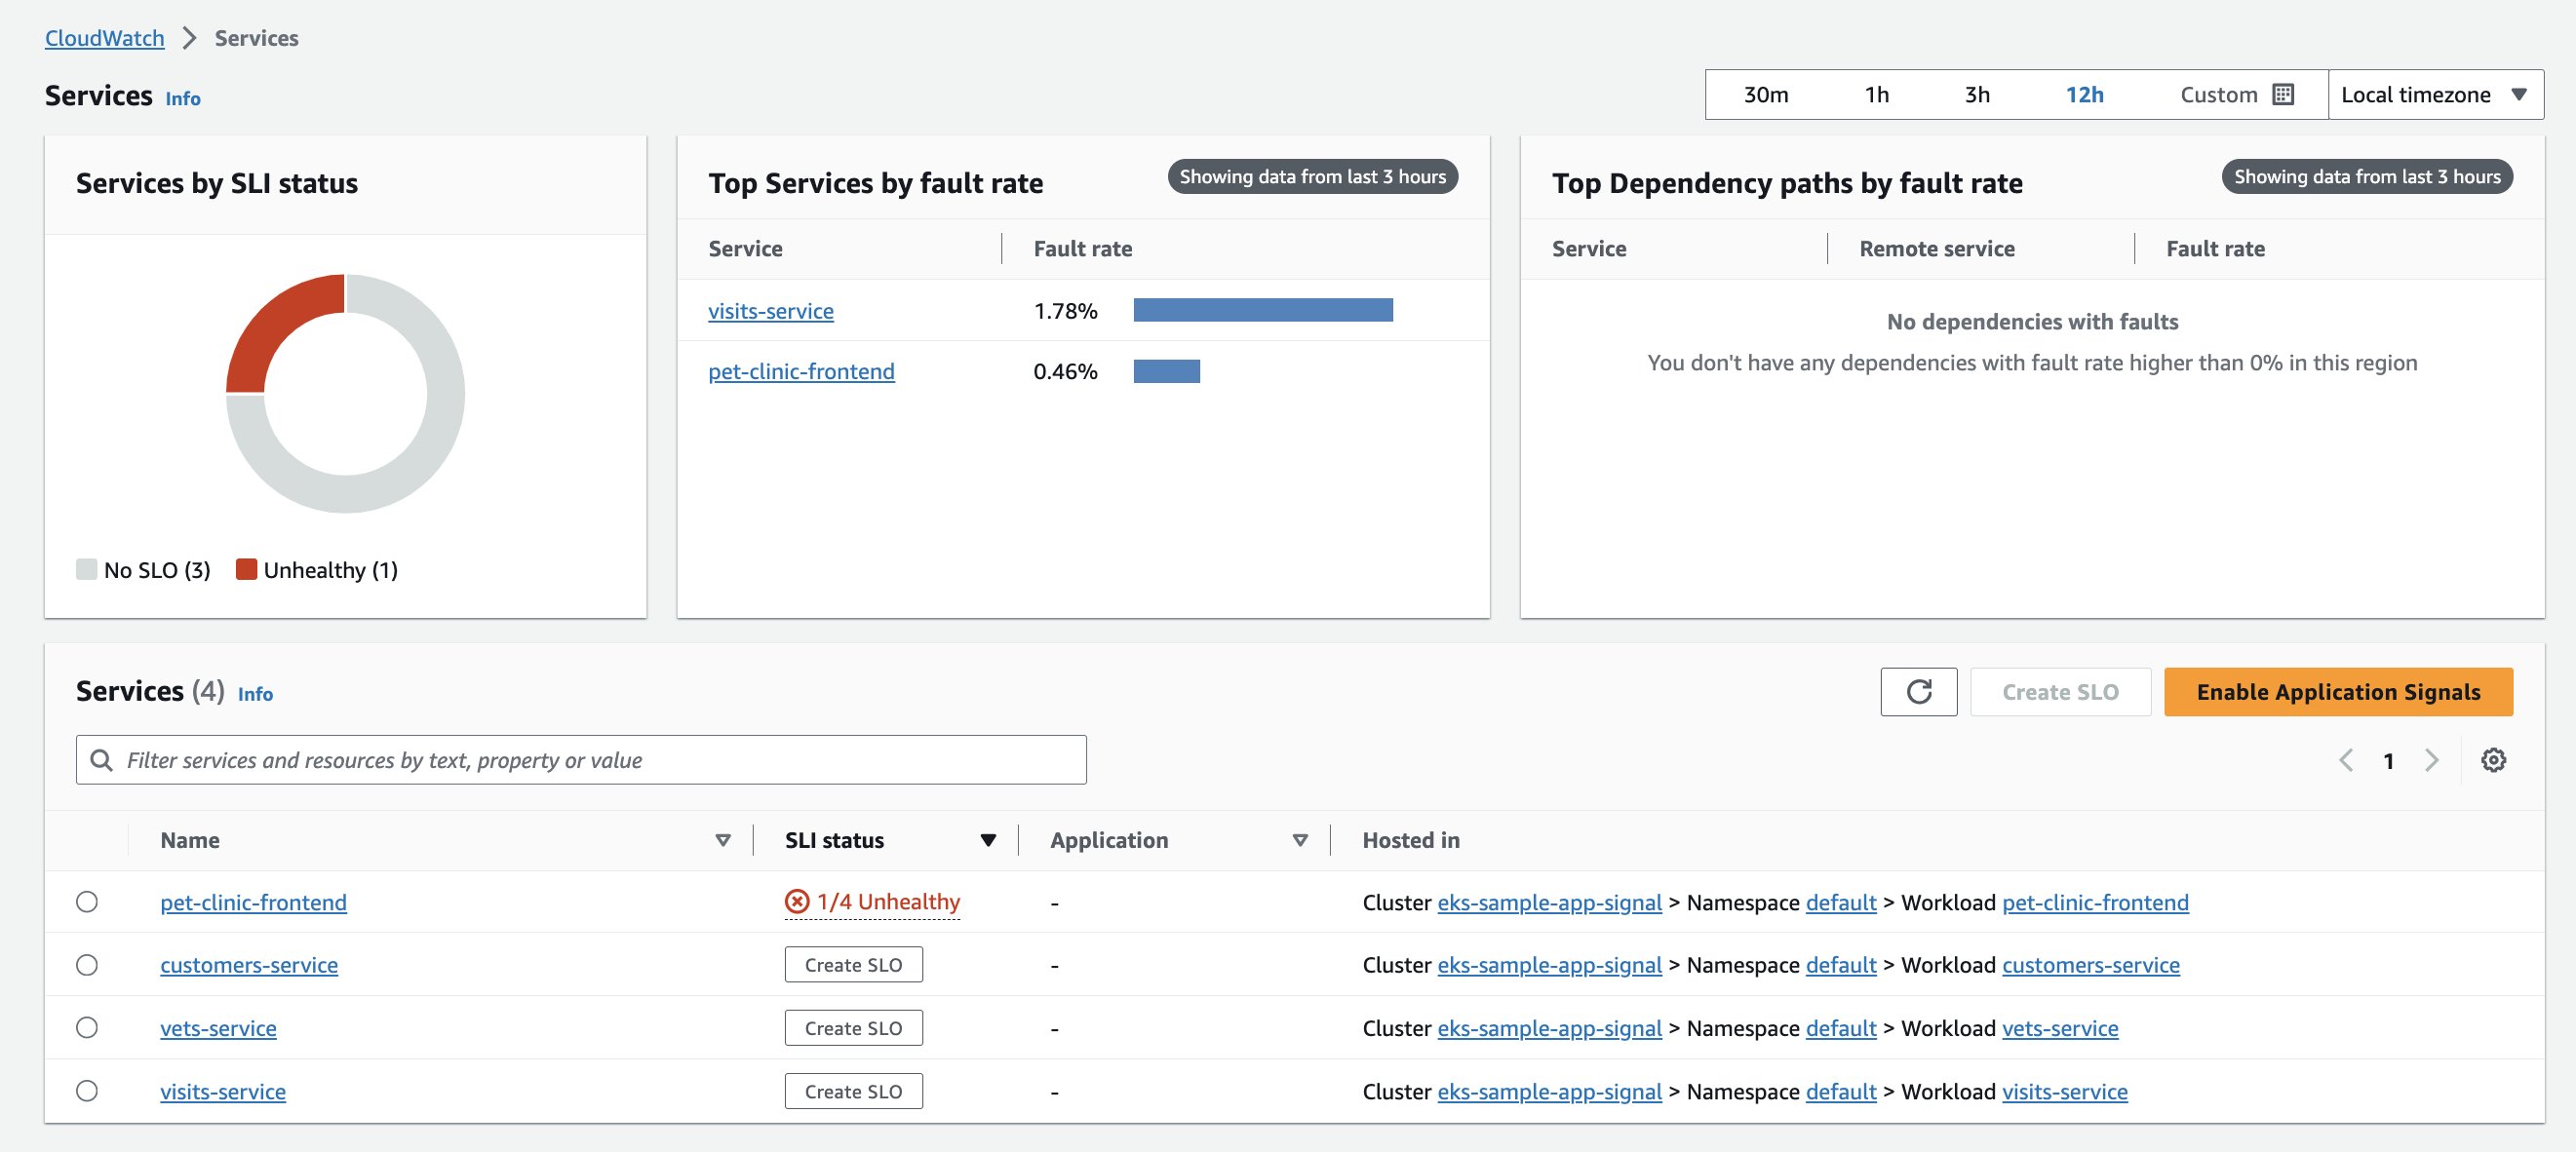
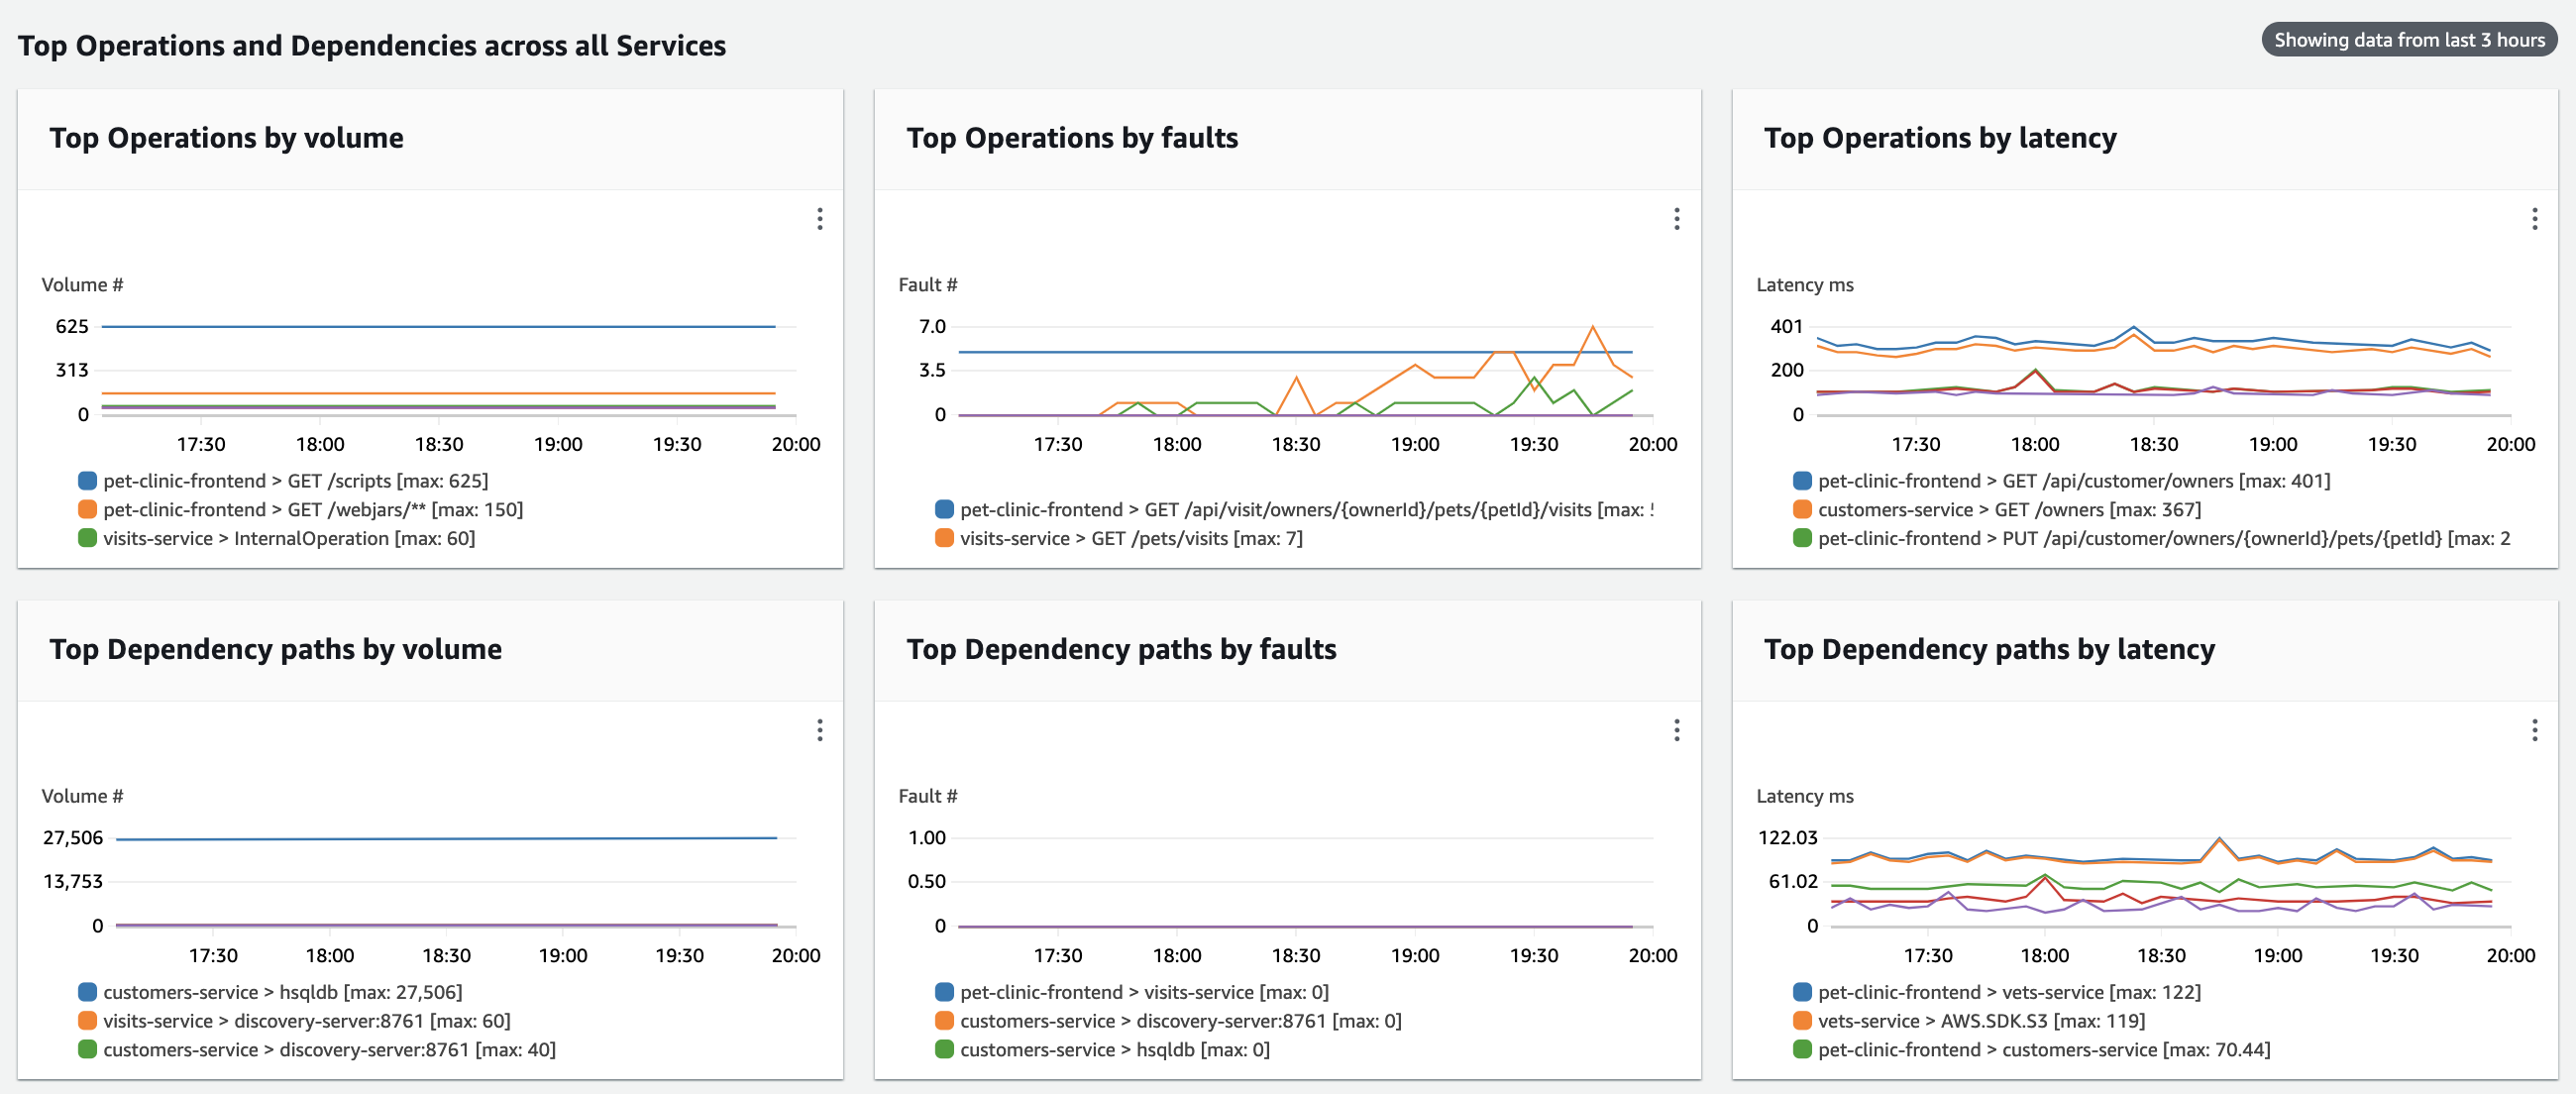
Visualization of CloudWatch Application Signals data
After enabling your Application to pass metrics and traces by following
the steps provided above,
open your Amazon CloudWatch console in the same region as your EKS cluster,
then from the left hand side choose Application Signals -> Services and you
will see the metrics shown on the sample dashboard below:
Teardown
You can teardown the whole CDK stack with the following command:
make pattern single-new-eks-awsnative-observability destroy